

| Journal of Endocrinology and Metabolism, ISSN 1923-2861 print, 1923-287X online, Open Access |
| Article copyright, the authors; Journal compilation copyright, J Endocrinol Metab and Elmer Press Inc |
| Journal website https://www.jofem.org |
Original Article
Volume 13, Number 4, November 2023, pages 135-143

Triglyceride Glucose-Waist Circumference Is Superior to Other Biochemical Indicators for Diagnosing Prehypertension and Hypertension
Victor Juan Vera-Poncea, d ![]() , Rosa A. Garcia-Larab
, Rosa A. Garcia-Larab ![]() , Jenny Raquel Torres-Malcaa
, Jenny Raquel Torres-Malcaa ![]() , Joan A. Loayza-Castroa
, Joan A. Loayza-Castroa ![]() , Andrea P. Ramirez-Ortegaa
, Andrea P. Ramirez-Ortegaa ![]() , Fiorella E. Zuzunaga-Montoyab
, Fiorella E. Zuzunaga-Montoyab ![]() , Cori Raquel Iturregui Paucarc
, Cori Raquel Iturregui Paucarc ![]() , Jhony A. De La Cruz-Vargasa
, Jhony A. De La Cruz-Vargasa ![]()
aInstituto de Investigaciones en Ciencias Biomedicas, Universidad Ricardo Palma, Lima, Peru
bUniversidad Cientifica del Sur, Lima, Peru
cUniversidad Tecnologica del Peru, Lima, Peru
dCorresponding Author: Victor Juan Vera-Ponce, Instituto de Investigaciones en Ciencias Biomedicas, Universidad Ricardo Palma, Lima, Peru
Manuscript submitted May 28, 2023, accepted July 1, 2023, published online October 21, 2023
Short title: TyG-WC Diagnosing Prehypertension and HTN
doi: https://doi.org/10.14740/jem886
| Abstract | ▴Top |
Background: In situations with economic issues and limited resources, prevention and early detection of hypertension are essential for its control. Diagnosis and treatment require considerable expenses, which could lead to an incomplete diagnosis and, therefore, a higher prevalence. The aim of this study was to evaluate the usefulness of eight biochemical indices as diagnostic tools for prehypertension and hypertension.
Methods: This is a diagnostic testing study. The variables were hypertension and prehypertension. Among the markers evaluated were triglycerides/high-density lipoprotein cholesterol (HDL-C), cholesterol/HDL-C, low-density lipoprotein (LDL)/HDL-C, visceral adiposity index, lipid accumulation product, the triglyceride-glucose (TyG) index, TyG-waist circumference (TyG-WC), and TyG-body mass index (TyG-BMI). The receiver operating characteristic (ROC) curve analysis was used as a statistical and graphical method to evaluate diagnostic capacity, as well as the area under the curve (AUC) corresponding to each response variable. Sensitivity (Se) and specificity (Sp) were calculated, along with their 95% confidence intervals (95% CIs).
Results: The prevalence of undiagnosed prehypertension and hypertension was 6.88% and 2.72%, respectively. The TyG-WC has been the best indicator for both prehypertension: AUC = 0.712 (95% CI: 0.650 - 0.775), cutoff = 762.56, Se = 90.74 (95% CI: 79.70 - 96.92), and Sp = 45.24 (95% CI: 41.61 - 48.92), in terms of diagnostic capacity. The same applies to hypertension: AUC = 0.801 (95% CI: 0.718 - 0.883), cutoff = 862.57, Se = 81.81 (95% CI: 59.72 - 94.81), and Sp = 70.18 (95% CI: 66.84 - 73.35).
Conclusions: The TyG-WC is the best diagnostic tool for prehypertension and hypertension; hence, it is necessary to conduct prospective research to verify these findings. If confirmed, the TyG-WC can be used as a marker for the prognosis of these two conditions and, thus, to make decisions about prevention.
Keywords: Prehypertension; Hypertension; Waist circumference; Triglycerides; Glucose
| Introduction | ▴Top |
Hypertension (HTN) is characterized by high systolic blood pressure (SBP) and/or diastolic blood pressure (DBP) and constitutes a major public health issue globally [1]. Between 20% and 40% of female and male patients respectively have HTN in Latin America [2, 3]. In Peru, 17.4% of those aged 15 and over have high blood pressure [4].
Covering the costs for diagnosis and treatment of HTN and its associated complications can be expensive; this could lead to insufficient diagnosis and ultimately, a higher prevalence of the disease [5]. Early detection and prevention are vital for control, especially when resources are limited [6, 7].
The use of simple and reliable markers that combine laboratory analyses or anthropometric measurements have been considered as potential contributors in the early and efficient detection of HTN. This facilitates the inclusion of precise preventive and therapeutic measures [8-10]. Likewise, the use of markers could contribute to an optimal understanding of underlying pathophysiological mechanisms and the evaluation of associated risk. This improves the clinical management of users and improves public health outcomes. While some markers have shown long-term diagnostic or associative power, others have not had successful results [10-16]. Moreover, the choice of cut-off points is still problematic, as there is still a lack of evidence in Latin American populations.
Given this, the present study aimed to evaluate the usefulness of eight biochemical indices as diagnostic tools for prehypertension and HTN.
| Materials and Methods | ▴Top |
Study design and context
This is a diagnostic test study. The analysis is secondary to the data from the 2017 - 2018 Surveillance Survey of Nutrition and Food by Life Stages (VIANEV), which was prepared by the National Center for Food and Nutrition (CENAN) in Peru [17]. The STROBE (Strengthening the Reporting of Observational Studies in Epidemiology) guidelines [18] and the STARD (Standards for Reporting of Diagnostic Accuracy Studies) statement [19] have been considered.
Population, sample, and eligibility criteria
The 2017 - 2018 VIANEV survey contains data from three areas: Metropolitan Lima (the Peruvian capital), as well as other urban and rural areas, and for this, a stratified, random, multi-stage, and independent sampling method was used [17]. The sample was obtained in two phases: the primary sampling unit was randomly chosen clusters, while the secondary sampling covered randomly selected households with adults aged 18 to 59 years who had fasted for 9 to 12 h. The VIANEV survey’s sample base was formed by households included in the National Household Survey (ENAHO), which covered 1,296 clusters (176 in Metropolitan Lima and Callao, 696 in other urban areas, and 424 in rural areas). The inference was executed in Peru, in the urban, rural sector, and in Metropolitan Lima (capital of Peru). More details about the methodology can be found in the Technical Report of the 2017 - 2018 VIANEV survey and in previous research [17].
In this work, those with the study variables were included. Meanwhile, patients with a previous diagnosis of HTN or prehypertension were discarded.
Definition of variables
The response variables were: 1) HTN, which was defined if they presented any of the following conditions: SBP ≥ 140 mm Hg or DBP ≥ 90 mm Hg [20]; and 2) prehypertension, which was defined if they presented: SBP ≥ 120 - 139 mm Hg or DBP ≥ 80 - 89 mm Hg.
The biomarkers that were put to the test were:
Triglycerides/high-density lipoprotein cholesterol (HDL-C) = triglycerides (mg/dL)/HDL-C (mg/dL)
Cholesterol/HDL-C = total cholesterol (mg/dL)/HDL-C (mg/dL)
Low-density lipoprotein (LDL)/HDL-C = LDL cholesterol mg/dL)/HDL-C (mg/dL)
Visceral adiposity indexwomen = waist circumference (WC)/(36.58 + (1.89 × body mass index (BMI)) × (triglyceride/0.81) × (1.52/HDL-C)
Visceral adiposity indexmen = WC/(39.68 + (1.88 × BMI)) × (triglycerides/1.03) × (1.31/HDL-C)
Lipid accumulation productwomen = (WC - 58) × triglycerides
Lipid accumulation productmen = (WC - 65) × triglycerides
Triglyceride-glucose (TyG) = Ln (triglycerides (mg/dL) × fasting glucose (mg/dL)/2)
TyG-WC = Ln (triglycerides (mg/dL) × fasting glucose (mg/dL)/2) × WC
TyG-BMI = Ln (triglycerides (mg/dL) × fasting glucose (mg/dL)/2) × BMI
The covariates considered for statistical adjustment were sex (male, female), age group (categorized in 18 - 29, 30 - 39 years, 40 - 49 years, and 50 - 59 years), educational level (up to primary, secondary, high), marital status (single, with a partner), natural region (Metropolitan Lima, rest of the coast, mountains, and jungle), area of residence (urban, rural), alcohol consumption in the last 30 days (yes, no), current smoking status (yes, no), socioeconomic status (poor, not poor) and physical activity (low, medium, high).
Data collection and procedure
A digital sphygmomanometer was used to measure blood pressure. First, to take the measure, the patient’s dominant arm was chosen. Subsequently, two measurements of blood pressure were taken, and the average was calculated to determine a preliminary diagnosis. If a difference of 20 mm Hg between the first and second measurement of the SBP or 10 mm Hg between the first and second of the DBP was detected, a third was decided. The measurements that did not show such differences were recorded. Blood pressure was taken mostly in the morning, between 6:00 am and 9:00 am.; if not possible, it was done between 7:00 pam and 9:00 pm.
The patient needed to be fasting for a period between 9 and 12 h. For the laboratory analyses, the serum was extracted and transported in a cold chain to establish the lipid profile. Triglyceride levels were measured through an enzymatic-colorimetric method of automatic coupled endpoint reactions, while to establish blood glucose levels, portable glucometers (HemoCue Glucose 201 RT) were used, which had been correctly calibrated. HDL-C and LDL were determined by the automated direct enzymatic-colorimetric method.
The BMI was obtained by dividing the weight in kg by the square of the height in m. The abdominal perimeter was measured at the end of exhalation with a tape measure, while the patient stood with bare torso and feet separated between 25 and 30 cm, at the height of the upper edge of the iliac crest. This was applied three continuous times, and the average of the measurements was considered as the result.
Statistical analysis
Statistical analyses were executed using R software version 4.0.5. First, a descriptive analysis was developed, summarizing categorical variables in absolute terms and percentages, and numerical ones, using mean and standard deviation (SD). To identify differences between groups, according to BMI, in the bivariate analysis, the Rao-Scott Chi-square test was used for categorical variables and the F test for numerical ones, which showed a normal distribution evaluated by skewness, kurtosis, and histogram analysis.
The receiver operating characteristic (ROC) curves analysis was used as a statistical and graphic method, as well as the area under the curve (AUC) that corresponds to each response variable, to measure the diagnostic ability. Sensitivity (Se), specificity (Sp), positive predictive value (PPV), negative predictive value (NPV), positive likelihood ratio (PLR), and negative likelihood ratio (NLR) were calculated. The Youden index was used to establish the optimal cut-off point. Each value was presented with its respective 95% confidence interval (95% CI). Analyses were made according to sample weights.
Finally, each index was divided into tertiles, and a bivariate and multivariable Poisson regression analysis with robust variance was performed for each response variable. These are included in the multivariable model: age, sex, cigarette smoking, alcohol consumption, and physical activity. The measure of association was the crude prevalence ratio (cPR) and adjusted prevalence ratio (aPR) with a 95% confidence interval (95% CI). A statistically significant value of P < 0.05 was considered.
Ethical aspects
The research adhered to the ethical guidelines set forth by the overseeing institution concerning human participants and was in alignment with the Helsinki Declaration. The survey is available free of charge [17]. To ensure respondent confidentiality, the database was encrypted, preventing the disclosure of participants’ full names. Given these precautions, an ethical review was deemed unnecessary.
| Results | ▴Top |
The prevalence of prehypertension and undiagnosed HTN was 6.88% and 2.72%, respectively. Females constituted 55.31% of the sample. Only 32.35% resided in rural areas. Regarding harmful habits, 49.88% had consumed alcohol in the past 30 days, while only 13.46% smoked daily. The rest of the univariate and bivariate analyses can be seen in Table 1.
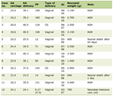 Click to view | Table 1. Descriptive and Bivariate Characteristics According to the Presence of Prehypertension/Hypertension |
There was a statistically significant association between TyG-WC and prehypertension in the third tertile (adjusted odds ratio (aOR) = 7.60; 95% CI: 2.44 - 33.7) in the multivariable analysis. The same is true for TyG-WC and HTN (aOR = 9.62; 95% CI: 1.66 - 186). The other analyses can be seen in Table 2.
Click to view | Table 2. Multivariable Regression Analysis of Eight Biochemical Indicators Divided Into Tertiles for Prehypertension/Hypertension |
The TyG-WC has been the best indicator for both prehypertension: AUC = 0.712 (95% CI: 0.650 - 0.775), cutoff = 762.56, Se = 90.74 (95% CI: 79.70 - 96.92), and Sp = 45.24 (95% CI: 41.61 - 48.92) regarding the diagnostic capacity. The same happens with HTN: AUC = 0.801 (95% CI: 0.718 - 0.883), cutoff = 862.57, Se = 81.81 (95% CI: 59.72 - 94.81), and Sp = 70.18 (95% CI: 66.84 - 73.35). The rest of the data can be seen in Table 3 and Figure 1.
Click to view | Table 3. Diagnostic Capacity of Each Biochemical Indicator for Prehypertension/Hypertension |
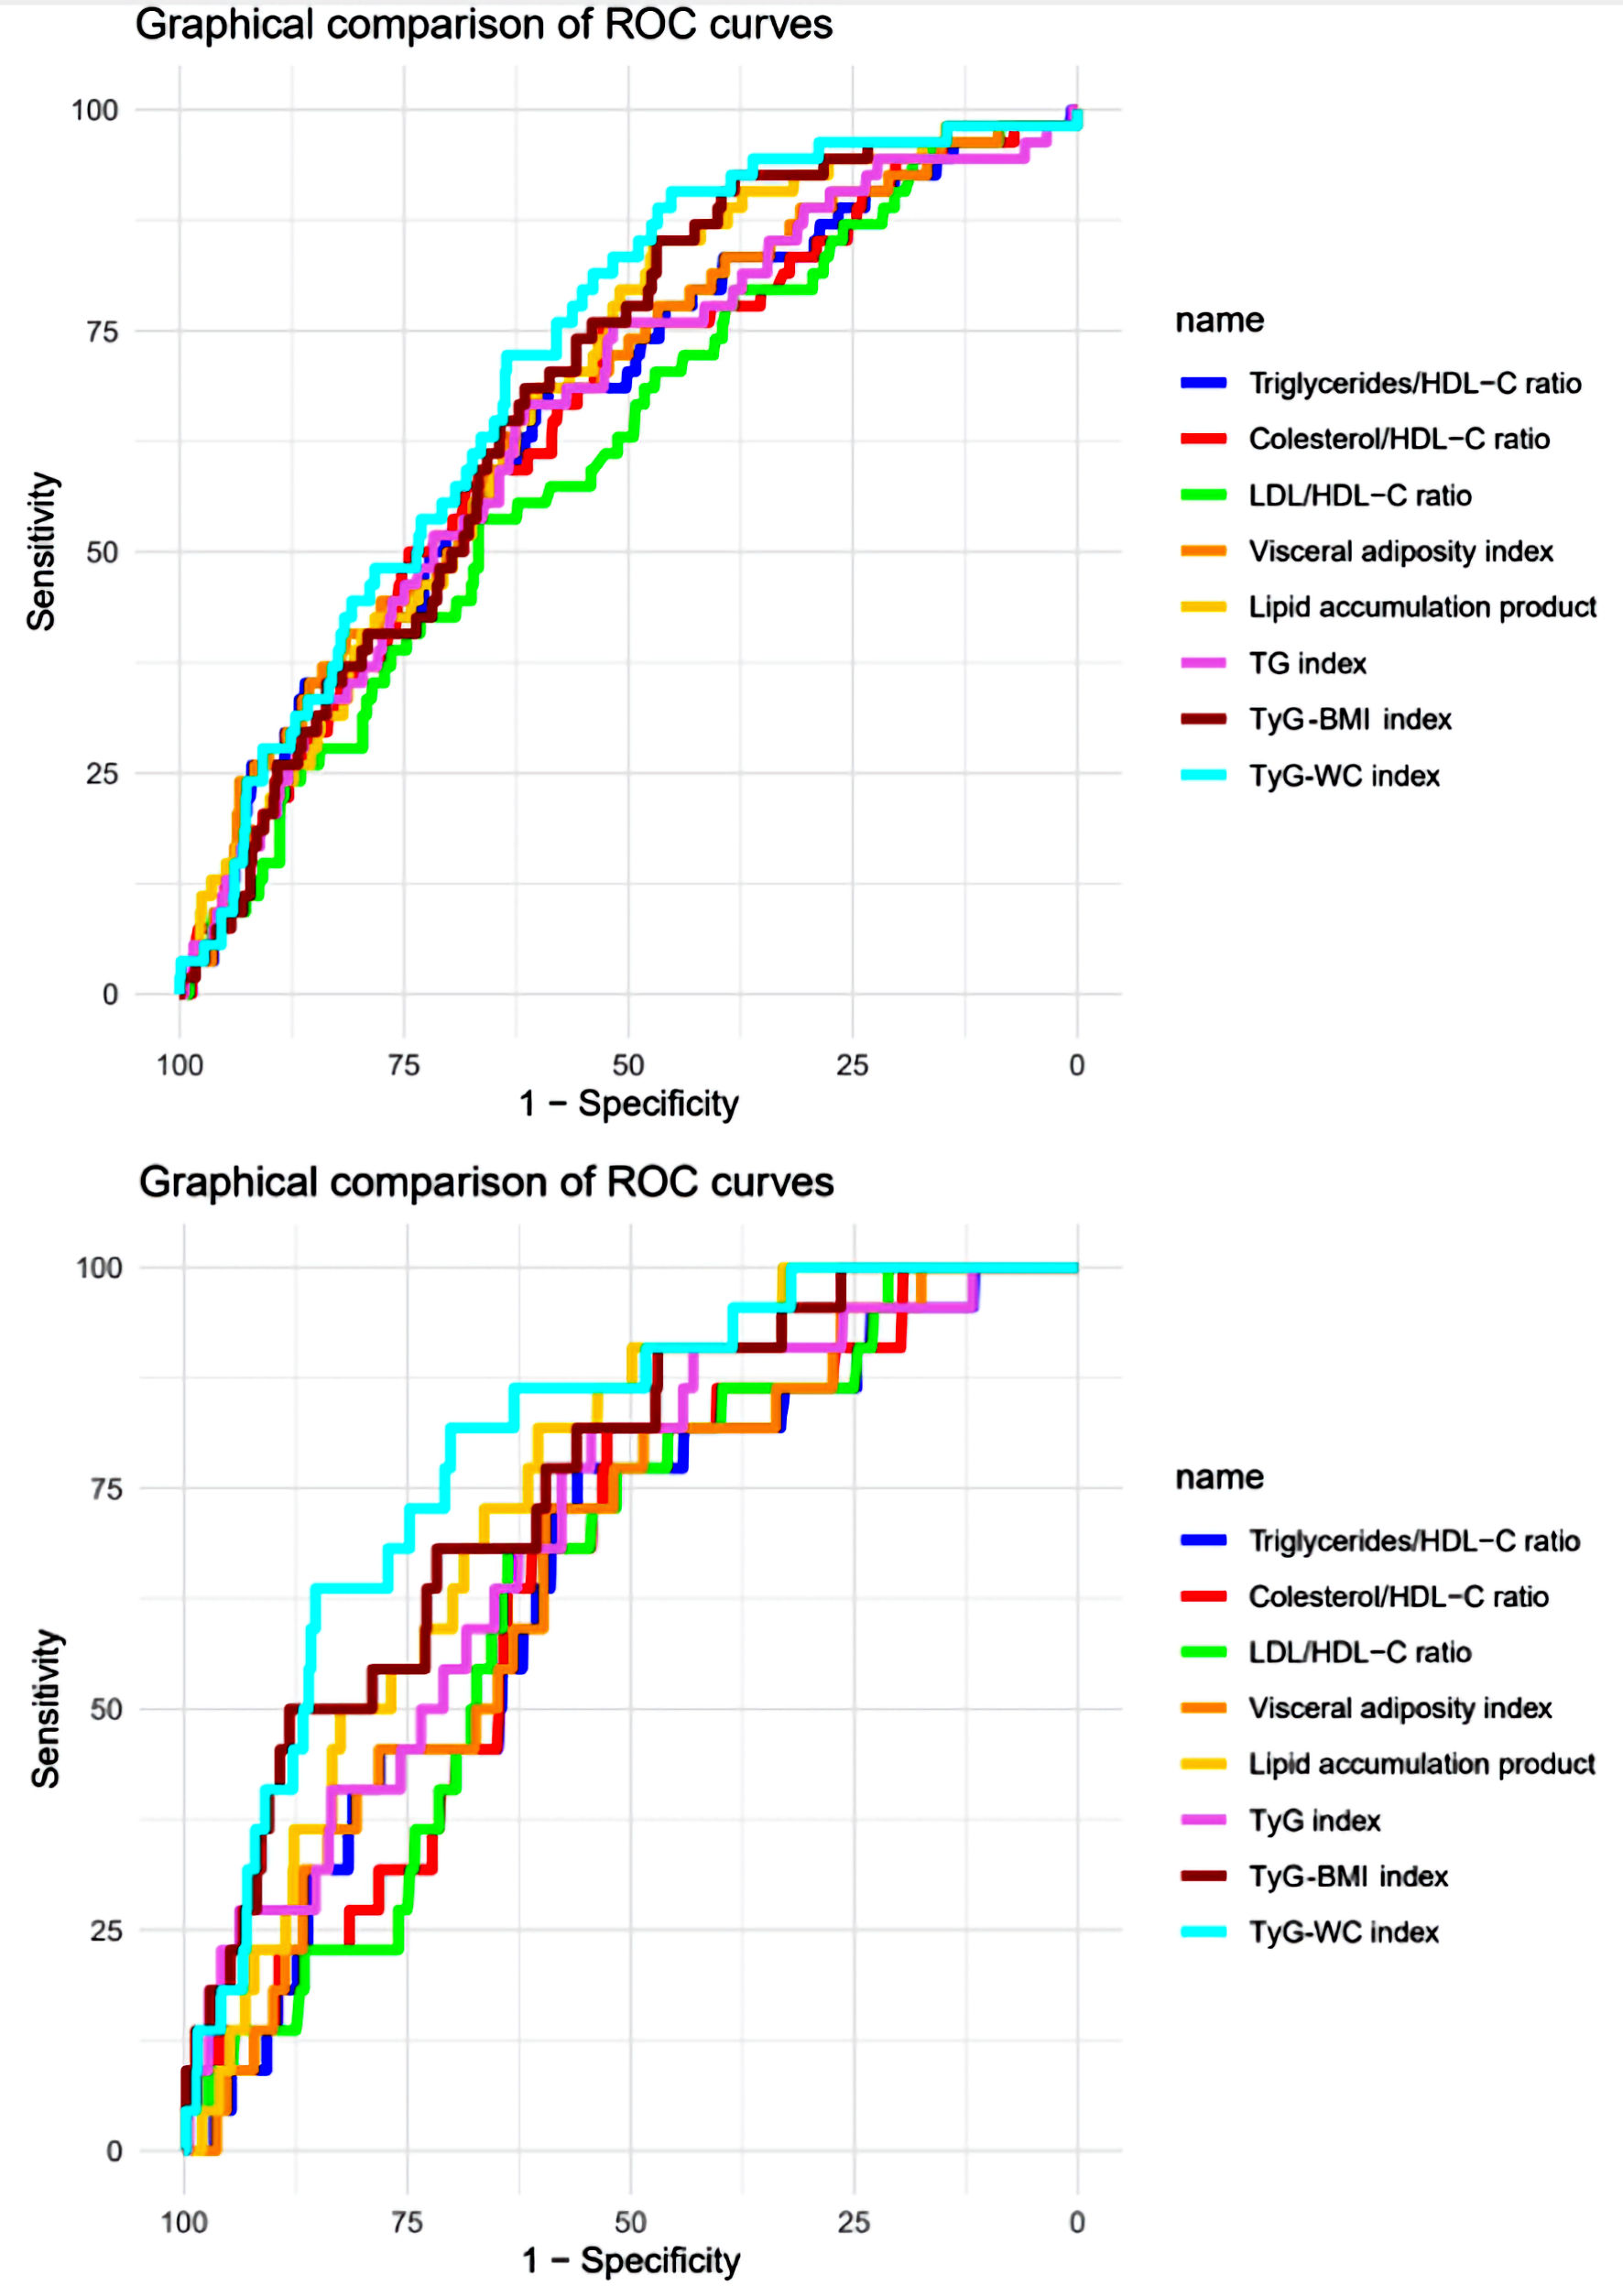 Click for large image | Figure 1. The eight anthropometric indicators are represented by receiver-operating characteristic (ROC) curves. Sensitivity refers to the accurate identification of true positives, while 1-specificity denotes the occurrence of false positives. (a) The panel illustrates the curves for prehypertension. (b) The panel displays the curves for hypertension. HDL-C: high-density lipoprotein cholesterol; LDL: low-density lipoprotein; WC: waist circumference; BMI: body mass index; TyG: triglyceride-glucose. |
| Discussion | ▴Top |
Main findings
In this study, aimed at determining the best biochemical and/or anthropometric indicator as a diagnostic marker of HTN, we found that the TyG-WC index was the best indicator analyzed, especially for prehypertension and HTN. It is noteworthy that this is the first study in Peru that evaluates this subject.
Comparison with other studies
The TyG index has been confirmed to date as closely related to the traditional risk factors of cardiovascular diseases (CVDs) [21-23], including HTN [10, 24]. On the other hand, WC has also been recognized as an excellent indicator of high blood pressure [25, 26]. Therefore, their combination may be a precise indicator of this disease.
It has been demonstrated that TyG-WC is very useful in other pathologies, such as insulin resistance [27, 28], fatty liver, and type 2 diabetes mellitus [29, 30]. However, while many studies have determined the relationship between TyG [13] and prehypertension/HTN, few have established the relationship between TyG-WC, and those that have done so have had controversial results. For instance, in the study by Bala et al [14], it was found that this indicator is not superior to others. Meanwhile, Yuan et al [15] found that TyG-WC had the best diagnostic capacity. Although Zeng et al [16] concluded that TyG-BMI was the best through AUC, it should be noted that the difference with TyG-WC was nearly a tenth.
Regarding studies that determined prehypertension, none were found to do so directly with TyG-WC. Research such as that by Zeng et al [16] showed a positive correlation between TyG-BMI and prehypertension; Zhang et al [31] found that TyG was superior to other markers such as triglycerides/HDL-C. However, there are still controversies, as Zhang et al [32] or Fan et al [33] found that metabolic score for insulin resistance (METS-IR) index was a better indicator than the others. These controversies create the need for further research on these pathologies.
Interpretation of results
The pathophysiology of HTN is complex and involves various mechanisms and systems that interact with each other. A significant factor in HTN is insulin resistance, a state in which the body’s cells are less sensitive to its action, resulting in increased blood glucose levels. Insulin resistance can also cause an increase in the production of triglycerides and free fatty acids, which could directly affect the function and structure of blood vessels, as well as increase sodium and water retention in the kidneys; this leads to an increase in blood volume and blood pressure [34, 35].
Another crucial factor in HTN is endothelial dysfunction, which refers to an alteration in the function of the endothelium, the layer of cells lining the inside of blood vessels. The endothelium plays a significant role in vascular tone regulation and homeostasis and releases vasoactive substances like nitric oxide (NO), leading to the relaxation of blood vessels and a decrease in blood pressure. Endothelial dysfunction could result from risk factors like obesity, insulin resistance, and metabolic syndrome, and it could contribute to the development of HTN by causing a decrease in NO production and an increase in the production of vasoconstrictor substances [36, 37].
Activation of the renin-angiotensin-aldosterone system (RAAS) also plays a crucial role in the pathophysiology of HTN. The RAAS is a hormonal system that helps regulate blood pressure and the balance of fluids and electrolytes in the body. Excessive or inappropriate activation of the RAAS may result in the constriction of blood vessels, retention of sodium and water in the kidneys, and stimulation of the sympathetic nervous system; this leads to an increase in blood pressure. Risk factors like insulin resistance and obesity could disrupt the balance and function of the RAAS, contributing to the development of HTN [38-40].
In addition, WC is a crucial indicator of body fat distribution, specifically visceral fat, which has been associated with a higher risk of HTN. The accumulation of visceral fat in the abdominal area could increase the release of free fatty acids and proinflammatory cytokines, contributing to endothelial dysfunction, insulin resistance, and activation of the RAAS [41]. Epidemiological studies have observed that WC is a better indicator of HTN and CVDs compared to the BMI [42, 43].
Strengths and limitations of the study
The main strength of this manuscript was that it used a nationally representative sample, which lends confidence to the results. Despite this, there were several limitations: the study design is cross-sectional, so causality cannot be determined, and it cannot be extrapolated to other age groups such as children and/or the elderly, as the participants are adults aged between 18 to 59 years.
Conclusions
The TyG-WC is the best diagnostic tool for prehypertension and HTN, hence, it is necessary to conduct prospective research to verify these findings. If confirmed, the TyG-WC can be used as a marker for the prognosis of these two conditions and, thus, to make decisions about prevention.
Acknowledgments
The authors of this study wish to extend their gratitude to the Institute of Biomedical Science Research at Ricardo Palma University for the support provided in the development of this work.
Financial Disclosure
The study is self-financed.
Conflict of Interest
The authors declare no conflict of interest.
Informed Consent
To ensure respondent confidentiality, the database was encrypted, preventing the disclosure of participants’ full names. Given these precautions and the fact that our study was based on a secondary analysis of open-access data, obtaining informed consent was deemed unnecessary.
Author Contributions
Victor Juan Vera-Ponce: conceptualization, data analysis, writing - review and editing. Andrea P. Ramirez-Ortega: investigation, resource acquisition, methodology, writing - original draft. Joan A. Loayza-Castro: data analysis, methodology, validation, writing - original draft. Fiorella E. Zuzunaga-Montoya: data curation, data analysis, methodology, validation, writing - original draft. Jenny Raquel Torres-Malca: validation, visualization, writing - review and editing. Cori Raquel Iturregui Paucar: supervision, project administration, writing - review and editing. Rosa A. Garcia-Lara: project administration, funding acquisition, writing - review and editing. Jhony A. De La Cruz-Vargas: supervision, writing - review and editing.
Data Availability
The data supporting the findings of this study are open access and can be accessed at “Plataforma Nacional de Datos Abiertos”.
| References | ▴Top |
- Unger T, Borghi C, Charchar F, Khan NA, Poulter NR, Prabhakaran D, Ramirez A, et al. 2020 International Society of Hypertension Global Hypertension Practice Guidelines. Hypertension. 2020;75(6):1334-1357.
doi pubmed - Rivera-Andrade A, Luna MA. Trends and heterogeneity of cardiovascular disease and risk factors across Latin American and Caribbean countries. Prog Cardiovasc Dis. 2014;57(3):276-285.
doi pubmed - Schargrodsky H, Hernandez-Hernandez R, Champagne BM, Silva H, Vinueza R, Silva Aycaguer LC, Touboul PJ, et al. CARMELA: assessment of cardiovascular risk in seven Latin American cities. Am J Med. 2008;121(1):58-65.
doi pubmed - Instituto Nacional de Estadistica e Informatica (INEI). Enfermedades no transmisibles y transmisibles, 2021 [Internet]. Lima, Peru: INEI; 2021 [citado el 14 de enero de 2023]. Disponible en: https://proyectos.inei.gob.pe/endes/2021/SALUD/ENFERMEDADES_ENDES_2021.pdf.
- Banegas JR, Gijon-Conde T. [Epidemiology of hypertension]. Hipertens Riesgo Vasc. 2017;34(Suppl 2):2-4.
doi pubmed - Julius S, Nesbitt SD, Egan BM, Weber MA, Michelson EL, Kaciroti N, Black HR, et al. Feasibility of treating prehypertension with an angiotensin-receptor blocker. N Engl J Med. 2006;354(16):1685-1697.
doi pubmed - Booth JN, 3rd, Li J, Zhang L, Chen L, Muntner P, Egan B. Trends in prehypertension and hypertension risk factors in US adults: 1999-2012. Hypertension. 2017;70(2):275-284.
doi pubmed pmc - Dereje R, Hassen K, Gizaw G. Evaluation of anthropometric indices for screening hypertension among employees of Mizan Tepi University, Southwestern Ethiopia. Integr Blood Press Control. 2021;14:99-111.
doi pubmed pmc - de Oliveira CM, Ulbrich AZ, Neves FS, Dias FAL, Horimoto A, Krieger JE, Alvim RO, et al. Association between anthropometric indicators of adiposity and hypertension in a Brazilian population: Baependi Heart Study. PLoS One. 2017;12(10):e0185225.
doi pubmed pmc - Zhang J, Wang R, Liu Q, Song G, Tang X. Association of triglyceride-glucose index with incident hypertension among non-overweight healthy adults: A cohort study in China. Nutr Metab Cardiovasc Dis. 2023;33(5):1057-1065.
doi pubmed - Song J, Zhao Y, Nie S, Chen X, Wu X, Mi J. The effect of lipid accumulation product and its interaction with other factors on hypertension risk in Chinese Han population: A cross-sectional study. PLoS One. 2018;13(6):e0198105.
doi pubmed pmc - Gao Q, Lin Y, Xu R, Luo F, Chen R, Li P, Zhang Y, et al. Positive association of triglyceride-glucose index with new-onset hypertension among adults: a national cohort study in China. Cardiovasc Diabetol. 2023;22(1):58.
doi pubmed pmc - Deng D, Chen C, Wang J, Luo S, Feng Y. Association between triglyceride glucose-body mass index and hypertension in Chinese adults: A cross-sectional study. J Clin Hypertens (Greenwich). 2023;25(4):370-379.
doi pubmed pmc - Bala C, Gheorghe-Fronea O, Pop D, Pop C, Caloian B, Comsa H, Bozan C, et al. The association between six surrogate insulin resistance indexes and hypertension: a population-based study. Metab Syndr Relat Disord. 2019;17(6):328-333.
doi pubmed - Yuan Y, Sun W, Kong X. Comparison between distinct insulin resistance indices in measuring the development of hypertension: The China Health and Nutrition Survey. Front Cardiovasc Med. 2022;9:912197.
doi pubmed pmc - Zeng ZY, Liu SX, Xu H, Xu X, Liu XZ, Zhao XX. Association of triglyceride glucose index and its combination of obesity indices with prehypertension in lean individuals: A cross-sectional study of Chinese adults. J Clin Hypertens (Greenwich). 2020;22(6):1025-1032.
doi pubmed pmc - Centro Nacional de Alimentacion y Nutricion. Estado Nutricional En Adultos de 18 a 59 Anos VIANEV 2017-2018. Instituto Nacional de Salud: Lima, Peru. 2021;191.
- von Elm EG. Altman D, Egger MJ, Pocock SC. Gotzsche PP, Vandenbroucke J. Declaracion de la Iniciativa STROBE (Strengthening the Reporting of Observational studies in Epidemiology): directrices para la comunicacion de estudios observacionales. 2008;22(2):144-150.
- Cohen JF, Korevaar DA, Altman DG, Bruns DE, Gatsonis CA, Hooft L, Irwig L, et al. STARD 2015 guidelines for reporting diagnostic accuracy studies: explanation and elaboration. BMJ Open. 2016;6(11):e012799.
doi pubmed pmc - World Health Organization. Hypertension [Internet]. Geneva: World Health Organization; [citado el 14 de enero de 2023]. Available from: https://www.who.int/news-room/fact-sheets/detail/hypertension.
- Park B, Lee YJ, Lee HS, Jung DH. The triglyceride-glucose index predicts ischemic heart disease risk in Koreans: a prospective study using National Health Insurance Service data. Cardiovasc Diabetol. 2020;19(1):210.
doi pubmed pmc - Won KB, Park EJ, Han D, Lee JH, Choi SY, Chun EJ, Park SH, et al. Triglyceride glucose index is an independent predictor for the progression of coronary artery calcification in the absence of heavy coronary artery calcification at baseline. Cardiovasc Diabetol. 2020;19(1):34.
doi pubmed pmc - Ding X, Wang X, Wu J, Zhang M, Cui M. Triglyceride-glucose index and the incidence of atherosclerotic cardiovascular diseases: a meta-analysis of cohort studies. Cardiovasc Diabetol. 2021;20(1):76.
doi pubmed pmc - Cheng W, Kong F, Chen S. Comparison of the predictive value of four insulin resistance surrogates for the prevalence of hypertension: a population-based study. Diabetol Metab Syndr. 2022;14(1):137.
doi pubmed pmc - Sun JY, Ma YX, Liu HL, Qu Q, Cheng C, Kong XQ, Huang WJ, et al. High waist circumference is a risk factor of new-onset hypertension: Evidence from the China Health and Retirement Longitudinal Study. J Clin Hypertens (Greenwich). 2022;24(3):320-328.
doi pubmed pmc - Sun JY, Hua Y, Zou HY, Qu Q, Yuan Y, Sun GZ, Sun W, et al. Association between waist circumference and the prevalence of (pre) hypertension among 27,894 US adults. Front Cardiovasc Med. 2021;8:717257.
doi pubmed pmc - Du T, Yuan G, Zhang M, Zhou X, Sun X, Yu X. Clinical usefulness of lipid ratios, visceral adiposity indicators, and the triglycerides and glucose index as risk markers of insulin resistance. Cardiovasc Diabetol. 2014;13:146.
doi pubmed pmc - Minh HV, Tien HA, Sinh CT, Thang DC, Chen CH, Tay JC, Siddique S, et al. Assessment of preferred methods to measure insulin resistance in Asian patients with hypertension. J Clin Hypertens (Greenwich). 2021;23(3):529-537.
doi pubmed pmc - Kuang M, Yang R, Huang X, Wang C, Sheng G, Xie G, Zou Y. Assessing temporal differences in the predictive power of baseline TyG-related parameters for future diabetes: an analysis using time-dependent receiver operating characteristics. J Transl Med. 2023;21(1):299.
doi pubmed pmc - Song S, Son DH, Baik SJ, Cho WJ, Lee YJ. Triglyceride glucose-waist circumference (TyG-WC) is a reliable marker to predict non-alcoholic fatty liver disease. Biomedicines. 2022;10(9):2251.
doi pubmed pmc - Zhang F, Zhang Y, Guo Z, Yang H, Ren M, Xing X, Cong H. The association of triglyceride and glucose index, and triglyceride to high-density lipoprotein cholesterol ratio with prehypertension and hypertension in normoglycemic subjects: A large cross-sectional population study. J Clin Hypertens (Greenwich). 2021;23(7):1405-1412.
doi pubmed pmc - Zhang X, Yu C, Ye R, Liu T, Chen X. Correlation between non-insulin-based insulin resistance indexes and the risk of prehypertension: A cross-sectional study. J Clin Hypertens (Greenwich). 2022;24(5):573-581.
doi pubmed pmc - Fan J, Gao ST, Wang LJ, Qian ZL, Zhou ZQ, Liu XZ. Association of three simple insulin resistance indexes with prehypertension in normoglycemic subjects. Metab Syndr Relat Disord. 2019;17(7):374-379.
doi pubmed - Seravalle G, Grassi G. Obesity and hypertension. Pharmacol Res. 2017;122:1-7.
doi pubmed - Bornfeldt KE, Tabas I. Insulin resistance, hyperglycemia, and atherosclerosis. Cell Metab. 2011;14(5):575-585.
doi pubmed pmc - Montezano AC, Touyz RM. Molecular mechanisms of hypertension—reactive oxygen species and antioxidants: a basic science update for the clinician. Can J Cardiol. 2012;28(3):288-295.
doi pubmed - Montezano AC, Touyz RM. Oxidative stress, Noxs, and hypertension: experimental evidence and clinical controversies. Ann Med. 2012;44(Suppl 1):S2-16.
doi pubmed - Maiuolo J, Gliozzi M, Musolino V, Carresi C, Nucera S, Macri R, Scicchitano M, et al. The role of endothelial dysfunction in peripheral blood nerve barrier: molecular mechanisms and pathophysiological implications. Int J Mol Sci. 2019;20(12):3022.
doi pubmed pmc - Oger E, Kerbrat S, Nowak E, Paillard F, Scarabin PY, Happe A. Effectiveness of angiotensin-converting enzyme inhibitors and angiotensin receptor blockers on total and cardiovascular mortality and morbidity in primary prevention: A nationwide study based on French Health Insurance Data (SNDS). J Clin Hypertens (Greenwich). 2022;24(4):438-448.
doi pubmed pmc - Li EC, Heran BS, Wright JM. Angiotensin converting enzyme (ACE) inhibitors versus angiotensin receptor blockers for primary hypertension. Cochrane Database Syst Rev. 2014;2014(8):CD009096.
doi pubmed pmc - Pausova Z. From big fat cells to high blood pressure: a pathway to obesity-associated hypertension. Curr Opin Nephrol Hypertens. 2006;15(2):173-178.
doi pubmed - Coutinho T, Goel K, Correa de Sa D, Kragelund C, Kanaya AM, Zeller M, Park JS, et al. Central obesity and survival in subjects with coronary artery disease: a systematic review of the literature and collaborative analysis with individual subject data. J Am Coll Cardiol. 2011;57(19):1877-1886.
doi pubmed - Janssen I, Katzmarzyk PT, Ross R. Waist circumference and not body mass index explains obesity-related health risk. Am J Clin Nutr. 2004;79(3):379-384.
doi pubmed
This article is distributed under the terms of the Creative Commons Attribution Non-Commercial 4.0 International License, which permits unrestricted non-commercial use, distribution, and reproduction in any medium, provided the original work is properly cited.
Journal of Endocrinology and Metabolism is published by Elmer Press Inc.