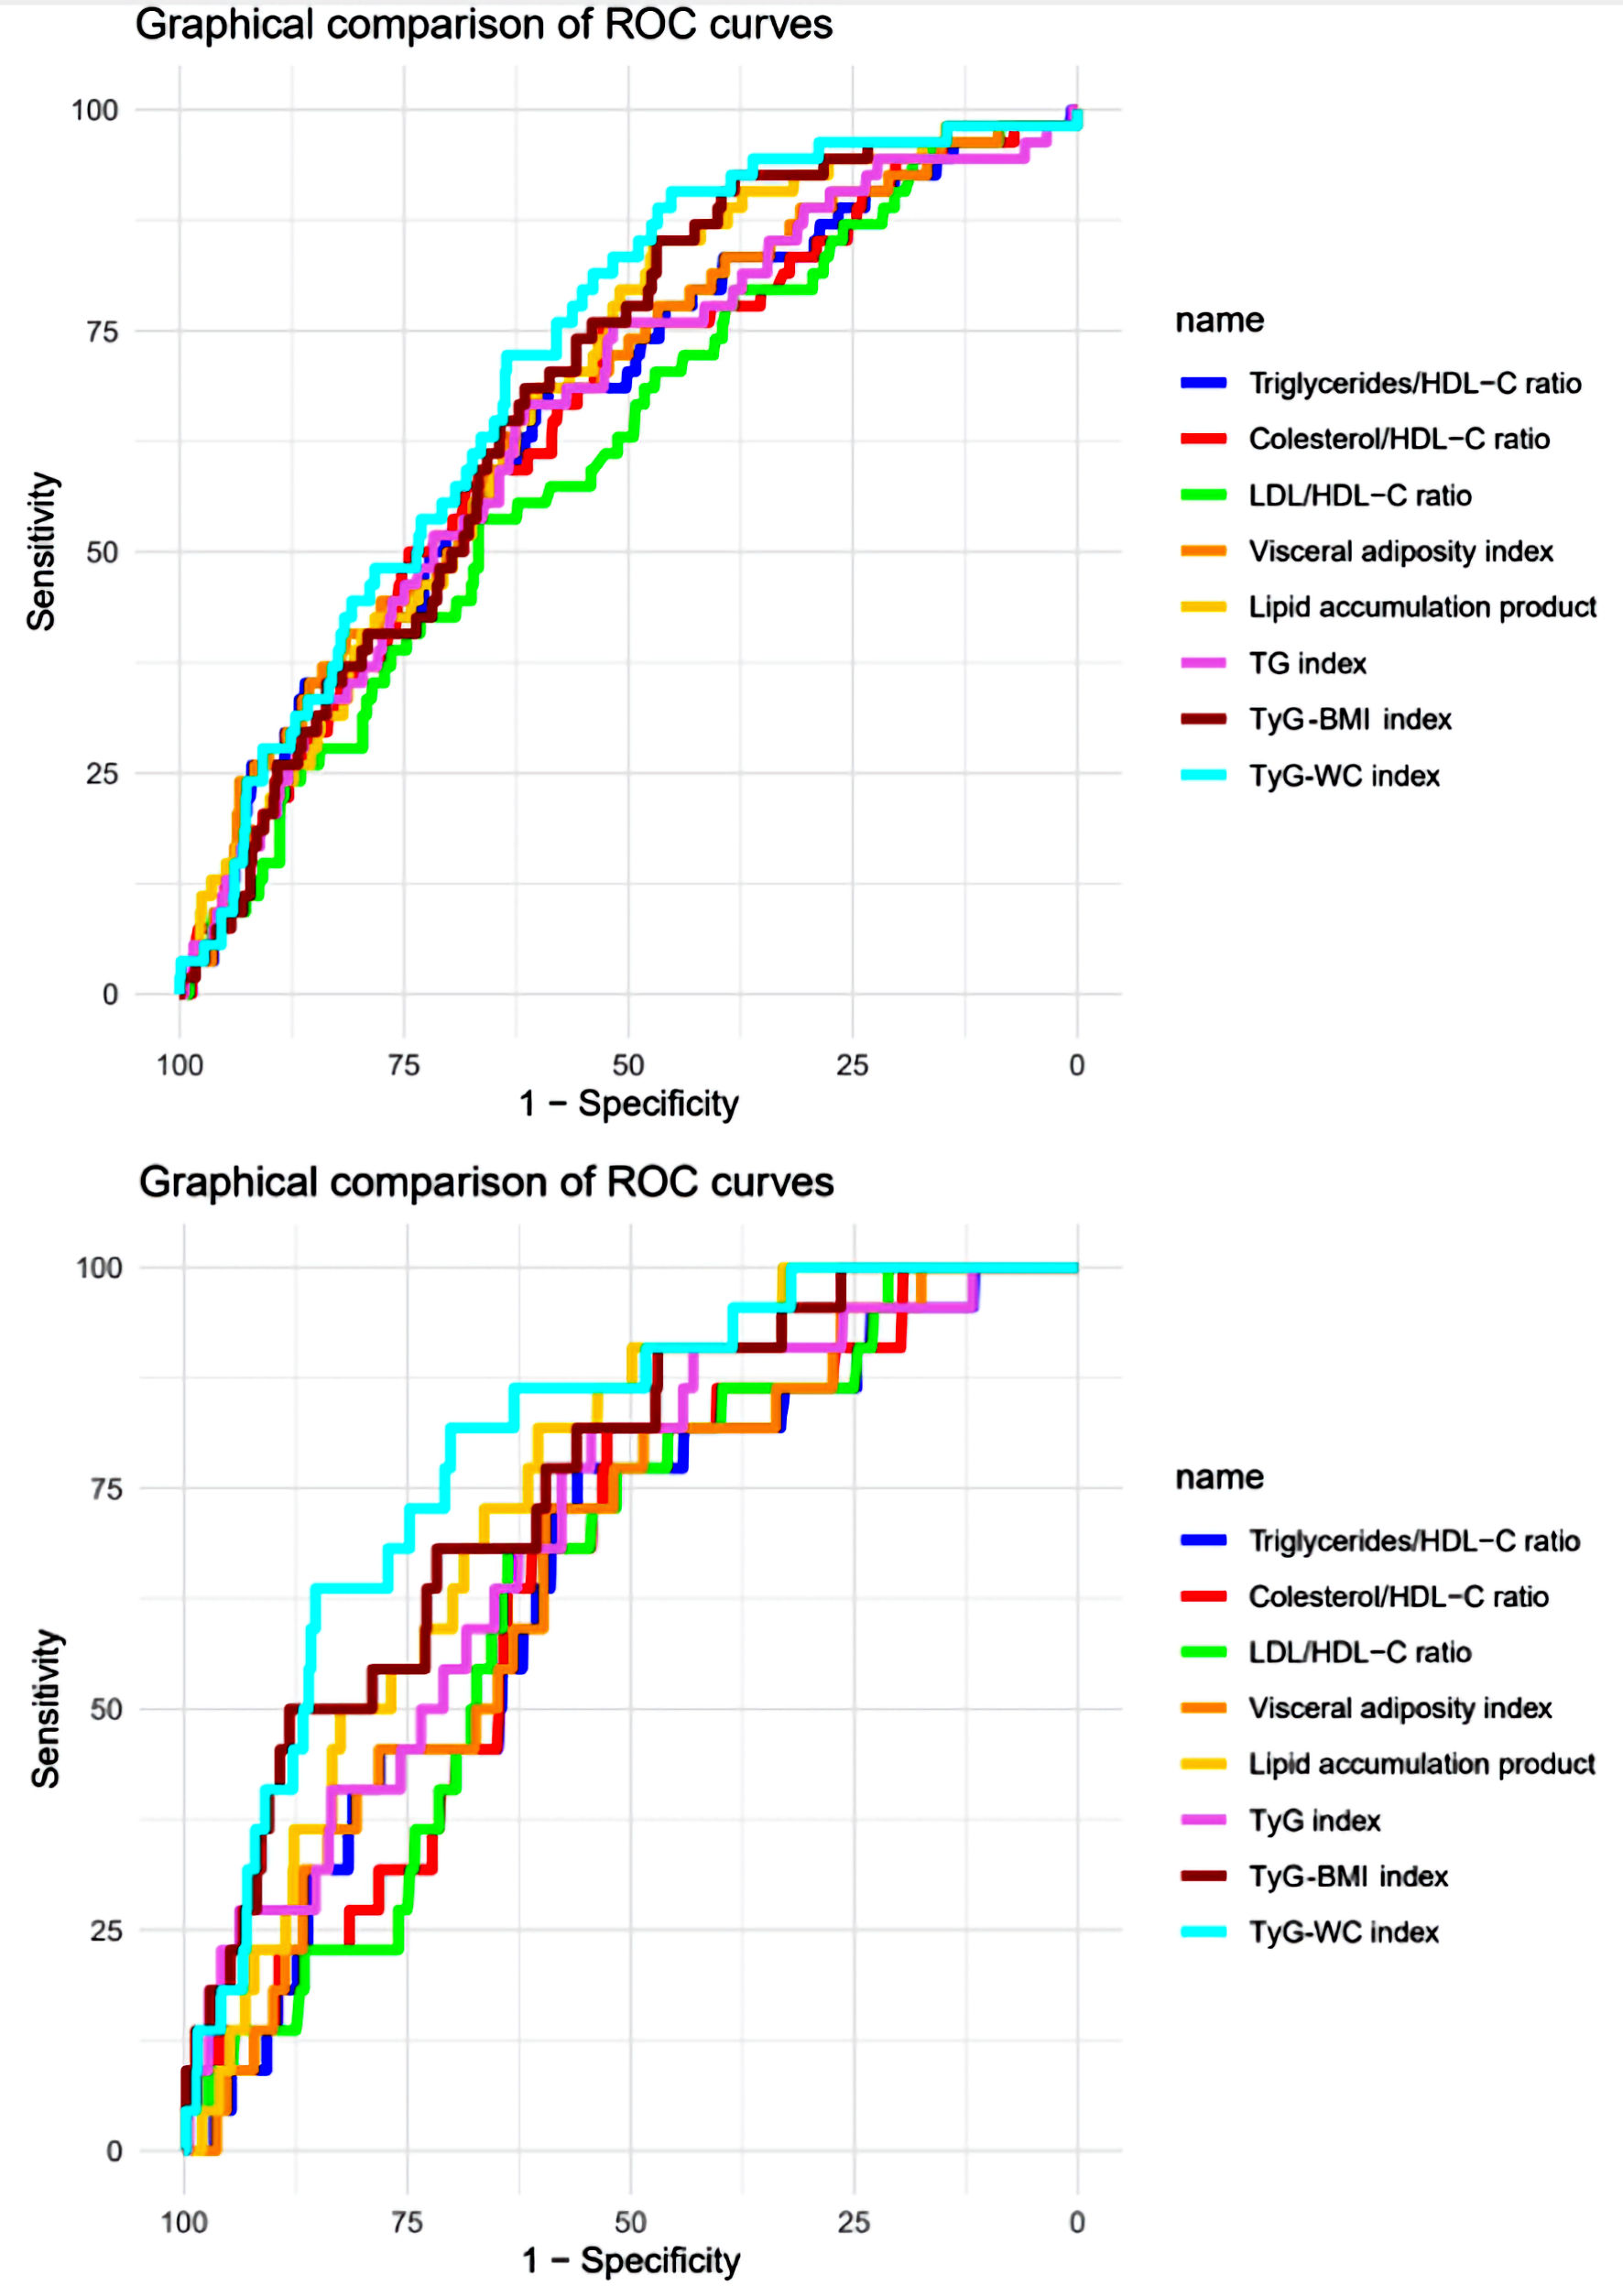
Journal of Endocrinology and Metabolism, ISSN 1923-2861 print, 1923-287X online, Open Access |
Article copyright, the authors; Journal compilation copyright, J Endocrinol Metab and Elmer Press Inc |
Journal website https://www.jofem.org |
Original Article
Volume 13, Number 4, November 2023, pages 135-143
Triglyceride Glucose-Waist Circumference Is Superior to Other Biochemical Indicators for Diagnosing Prehypertension and Hypertension
Figure
Tables
Characteristic | Undiagnosed prehypertension | Undiagnosed hypertension | |||||
---|---|---|---|---|---|---|---|
No, n = 736 | Yes, n = 54 | P valuea | No, n = 788 | Yes, n = 22 | P valuea | ||
Data were shown as n (%), and mean (SD). aRao-Scott Chi-square and the F test. *P < 0.05. HDL-C: high-density lipoprotein cholesterol; LDL: low-density lipoprotein; TyG: triglyceride-glucose; TyG-WC: TyG-waist circumference; TyG-BMI: TyG-body mass index; SD: standard deviation. | |||||||
Sex | |||||||
Female | 448 (55.31%) | ||||||
Male | 362 (44.69%) | ||||||
Age group | < 0.001* | 0.014* | |||||
18 to 29 years old | 237 (29.26%) | 230 (97.87%) | 5 (2.13%) | 235 (99.16%) | 2 (0.84%) | ||
30 to 39 years old | 214 (26.42%) | 202 (95.73%) | 9 (4.27%) | 210 (98.13%) | 4 (1.87%) | ||
40 to 49 years old | 198 (24.44%) | 174 (90.62%) | 18 (9.38%) | 192 (96.97%) | 6 (3.03%) | ||
50 to 59 years old | 161 (19.88%) | 130 (85.53%) | 22 (14.47%) | 151 (93.79%) | 10 (6.21%) | ||
Civil status | 0.255 | 0.354 | |||||
Single | 297 (36.67%) | 275 (94.50%) | 16 (5.50%) | 291 (97.98%) | 6 (2.02%) | ||
With couple | 513 (63.33%) | 461 (92.38%) | 38 (7.62%) | 497 (96.88%) | 16 (3.12%) | ||
Educational level | 0.433 | 0.294 | |||||
Higher | 318 (39.41%) | 291 (92.97%) | 22 (7.03%) | 313 (98.43%) | 5 (1.57%) | ||
Secondary | 314 (38.91%) | 282 (92.16%) | 24 (7.84%) | 304 (96.82%) | 10 (3.18%) | ||
Until primary | 175 (21.69%) | 161 (95.27%) | 8 (4.73%) | 169 (96.57%) | 6 (3.43%) | ||
Natural region | 0.967 | 0.129 | |||||
Jungle | 118 (14.57%) | 105 (93.75%) | 7 (6.25%) | 111 (94.07%) | 7 (5.93%) | ||
Metropolitan Lima | 383 (47.28%) | 350 (93.33%) | 25 (6.67%) | 375 (97.91%) | 8 (2.09%) | ||
Mountain range | 143 (17.65%) | 131 (92.25%) | 11 (7.75%) | 141 (98.60%) | 2 (1.40%) | ||
Rest of coast | 166 (20.49%) | 150 (93.17%) | 11 (6.83%) | 161 (96.99%) | 5 (3.01%) | ||
Area of residence | 0.848 | 0.328 | |||||
Rural | 262 (32.35%) | 241 (93.41%) | 17 (6.59%) | 257 (98.09%) | 5 (1.91%) | ||
Urban | 548 (67.65%) | 495 (93.05%) | 37 (6.95%) | 531 (96.90%) | 17 (3.10%) | ||
Wealth index | 0.126 | 0.402 | |||||
No poor | 659 (81.36%) | 592 (92.50%) | 48 (7.50%) | 639 (96.97%) | 20 (3.03%) | ||
Poor | 151 (18.64%) | 144 (96.00%) | 6 (4.00%) | 149 (98.68%) | 2 (1.32%) | ||
Alcohol consumption | 0.560 | 0.657 | |||||
No | 406 (50.12%) | 371 (93.69%) | 25 (6.31%) | 396 (97.54%) | 10 (2.46%) | ||
Yes | 404 (49.88%) | 365 (92.64%) | 29 (7.36%) | 3920 (97.03%) | 12 (2.97%) | ||
Daily smoking | 0.755 | 0.945 | |||||
No | 701 (86.54%) | 638 (93.27%) | 46 (6.73%) | 682 (97.29%) | 19 (2.71%) | ||
Yes | 109 (13.46%) | 98 (92.45%) | 8 (7.55%) | 106 (97.25%) | 3 (2.75%) | ||
Physical activity | 0.787 | 0.978 | |||||
High | 114 (14.07%) | 104 (93.69%) | 7 (6.31%) | 111 (97.37%) | 3 (2.63%) | ||
Low | 537 (66.30%) | 485 (92.73%) | 38 (7.27%) | 522 (97.21%) | 15 (2.79%) | ||
Moderate | 159 (19.63%) | 147 (94.23%) | 9 (5.77%) | 155 (97.48%) | 4 (2.52%) | ||
Triglycerides/HDL-C ratio | 5.0 (4.9) | 4.9 (4.8) | 7.1 (5.6) | 0.006* | 5.0 (4.9) | 6.4 (4.1) | 0.131 |
Cholesterol/HDL-C ratio | 5.19 (2.03) | 5.10 (1.98) | 6.06 (2.14) | 0.002* | 5.16 (2.01) | 6.22 (2.40) | 0.054 |
LDL/HDL-C ratio | 3.22 (1.44) | 3.17 (1.41) | 3.65 (1.44) | 0.021* | 3.20 (1.42) | 3.93 (1.82) | 0.076 |
Visceral adiposity index | 2.84 (2.82) | 2.72 (2.76) | 4.13 (3.34) | 0.004* | 2.82 (2.83) | 3.72 (2.42) | 0.100 |
Lipid accumulation product | 54 (46) | 51 (45) | 79 (57) | 0.001* | 53 (46) | 86 (44) | 0.002* |
TyG index | 8.84 (0.60) | 8.80 (0.59) | 9.10 (0.60) | < 0.001* | 8.82 (0.60) | 9.28 (0.62) | 0.003* |
TyG-BMI index | 239 (51) | 236 (50) | 265 (48) | < 0.001* | 238 (50) | 290 (60) | < 0.001* |
TyG-WC index | 801 (136) | 790 (132) | 889 (133) | < 0.001* | 797 (134) | 948 (122) | < 0.001* |
Characteristic | Prehypertension | Hypertension | ||||
---|---|---|---|---|---|---|
aORa | 95% CI | P value | aORa | 95% CI | P value | |
aAdjusted for sex, age group, marital status, educational level, natural region, area of residence, socioeconomic level, alcohol consumption in the last 30 days, current smoker, and physical activity. *P < 0.05. aOR: adjusted odds ratio; CI: confidence interval; Ref: reference; HDL-C: high-density lipoprotein cholesterol; LDL: low-density lipoprotein; TyG: triglyceride-glucose; TyG-WC: TyG-waist circumference; TyG-BMI: TyG-body mass index. | ||||||
Triglycerides/HDL-C ratio | ||||||
Tertile 1 | Ref. | Ref. | ||||
Tertile 2 | 1.4 | 0.59 - 3.47 | 0.452 | 1 | 0.27 - 4.09 | 0.995 |
Tertile 3 | 2.69 | 1.24 - 6.36 | 0.017* | 1.49 | 0.45 - 5.85 | 0.531 |
Cholesterol/HDL-C ratio | ||||||
Tertile 1 | Ref. | Ref. | ||||
Tertile 2 | 1.02 | 0.44 - 2.42 | 0.955 | 2.05 | 0.54 - 9.92 | 0.319 |
Tertile 3 | 2.03 | 0.98 - 4.50 | 0.066 | 2.14 | 0.60 - 10.1 | 0.273 |
LDL/HDL-C ratio | ||||||
Tertile 1 | Ref. | Ref. | ||||
Tertile 2 | 1.47 | 0.67 - 3.36 | 0.344 | 1.81 | 0.46 - 8.92 | 0.419 |
Tertile 3 | 1.65 | 0.77 - 3.70 | 0.208 | 2.41 | 0.69 - 11.3 | 0.202 |
Visceral adiposity index | ||||||
Tertile 1 | Ref. | Ref. | ||||
Tertile 2 | 1.44 | 0.62 - 3.56 | 0.405 | 0.82 | 0.21 - 3.47 | 0.778 |
Tertile 3 | 2.48 | 1.13 - 5.91 | 0.029* | 1.63 | 0.50 - 6.35 | 0.439 |
Lipid accumulation product | ||||||
Tertile 1 | Ref. | Ref. | ||||
Tertile 2 | 3.19 | 1.22 - 9.96 | 0.027* | 1.57 | 0.31 - 11.5 | 0.606 |
Tertile 3 | 3.74 | 1.45 - 11.7 | 0.012* | 3.73 | 0.92 - 25.4 | 0.103 |
TyG index | ||||||
Tertile 1 | Ref. | Ref. | ||||
Tertile 2 | 1.29 | 0.56 - 3.09 | 0.553 | 2.1 | 0.45 - 14.8 | 0.379 |
Tertile 3 | 2.18 | 1.01 - 5.02 | 0.054 | 3.59 | 0.90 - 24.1 | 0.108 |
TyG-BMI index | ||||||
Tertile 1 | Ref. | Ref. | ||||
Tertile 2 | 5.03 | 1.82 - 17.8 | 0.004* | 1.76 | 0.36 - 12.8 | 0.512 |
Tertile 3 | 5.52 | 1.99 - 19.7 | 0.003* | 4.39 | 1.07 - 30.1 | 0.069 |
TyG-WC index | ||||||
Tertile 1 | Ref. | Ref. | ||||
Tertile 2 | 5.42 | 1.74 - 23.9 | 0.009* | 1.66 | 0.19 - 35.2 | 0.670 |
Tertile 3 | 7.60 | 2.44 - 33.7 | 0.002* | 9.62 | 1.66 - 186 | 0.039* |
Cutoffs | AUC | Se (%) | Sp (%) | PPV (%) | NPV (%) | LR+ (%) | LR- (%) | |
---|---|---|---|---|---|---|---|---|
Se: sensibility; Sp: specificity; PPV: positive predictive value; NPV: negative predictive value; LR+: likelihood ratio positive; LR-: likelihood ratio negative; HDL-C: high-density lipoprotein cholesterol; LDL: low-density lipoprotein; TyG: triglyceride-glucose; TyG-WC: TyG-waist circumference; TyG-BMI: TyG-body mass index; AUC: area under the curve. | ||||||||
Prehypertension | ||||||||
Triglycerides/HDL-C ratio | 3.95 | 0.656 (0.581 - 0.732) | 68.52 (54.44 - 80.47) | 58.96 (55.32 - 62.55) | 10.91 (9.55 - 18.83) | 96.23 (93.34 - 96.74) | 1.67 (1.37 - 2.04) | 0.53 (0.36 - 0.79) |
Cholesterol/HDL-C ratio | 4.82 | 0.649 (0.573 - 0.724) | 75.92 (62.36 - 86.51) | 52.71 (49.03 - 56.37) | 10.54 (9.22 - 19.33) | 96.76 (94.00 - 97.19) | 1.61 (1.36 - 1.90) | 0.45 (0.28 - 0.74) |
LDL/HDL-C ratio | 3.46 | 0.610 (0.534 - 0.685) | 53.70 (39.61 - 67.38) | 66.71 (63.18 - 70.11) | 10.58 (9.20 - 17.41) | 95.16 (91.74 - 95.81) | 1.61 (1.23 - 2.11) | 0.69 (0.52 - 0.93) |
Visceral adiposity index | 2.35 | 0.666 (0.592 - 0.740) | 66.67 (52.53 - 78.91) | 62.09 (58.48 - 65.61) | 11.43 (9.99 - 19.44) | 96.21 (93.35 - 96-73) | 1.76 (1.43 - 2.17) | 0.53 (0.37 - 0.79) |
Lipid accumulation product | 34.8 | 0.678 (0.611 - 0.746) | 85.19 (72.88 - 93.38) | 47.28 (43.62 - 50.96) | 10.59 (9.28 - 22.53) | 97.75 (95.31 - 98.05) | 1.61 (1.42 - 1.84) | 0.31 (0.16 - 0.69) |
TyG index | 8.94 | 0.653 (0.579 - 0.728) | 66.67 (52.52 - 78.91) | 61.55 (57.93 - 65.08) | 11.29 (9.86 - 19.22) | 96.18 (93.30 - 96-70) | 1.73 (1.41 - 2.14) | 0.54 (0.37 - 0.79) |
TyG-BMI index | 226.2 | 0.680 (0.615 - 0.745) | 85.18 (72.88 - 93.38) | 46.87 (43.33 - 50.55) | 10.53 (9.21 - 22.39) | 97.77 (95.27 - 98.04) | 1.60 (1.41 - 1.83) | 0.32 (0.17 - 0.60) |
TyG-WC index | 762.56 | 0.712 (0.650 - 0.775) | 90.74 (79.70 - 96.92) | 45.24 (41.61 - 48.92) | 10.84 (9.49 - 28.11) | 98.52 (96.29 - 98.72) | 1.66 (1.49 - 1.84) | 0.20 (0.09 - 0.47) |
Hypertension | ||||||||
Triglycerides/HDL-C ratio | 3.89 | 0.652 (0.545 - 0.758) | 77.27 (54.62 - 92.18) | 55.96 (52.41 - 59.46) | 4.67 (4.07 - 14.51) | 98.87 (96.89 - 99.03) | 1.75 (1.38 - 2.23) | 0.41 (0.18 - 0.88) |
Cholesterol/HDL-C ratio | 4.88 | 0.651 (0.550 - 0.752) | 81.82 (59.72 - 94.81) | 52.66 (49.11 - 56.20) | 4.60 (4.01 - 16.39) | 99.04 (97.16 - 99.17) | 1.73 (1.40 - 2.13) | 0.34 (0.14 - 0.83) |
LDL/HDL-C ratio | 3.39 | 0.646 (0.547 - 0.744) | 68.18 (45.23 - 86.14) | 63.71 (60.24 - 67.07) | 4.98 (4.33 - 13.20) | 98.62 (96.49 - 98.81) | 1.88 (1.39 - 2.54) | 0.40 (0.27 - 0.92) |
Visceral adiposity index | 2.32 | 0.663 (0.560 - 0.766) | 72.73 (49.77 - 89.27) | 59.52 (55.99 - 62.97) | 4.78 (4.16 - 13.53) | 98.74 (96.67 - 98.91) | 1.90 (1.37 - 2.35) | 0.46 (0.23 - 0.91) |
Lipid accumulation product | 47.82 | 0.743 (0.659 - 0.826) | 81.81 (59.72 - 94.81) | 60.41 (56.89 - 63.84) | 5.45 (4.75 - 18.99) | 99.17 (97.51 - 99.27) | 2.07 (1.67 - 2.56) | 0.30 (0.12 - 0.73) |
TyG index | 8.83 | 0.703 (0.600 - 0.806) | 81.81 (59.72 - 95.81) | 54.44 (50.90 - 57.96) | 4.77 (4.17 - 16.92) | 99.07 (97.25 - 99.20) | 1.80 (1.45 - 2.22) | 0.33 (0.14 - 0.81) |
TyG-BMI index | 263.07 | 0.755 (0.659 - 0.851) | 68.18 (45.12 - 86.35) | 71.70 (88.41 - 74.82) | 6.30 (5.44 - 16.32) | 98.78 (96.87 - 98.85) | 2.41 (1.77 - 3.27) | 0.44 (0.24 - 0.82) |
TyG-WC index | 862.57 | 0.801 (0.718 - 0.883) | 81.81 (59.72 - 94.81) | 70.18 (66.84 - 73.35) | 7.11 (6.16 - 23.73) | 99.28 (97.85 - 99-38) | 2.74 (2.19 - 3.43) | 0.25 (0.11 - 0.63) |