

| Journal of Endocrinology and Metabolism, ISSN 1923-2861 print, 1923-287X online, Open Access |
| Article copyright, the authors; Journal compilation copyright, J Endocrinol Metab and Elmer Press Inc |
| Journal website http://www.jofem.org |
Original Article
Volume 9, Number 5, October 2019, pages 133-146
The 17-Beta-Estradiol Improves Insulin Sensitivity in a Rapid Estrogen Receptor Alpha-Dependent Manner in an Animal Model of Malnourishment
Marta Garcia-Arevaloa, c, Estela Lorza-Gila, Nayara Leitea, Sergio Brunettob, Antonio Carlos Boscheroa, Everardo Magalhaes Carneiroa
aDepartment of Structural and Function Biology, Obesity and Comorbidities Research Center (OCRC), Institute of Biology, University of Campinas (UNICAMP), Campinas, SP, Brazil
bMedical Physics Division, Biomedical Engineering Center and Nuclear Medicine Division Clinic Hospital, University of Campinas (UNICAMP), Campinas, SP, Brazil
cCorresponding Author: Marta Garcia-Arevalo, Obesity and Comorbidities Research Center (OCRC), Institute of Biology, University of Campinas (UNICAMP), 13083-970 Campinas, SP, Brazil
Manuscript submitted September 19, 2019, accepted October 2, 2019
Short title: ERα-PI3K Interaction and Insulin Sensitivity
doi: https://doi.org/10.14740/jem612
| Abstract | ▴Top |
Background: Protein restriction causes metabolic programming to maintain glucose homeostasis in rodents. They develop increased insulin sensitivity in peripheral tissues and reduced insulin secretion by pancreatic β cells. Estradiol (E2) is a steroid hormone involved in the control of energy balance and glucose homeostasis. Here, we assessed the role of estrogen receptors (ERs) on glucose homeostasis in malnourished mice and the effect of E2 on insulin signaling.
Methods: Post-weaned Swiss male mice were fed a low-protein (LP, 6%) or chow diet (control, 14%) for 8 weeks. The malnourished phenotype in LP mice was confirmed by different physiological parameters. Hypersensitivity to insulin was demonstrated by a higher glucose infusion in the LP group compared with the control by euglycemic-hyperinsulinemic clamp.
Results: The administration of 10 µg/kg E2 during the clamp induced a significant increase in the glucose infusion rate in the LP group compared with the control, indicating enhanced insulin sensitivity in LP mice. In addition, E2 administration increased glucose uptake by peripheral tissues. These effects were blunted in mice treated with general ER antagonists (ICI 182,780 and MPP). However, PHTTP failed to interfere with the E2 effect on insulin sensitivity. In the estradiol LP-treated mice, the activity of the insulin pathway was augmented, as demonstrated by higher AKT phosphorylation and glucose uptake by the skeletal muscle.
Conclusion: Thus, we show an acute effect of E2 on insulin signaling in the skeletal muscle of protein-restricted mice. It is mediated by ERα, which interacts directly with phosphatidylinositol 3-kinase (PI3K), increasing the phosphorylation of AKT and consequently, glucose uptake in muscle.
Keywords: Insulin sensitivity; Estradiol; Estrogen receptor alpha; Low protein diet; Malnourishment
| Introduction | ▴Top |
Protein restriction in utero or in the perinatal period alters glucose homeostasis, programming the organisms to maintain adequate glucose levels to guarantee the correct energy distribution [1, 2]. The main adjustments are represented by alterations in pancreatic β-cell physiology and insulin activity in peripheral tissues. Glucose-stimulated insulin secretion (GSIS) is reduced as a consequence of a modified mechanism of secretion [3-5], associated with a reduction in insulin content and β-cell mass. In addition, insulin sensitivity is enhanced in muscle and liver, as judged by the increase in insulin receptor (IR), insulin receptor substrate-1 (IRS-1) and AKT phosphorylation [6-9]. The combination of these major functional adaptations allows an adequate glucose response in hypoinsulinemic subjects.
The hormone 17-β-estradiol (E2) and the estrogen receptor (ER) play an important role in controlling glucose [10] and energy [11] homeostasis. Knockout (KO) mice for ER alpha (ERα) presented impaired glucose homeostasis (glucose intolerance and insulin resistance) and developed obesity [12-14]. In pancreatic β cells, ERα increases the insulin content by activating the nuclear factor NeuroD1 [15, 16]. Furthermore, E2, through ER beta (ERβ), increases insulin secretion, closing the ATP-sensitive potassium channel and increasing calcium influx [17].
In peripheral tissues, both ERα and ERβ isoforms are involved in the effect of E2 on the insulin signaling pathway. In the liver, ERαKO mice show increased gene expression of lipogenic transcription factors, such as sterol regulatory element binding protein 1c (SREBP-1c) and decreased gene expression of lipid transport [18, 19]. ERαKO mice exhibit impaired glucose tolerance and hepatic insulin resistance, whereas ERβ-deficient mice show normal glucose tolerance, suggesting that ERα, but not ERβ, plays an important role in the regulation of hepatic glucose homeostasis [18]. The absence of ERα in the different sexes causes hyperplasia and hypertrophy in white adipose tissue (WAT) [12]. In females, estrogen deficiency increases the amount of WAT depots that was reduced with estrogen replacement [20].
Both ER isoforms are present in muscle tissue; however, ERα is expressed at a much higher rate than ERβ. ERαKO mice show marked insulin resistance in muscle [21, 22], while homozygous deletion of ERβ failed to produce insulin resistance [23, 24]. The mechanisms by which E2 regulates metabolism in muscle are still poorly understood. E2 stimulates the phosphorylation of Akt, AMP-activated protein kinase (AMPK) and the Akt substrate TBC1D1/4 in soleus muscle from normal rats [25]. In addition, ovariectomized female rats treated with E2, yielding levels similar to those observed in pregnancy, show decreased insulin sensitivity as well as reduced GLUT4 expression and translocation in skeletal muscle [26]. When E2-deficient ARKO male mice are treated with the selective ERβ agonist (DPN), a reduction in GLUT4 expression in muscle was observed [27]. Glucose uptake in muscle was reduced when ERα was absent [18]. Furthermore, in the physiological range, E2 is beneficial for insulin sensitivity, whereas hypo- or hyperestrogenism is related to insulin resistance [28].
Testosterone is the other steroid hormone that acts through the androgen receptor (AR). The role of AR in glucose homeostasis is less well understood than that of ERs. Male mice lacking AR in pancreatic β cells exhibit decreased GSIS, leading to glucose intolerance. The AR agonist dihydrotestosterone (DHT) increases GSIS in both human and mouse islets. This insulinotropic effect of DHT depends on activation of the glucagon-like peptide-1 receptor and amplifies its incretin effect [29]. Testosterone deficiency promotes insulin resistance in peripheral tissues, at least partially, via an AR-dependent mechanism involving a decrease in PGC1α as well as increased visceral WAT and liver steatosis [11]. Hyperandrogenism is a risk factor for metabolic syndrome in women, independent of obesity and insulin resistance [30]. Furthermore, the effect of insulin on whole-body glucose uptake was decreased when healthy women were treated with testosterone [31].
Despite the above information, how estradiol and ERs affect glucose homeostasis in protein malnutrition is unknown. Thus, we investigated whether the effects of ERs on metabolic parameters are altered in protein-malnourished mice. Furthermore, we explored how acute E2 exposure affects insulin sensitivity in malnourished mice.
| Materials and Methods | ▴Top |
Materials
The 17-β-estradiol (cat. no. E8875) was obtained from Sigma Aldrich (St. Louis, MO, USA). ER antagonists were purchased from Tocris (ICI 182,780, cat. no. 1047, Cookson Ltd, Bristol, UK), Sigma (MPP, cat. No. M7068) and Santa Cruz (PHTTP, cat. no. sc-204191). Xylazine and ketamine were purchased from Ceva (Paulinia, SP, Brazil). Plasma glucose concentrations were measured using a glucose analyzer (Accu-Chek Performa, Roche Diagnostic, Switzerland). The 2-deoxy-2-[18F]fluoro-d-glucose ([18F]FDG) was obtained from the Nuclear and Energy Research Institute (IPEN, Sao Paulo, Brazil), and it was donated by the Department of Nuclear Medicine of Hospital de Clinicas (UNICAMP), Campinas, Brazil.
Experimental animals
All experimental protocols were approved by the ethics committee at UNICAMP (protocol number: 3638-1 and 4604-1/2017) and conformed to the guidelines for ethical conduct in the care and use of animals established by the Brazilian Society of Laboratory Animal Science (SBCAL/COBEA). Male Swiss mice were purchased from the Multidisciplinary Centre for Biological Research at UNICAMP (Campinas, SP, Brazil). Weaned mice (21 days old) were randomly separated into two different groups: one group was fed a chow diet containing a normal protein level (control, 14%), and the other group was fed a low-protein diet (LP, 6%) for 8 weeks (diet compositions are described [32]; Pragsolucoes Biociencias, Jau - SP, Brazil). During the protocol, mice were maintained at 22 ± 1 °C on a 12-h light/dark cycle with free access to water and food.
Plasma analysis
After euthanasia, global blood was collected by decapitation. Plasma samples were obtained by centrifugation for 15 min at 1,200 rpm at 4 °C and stored at -80 °C until use. The insulin, estradiol and testosterone levels were analyzed by ELISA kits (EZRMI-13K Rat/Mouse Insulin ELISA, Millipore; Mouse/Rat estradiol ELISA, cat. no. ES180S-100, Calbiotech; Free testosterone ELISA, cat. no. FT178S, Calbiotech, respectively). Albumin and protein levels were measured by colorimetric assay (Bioclin (cat. no. K040, Belo Horizonte MG, Brazil) and invitro Diagnostica (cat. no. 013, Itabira MG, Brazil), respectively).
Real-time quantitative polymerase chain reaction (qPCR)
qPCR assays were performed using a 7500 real-time PCR system (Applied Biosystems, Foster City, CA). Approximately 100 mg of tissue or 300 isolated islets were used for RNA extraction. RNA extraction was performed with TRIzol Reagent (cat. no. 15596026, Ambion by Life Technologies) or an RNeasy Mini Kit (cat. no. 74104, Qiagen, USA), and 1 µg of RNA was used for the reverse transcription reaction (High Capacity cDNA Reverse Transcription; cat. no. 4368814, Applied Biosystems). Expression levels were normalized to the expression of ribosomal protein large P0 (Rplp0), also known as 36B4, and hypoxanthine phosphoribosyltransferase 1 (Hrpt). The results were expressed as the relative expression with respect to control levels (2-ΔΔCT) [33]. Primer sequences are listed in the Supplementary Table 1 (www.jofem.org).
Western blotting
For Western blotting, 20 - 50 µg of total protein was used to analyze ERα (sc-542; Santa Cruz Biotechnology) or ERβ (AB16813, Abcam), AR (sc-816; Santa Cruz Biotechnology), phospho-AKT (Ser473) (#9271, Cell Signaling Technology), total AKT (sc-8312, Santa Cruz Biotechnology), PELP1 (#13783, Cell Signaling Technology), PRMT1 (#2449, Cell Signaling Technology), SRC-3, also known as NCOA3 (#2126, Cell Signaling Technology), GAPDH (sc-25778; Santa Cruz Biotechnology), α-tubulin (T5168, Sigma-Aldrich) and β-actin (sc-81178; Santa Cruz Biotechnology).
Protein extracts were resolved using 10-15% sodium dodecyl sulfate polyacrylamide gel electrophoresis (SDS-PAGE) and nitrocellulose membranes. Band detection was revealed using an electrogenerated chemiluminescence (ECL) kit (cat. no. RPN2232; GE Healthcare) or SuperSignal™ West Femto Maximum Sensitivity Substrate (cat. no. 34096; Thermo Fisher). The band intensities were quantified using ImageJ software.
Euglycemic-hyperinsulinemic clamp
A euglycemic-hyperinsulinemic clamp was carried out with a prime continuous insulin infusion (30 mU/kg/min). Blood glucose was measured at 5-min intervals, and glucose (5% wt./vol.) was infused at a variable rate to maintain blood glucose at fasting levels (90 - 120 mg/dL) for 30 min. After this period, animals were stimulated with prime continuous E2 infusion (10 µg/kg body weight (bw)) to evaluate the effect of E2 on insulin sensitivity. Fasting blood glucose levels were restored by glucose infusion, and glycemia was measured at 5-min intervals. The period used to study the effect of E2 was after glycemia was stable for 30 min.
Islet cell isolation
Islets of Langerhans were isolated by collagenase (Sigma Chemical, St. Louis, MO, USA) digestion (modified from [34]). The solution used for the isolation of the islets contained (in mmol/L): 115 NaCl, 10 NaHCO3, 5 KCl, 1.1 MgCl2, 1.2 NaH2PO4, 2.5 CaCl2, 25 HEPES and 5 D-glucose, pH 7.4, as well as 0.25% BSA.
[18F]-FDG positron emission tomography/computed tomography (PET/CT) scan
Metabolic (PET) and CT images were acquired and processed using an ALBIRA System, a small animal PET/SPECT/CT in vivo imaging system (Bruker® Corporation, Massachusetts, USA), and they were analyzed using PMOD software (PMOD Technologies LLC Zurich, Swiss). Mice were fasted for 6 h and anesthetized with 2% isoflurane. Approximately 300 µC of [18F]FDG was injected into the venous sinus with or without 10 µg/kg bw of E2 in a final volume of 100 µL. After 40 min of [18F]FDG distribution (uptake) at 23 - 24 °C, PET images were acquired. PET scans lasted a total duration of 40 min. The CT scan was performed immediately after the PET scan without changing the position of the mice, always in the cranium-caudal direction from head to proximal thighs. The CT was performed as a low-dose acquisition with 35 kVp, 400 µA and 600 projections with a field of view of 71.3 mm/bed. PET scans were reconstructed using PMOD software, and images were calibrated in Bq per mL by scanning a cylindrical phantom. The volume of interest (VOI) was drawn manually on CT volume and copied to fused PET images. PET images of uptake (Bq/mL) were measured, and the usual standardized uptake values (SUVs) for body mass were calculated.
Glucose (FDG) uptake by gamma counter
Male mice were fasted for 6 h, and they were anesthetized with a mixture of ketamine and xylazine. Approximately 30 µC of [18F]FDG was injected into the venous sinus with or without 10 µg/kg bw of E2 in a final volume of 100 µL. After 40 min of [18F]FDG biodistribution (uptake) at 23 - 24 °C, the animals were euthanized, and the circulating blood was extracted to avoid contaminating tissues with the radiolabel [18F]FDG. Finally, the different organs were removed. The activity of the radiolabel [18F]FDG in each tissue was acquired by the Wizard2 2-Detector Gamma Counter (PerkinElmer). The usual SUVs for body mass were calculated using the total uptake (Bq/g)/the total activity administered × the mouse mass.
Insulin signaling
Mice in the fed state were stimulated with PBS (negative control), 5 UI insulin (positive control) and 5 UI insulin + 10 µg/kg E2. After 5 min, the animals were sacrificed, and the tissues were removed and ultra-frozen in liquid nitrogen. Samples were stocked at -80 °C until they were used for Western blotting analysis.
Co-immunoprecipitation assay
Frozen muscle tissue was homogenized in NP-40 lysis buffer (50 mM Tris HCL, pH 7.4; 1% NP 40; 50 mM NaCL; 10% glycerol; 1 mM EDTA and cOmplete™ Protease Inhibitor Cocktail (cat. no. 11697498001; Roche)). The samples were maintained in constant agitation for 2 h at 4 °C. The lysate samples were pre-cleared. For this step, we used protein A-sepharose beads (cat. no. 17-0469; GE Healthcare), and the lysate samples were rotated for 1 h at 4 °C. After this time, samples were centrifuged, and the supernatant was collected.
The protein concentration of the pre-cleared lysate was quantified by the Pierce method (cat. no. 22660; Thermo Fisher). An aliquot of 10% input of each sample as whole-cell lysate was saved. Afterwards, they were run as pre-cleared input samples as a control loading for the blotting gel.
We used 0.5 mg of protein in the immunoprecipitation assay. For each reaction, we added 2 µg of ERα antibody (sc-542; Santa Cruz Biotechnology). The conjugated protein-antibody was precipitated with protein A/G plus agarose (sc-2003; Santa Cruz Biotechnology). Reducing sample buffer was added, and the samples were boiled. They were run on a Western blotting gel or stored at -80 °C.
The immunoblotted protein was the p100α subunit from PI3Kinase (#4249; Cell Signaling Technology).
Statistical analysis
GraphPad Prisma 6 software for Windows (GraphPad Software, La Jolla, CA, USA) was used for all statistical analyses. To assess differences between treatment groups for each exposure paradigm, we used one-way analysis of variance (ANOVA) and Student’s t-test to compare two groups. The results were considered significant at P < 0.05. Data are shown as the mean ± standard error of the mean (SEM).
| Results | ▴Top |
ER and AR in malnourished mice
Malnourished male mice exhibited lower body weight (Fig. 1a, b) and decreased plasma insulin (Fig. 1c), protein (Fig. 1d) and albumin levels (Fig. 1e) in the fed state compared with controls. According to the literature, these data confirmed that this animal model is a good representation of protein restriction. In addition, no information was available regarding steroid hormone plasma levels in malnourishment. We found a marked increase (1.7 times) in E2 in LP compared with control (Table 1). In contrast, free testosterone levels were decreased by 3.3-fold in the LP group.
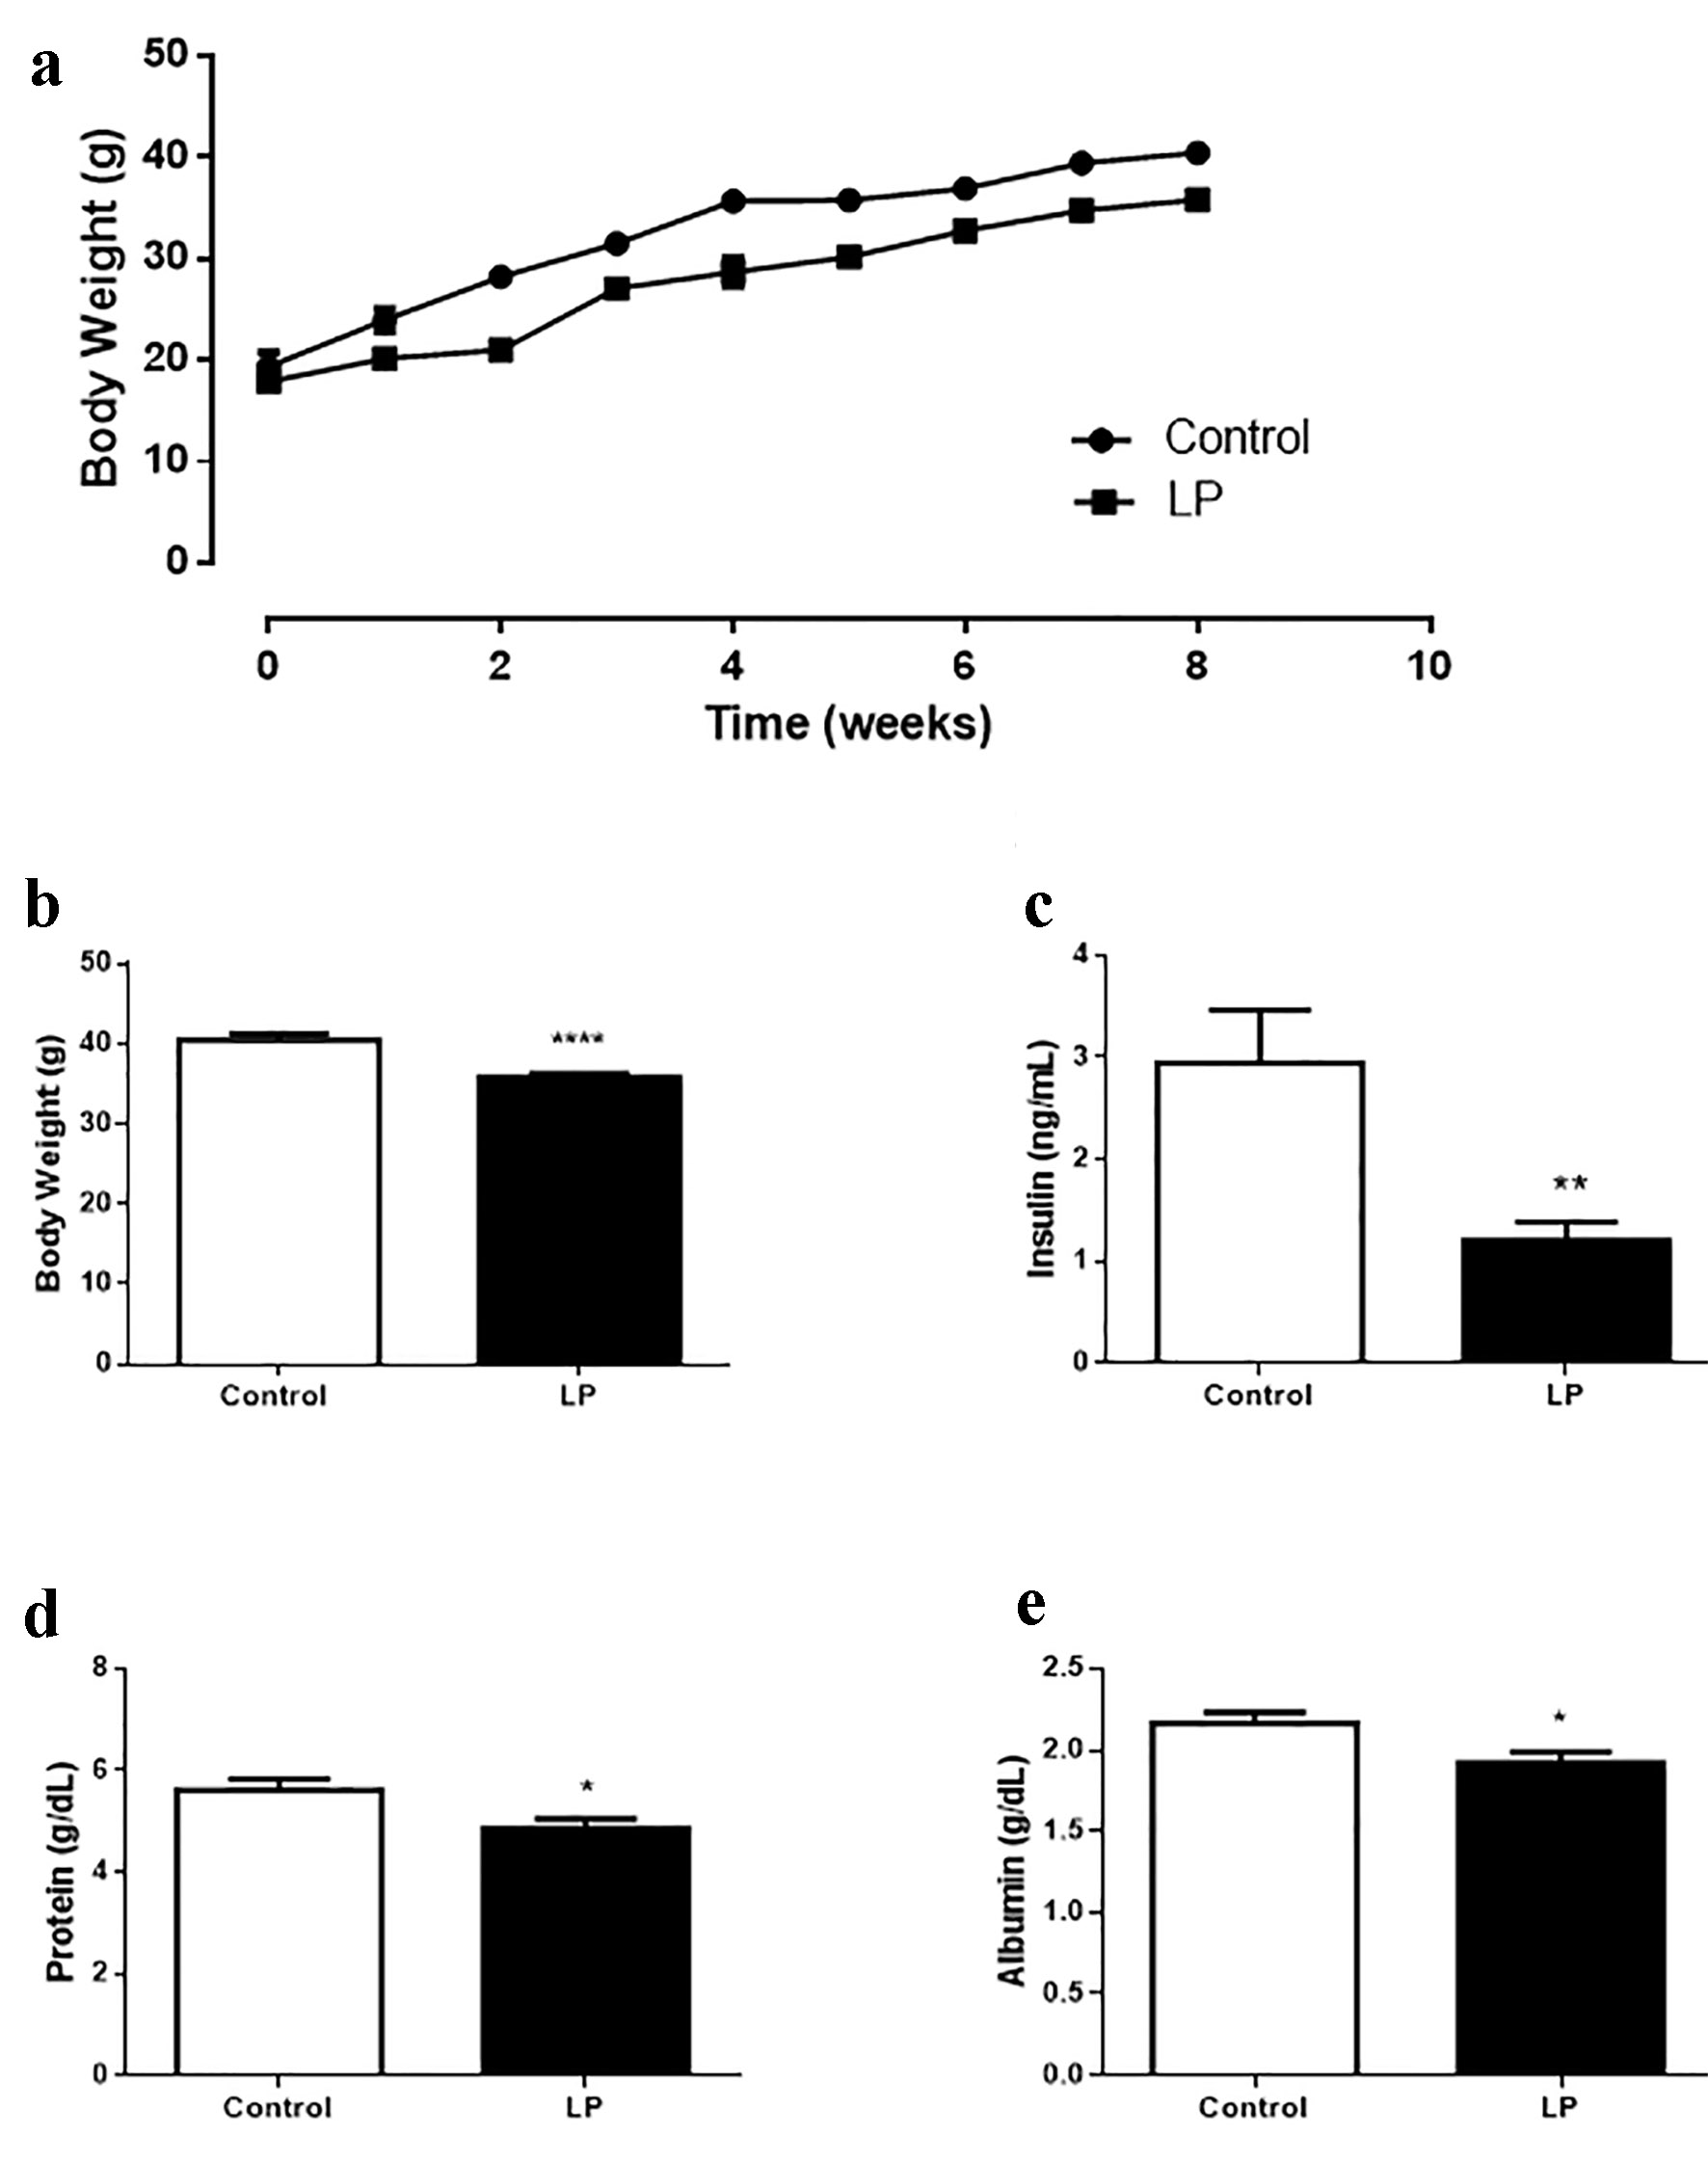 Click for large image | Figure 1. Malnourishment male mouse model characterization. (a) Body weight evolution during 8 weeks of diet treatment. (b) Body weight after 8 weeks of low-protein (6%) diet treatment. (c) Insulin plasma levels. (d) Protein plasma levels. (e) Albumin plasma levels. Data are expressed as the mean ± SEM (n = 12 - 16 animals/group). t-test: *P < 0.05 compared with control group; **P < 0.01 compared with control group. LP: low protein; SEM: standard error of the mean. |
 Click to view | Table 1. Steroids Hormone Plasma Levels in Control and Protein Restriction Mice |
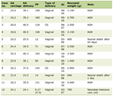
Different expression profiles of ER genes were observed, depending on the tissue and isoform studied (Fig. 2). In the liver, LP mice showed decreased expression of ERα compared with controls (Fig. 2a) and increased expression of the β isoform (Fig. 2b). By contrast, in gastrocnemius muscle, both isoforms, α and β, were increased in LP compared with control (Fig. 2c, d). In white adipose tissue, ERα and β showed a decrease in their expression levels (Fig. 2e, f). In pancreatic islets, we observed increased expression of ERα, whereas ERβ was unaltered (Fig. 2g, h).
 Click for large image | Figure 2. ER gene expression in islets of Langerhans and peripheral tissues implicated in glucose homeostasis in Swiss mice fed an LP diet (6%) for 8 weeks. (a, b) ERα and β relative expression, respectively, in the liver (n = 7 - 10 mice/treatment), (c, d) in the gastrocnemius muscle (n = 9 - 10 mice/treatment), (e, f) in adipose tissue (n = 7 - 12 mice/treatment), (g, h) in the islets of Langerhans (n = 4 mice/treatment). Data are expressed as the mean ± SEM. t-test: *P < 0.05 compared with control group; **P < 0.01 compared with control group. ER: estrogen receptor; LP: low protein; SEM: standard error of the mean. |
The fact that LP mice showed increased ERβ expression in the liver, an isoform usually low in this tissue, led us to think that the general expression profiles of the receptors could be altered throughout the whole body in these mice. Thus, we performed a comparative study using hypothalamus and lung tissues for positive control of ERα and ERβ expression, respectively. The data did not show any change in the whole expression profile in either ER isoform (Supplementary Fig. 1, www.jofem.org).
The differences found in gene expression did not reflect the protein profile (Fig. 3). In the liver (Fig. 3a, b), no differences were observed in ERα or ERβ levels; however, we did observe a significant increase in the small isoform, ERα36. In muscle (Fig. 3c, d), adipose tissue (Fig. 3e, f), and pancreatic islets (Fig. 3g, h), the levels of α and β receptors were similar in mice of both groups.
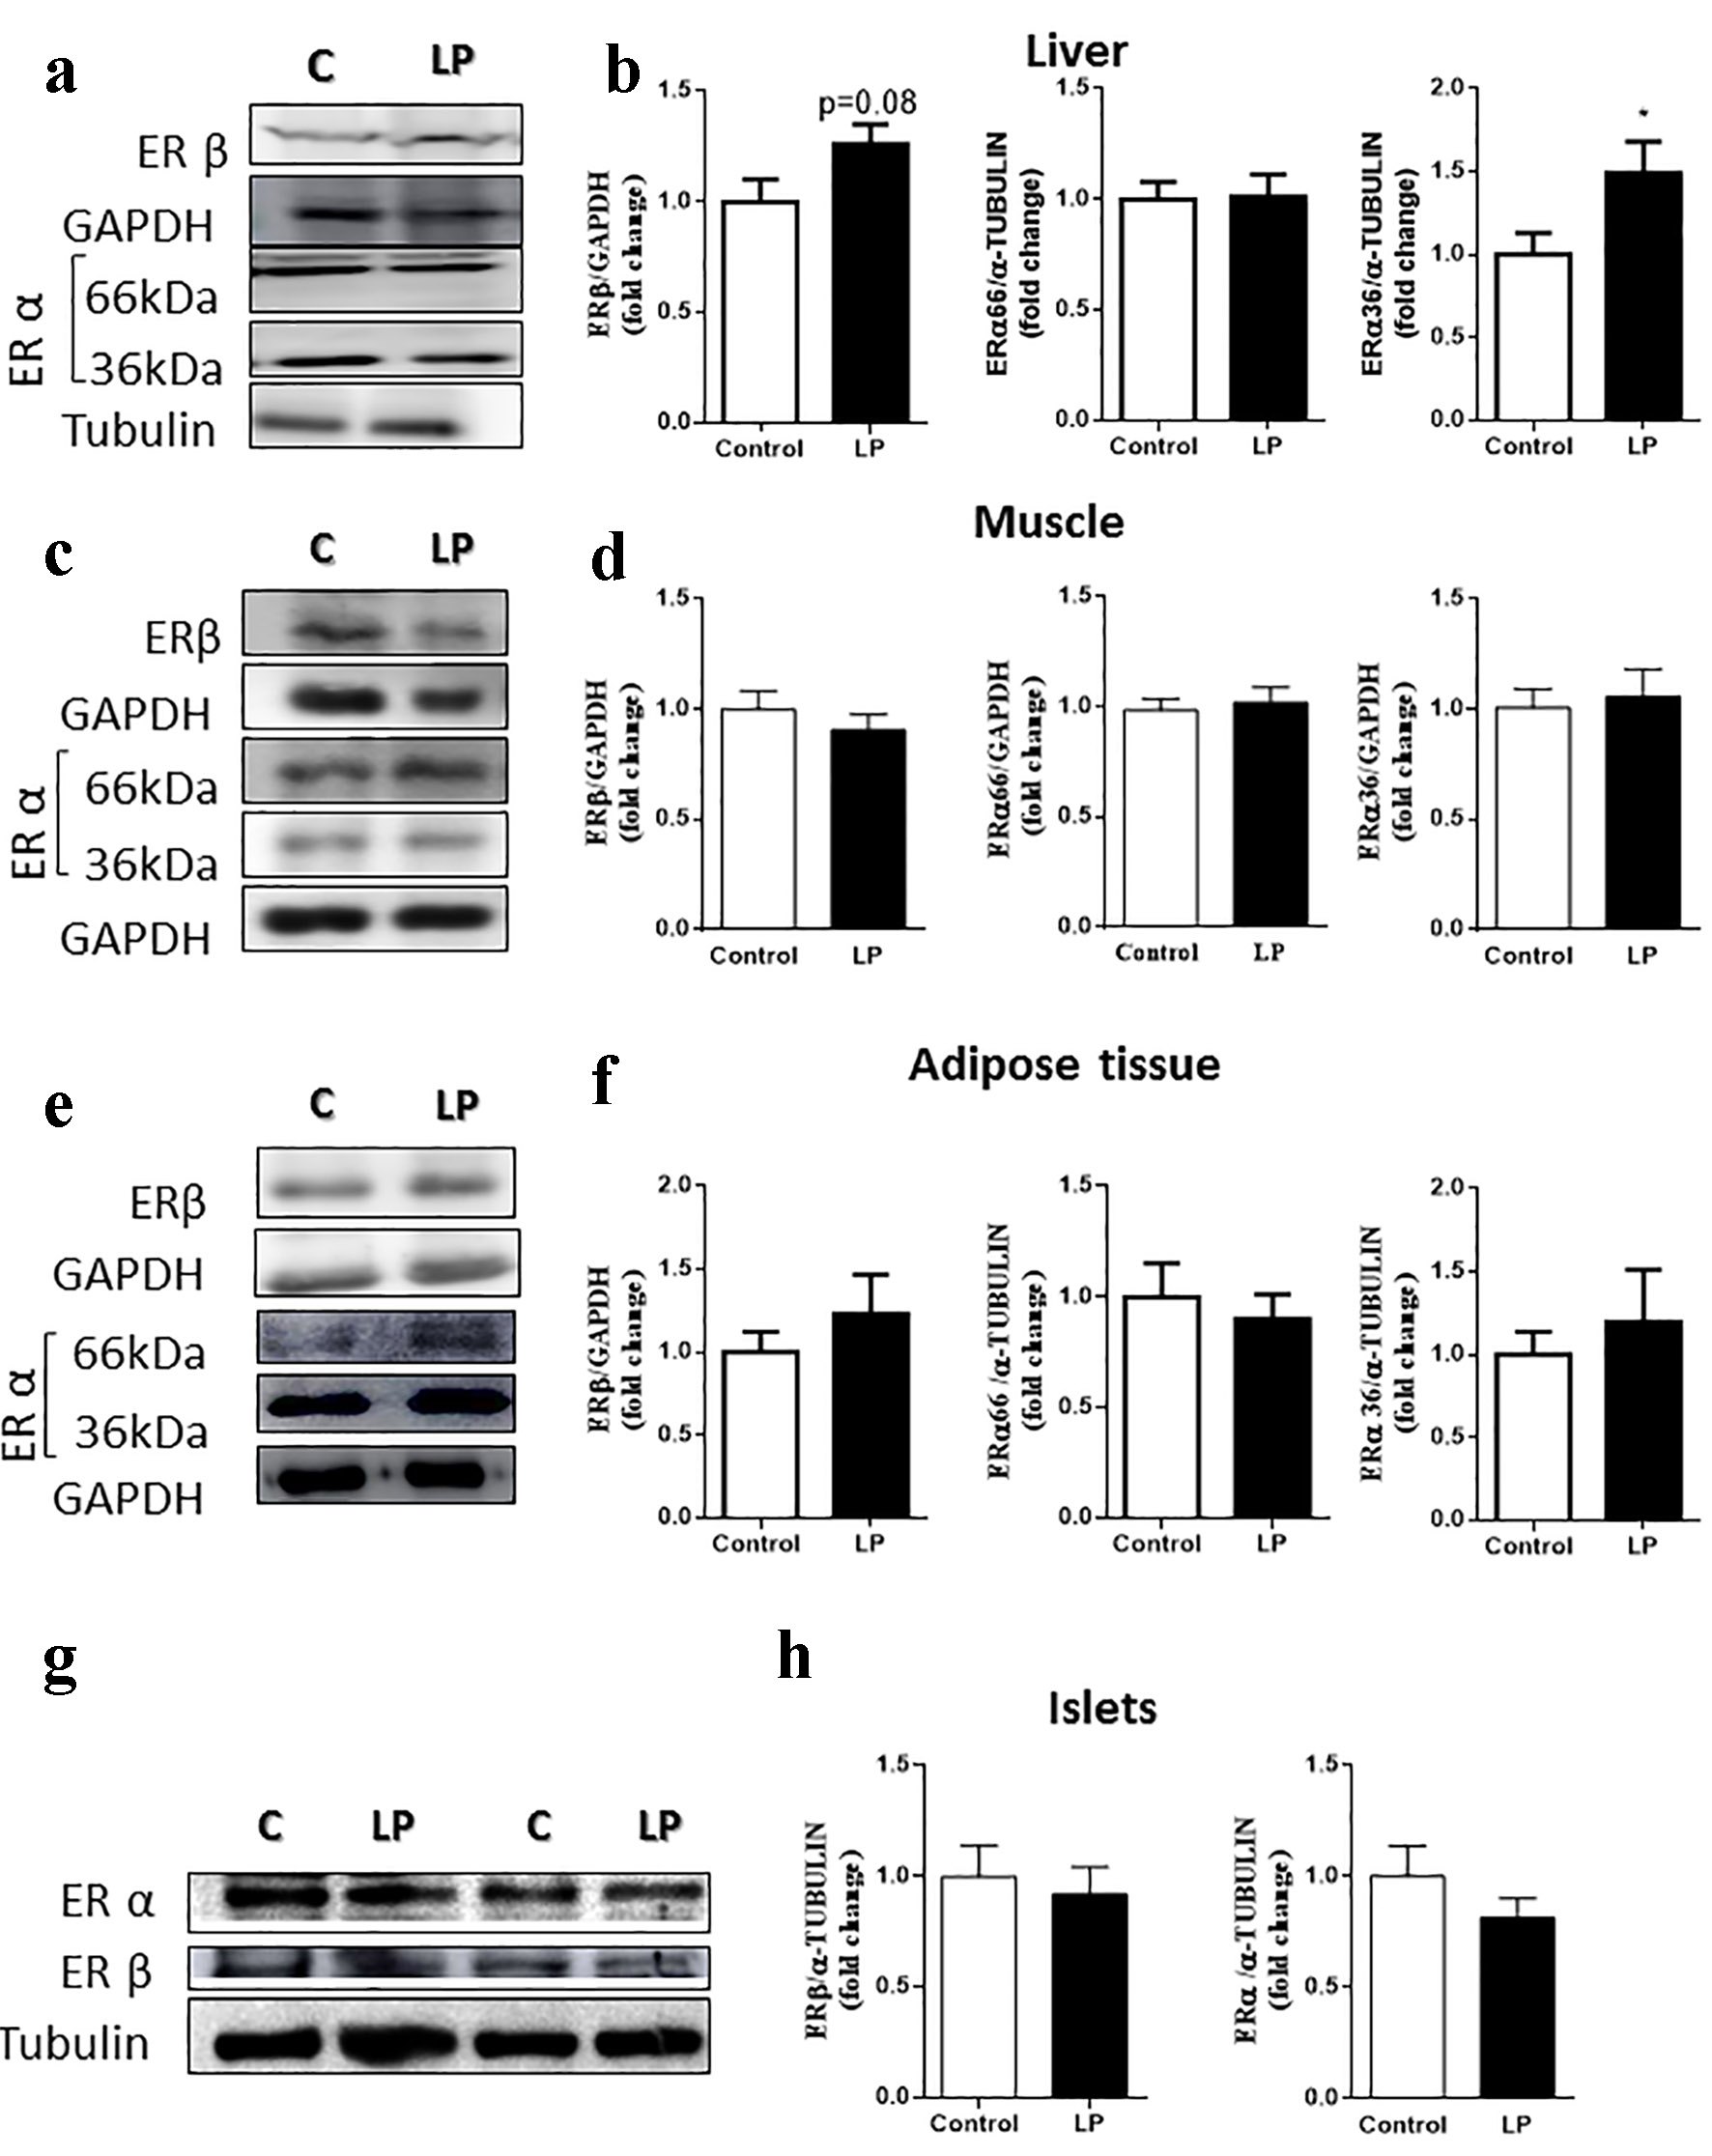 Click for large image | Figure 3. ER protein levels in male mice fed an LP diet (6%) for 8 weeks. (a) Representative immunoblots of ER protein in the liver. (b) Quantification of ERβ, ERα66 and ERα36 isoforms by densitometry of the band (n = 7 - 10 mice/treatment). (c) Representative immunoblots of ER protein in the muscle. (d) Quantification of ERβ, ERα66 and ERα36 isoforms by densitometry of the band (n = 13 mice/treatment). (e) Representative immunoblots of ER protein in adipose tissue. (f) Quantification of ERβ, ERα66 and ERα36 isoforms by densitometry of the band (n = 6 - 8 mice/treatment). (g) Representative immunoblots of ER protein in the islets. (h) Quantification of ERβ and ERα66 isoforms by densitometry of the band (n = 6 - 7 mice/treatment). Data are expressed as the mean ± SEM. t-test: *P < 0.05 compared with the control group. ER: estrogen receptor; LP: low protein; SEM: standard error of the mean. |
No changes in AR gene expression were observed in liver, adipose tissue or pancreatic islets of LP compared with control mice (data not shown). Nevertheless, the expression of AR in muscle was reduced in LP (Fig. 4a), even though the AR protein content was not different between groups (Fig. 4b).
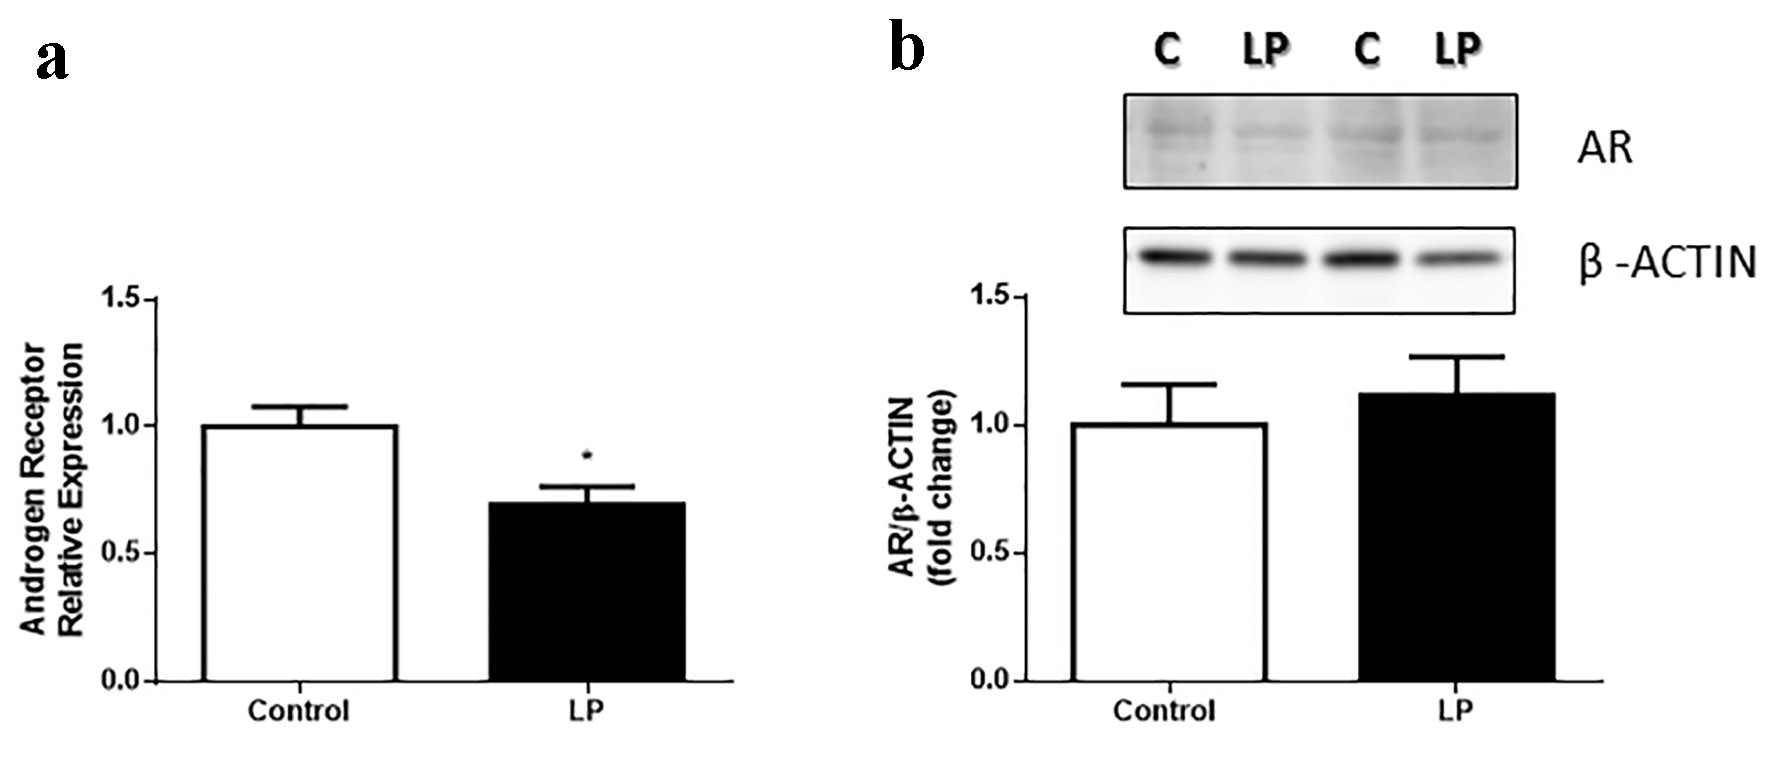 Click for large image | Figure 4. AR gene expression in gastrocnemius muscle in Swiss male mice fed an LP diet (6%) for 8 weeks. (a) AR relative expression gastrocnemius muscle (n = 7 - 8 mice/treatment). (b) Quantification of AR protein content in the gastrocnemius muscle and representative bands (n = 11 - 13 mice/treatment). Data are expressed as the mean ± SEM. t-test: *P < 0.05 compared with the control group. AR: androgen receptor; LP: low protein; SEM: standard error of the mean. |
Effect of E2 on insulin sensitivity
Insulin sensitivity was addressed using a euglycemic-hyperinsulinemic clamp technique. Mice were exposed to a prime continuous influx of insulin and a variable rate of glucose to maintain blood glucose at fasting levels. After 30 min of stable glycemia, we stimulated the mice with a prime continuous influx of E2 (Supplementary Fig. 2, www.jofem.org). The LP group showed increased insulin sensitivity in peripheral tissues reflected by an increase in the glucose infusion rate (GIR) and glucose uptake, as described in the literature. When the mice were stimulated in a concomitant way with insulin and E2, LP mice showed an increase in insulin sensitivity after E2 exposure. This increase was reflected by an augmented GIR compared with that of the LP group stimulated only with insulin and compared with the control group (in both vehicle and E2 conditions) (Fig. 5a, b). Overall, our results show that E2 promoted an exacerbated increase in insulin sensitivity in protein-restricted mice. This effect was rapid and was observed approximately 5 min after E2 administration (Supplementary Fig. 2, www.jofem.org).
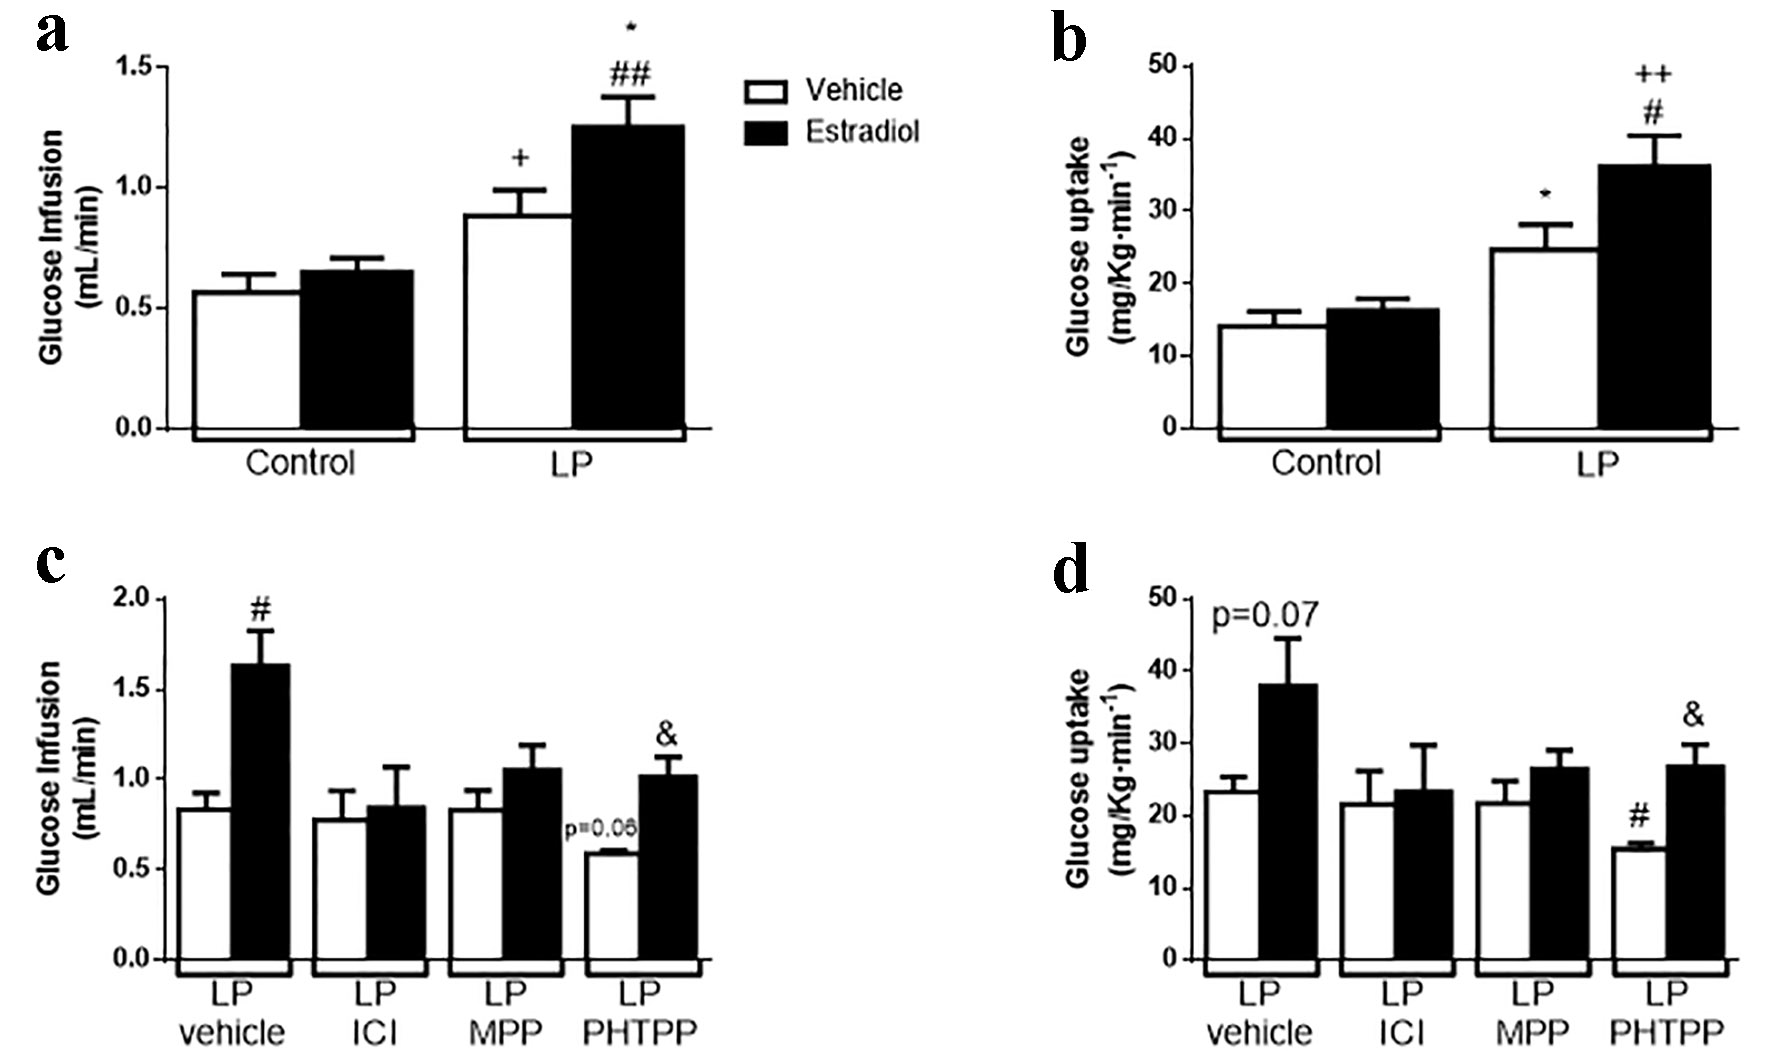 Click for large image | Figure 5. Effect of the natural hormone estradiol on insulin sensitivity by euglycemic-hyperinsulinemic clamp on malnourished male mice. (a) Glucose infusion rate (GIR) during clamp (n = 4 - 5 mice/group). (b) Glucose uptake during clamp (n = 5 mice/group). (c) GIR on animals treated with 500 µg/kg body weight of ER antagonists (ICI, general ER antagonist; MPP, ERα antagonist; PHTTP, ERβ antagonist) for 4 days (n = 3 - 4 mice/group). (d) Glucose uptake on the same animals in (c). In white, animals stimulated with glucose + vehicle; in black, same animals stimulated in a normoglycemic state with 10 µg/kg body weight of estradiol. Data are expressed as the mean ± SEM. t-test: *P < 0.05 vs. control-vehicle; #P < 0.05 vs. LP-vehicle; ++P < 0.01 vs. control + E2; &P < 0.05 vs. LPPHTTP-vehicle. GIR: glucose infusion rate; ER: estrogen receptor; LP: low protein; SEM: standard error of the mean. |
We explored whether ER and which isoform/s were involved in this phenomenon. For this assay, we treated LP mice with a variety of ER antagonists. First, we treated LP mice with a general antagonist of ER, ICI 182,780 (ICI), for 4 days (500 µg/kg bw/day) [35, 36]. After ICI administration, the effect of E2 in LP mice was absent; no changes were found in GIR or in glucose uptake (Fig. 5c, d). Second, we determined which receptor isoform was involved. For this part, mice were treated with a specific ERα antagonist (MPP) or an ERβ antagonist (PHTPP). MPP blunted the effect of E2, whereas PHTPP-treated mice showed an increase in insulin sensitivity when stimulated with E2, represented by an augmented GIR and glucose uptake, similar to that observed in the control experiment (LP mice treated with the vehicle that received insulin and insulin + E2). In contrast, we observed a tendency to decrease insulin sensitivity in the PHTPP-treated mice stimulated only with insulin and a significant decrease in glucose uptake (Fig. 5c, d). We conclude that the improvement in insulin sensitivity elicited by E2 in protein-restricted mice was ERα-mediated.
To rule out whether this effect is sex-dependent, we performed the euglycemic-hyperinsulinemic clamp in female LP mice (phenotype described in Supplementary Fig. 3, www.jofem.org). Female mice also showed an increase in insulin sensitivity when they were stimulated with insulin and E2. Thus, the effect was similar in both sexes (Fig. 6).
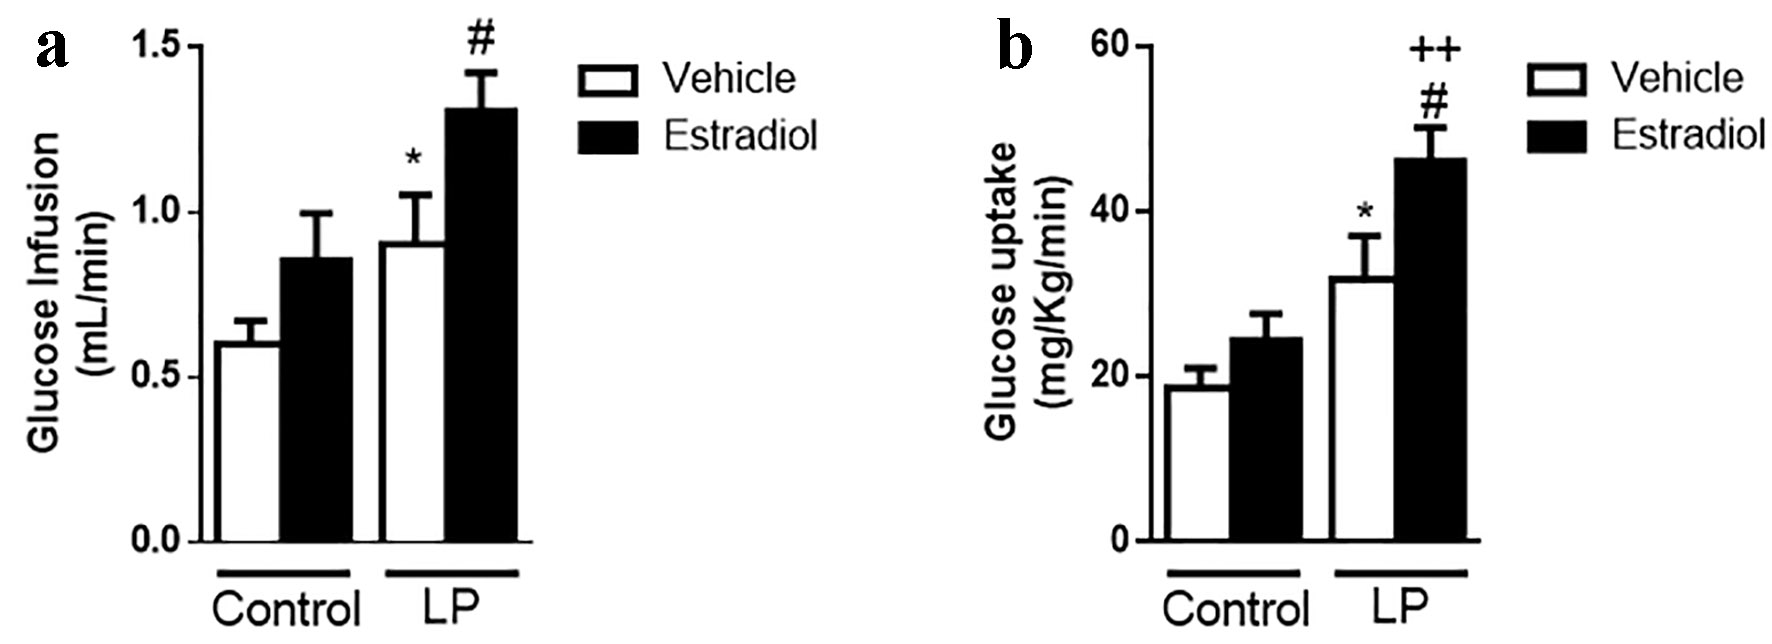 Click for large image | Figure 6. Effect of E2 on insulin sensitivity by euglycemic-hyperinsulinemic clamp in female malnourished mice. (a) GIR during clamp (n = 5 - 6 mice/group). (b) Glucose uptake during clamp (n = 5 - 6 mice/group). In white, animals stimulated with glucose + vehicle; in black, the same animals stimulated in a normoglycemic state with 10 µg/kg body weight of estradiol. Data are expressed as the mean ± SEM. t-test: *P < 0.05 vs. control; #P < 0.05 vs. LP; ++P < 0.01 vs. control + E2. GIR: glucose infusion rate; LP: low protein; SEM: standard error of the mean. |
Effects of E2 on glucose uptake in peripheral tissues
In male protein-restricted mice, E2 effects on insulin sensitivity were reflected by higher glucose uptake. We assessed which peripheral tissues responded to E2 stimulation using a micro-PET/CT scan to measure the uptake of the radiolabeled [18F]FDG. For this assay, 6-h-fasted male mice were challenged by an intravenous injection of [18F]FDG or radiolabel plus E2 (10 µg/kg bw). After 40 min, the mice were scanned. In Figure 7a and b, representative pictures showed differential accumulation of [18F]FDG in the tissues (3D reconstruction of the scanning is shown in the Supplementary Videos, www.jofem.org). A higher [18F]FDG concentration was observed in LP male mice exposed to E2 (Fig. 7b) compared with the control group (Fig. 7a). When we studied glucose uptake, representing an SUV, in specific structures, we observed a significant increase in the SUV in LP mice stimulated with E2 in the muscle of the hind legs (Fig. 7c) but not in the liver (Fig. 7d). However, due to the characteristics of the image acquired, it was not possible to address the study question using this technique to analyze the perigonadal adipose tissue. Therefore, we measured the radiolabeling in different tissues using a gamma counter (Supplementary Fig. 4, www.jofem.org). No differences were observed in the SUV between LP mice, stimulated or not stimulated with E2, in both perigonadal adipose tissue and liver (Supplementary Fig. 4A and B, www.jofem.org). However, the SUV (P = 0.053) was increased in the gastrocnemius muscles in mice stimulated with E2 compared with controls (Supplementary Fig. 4C, www.jofem.org).
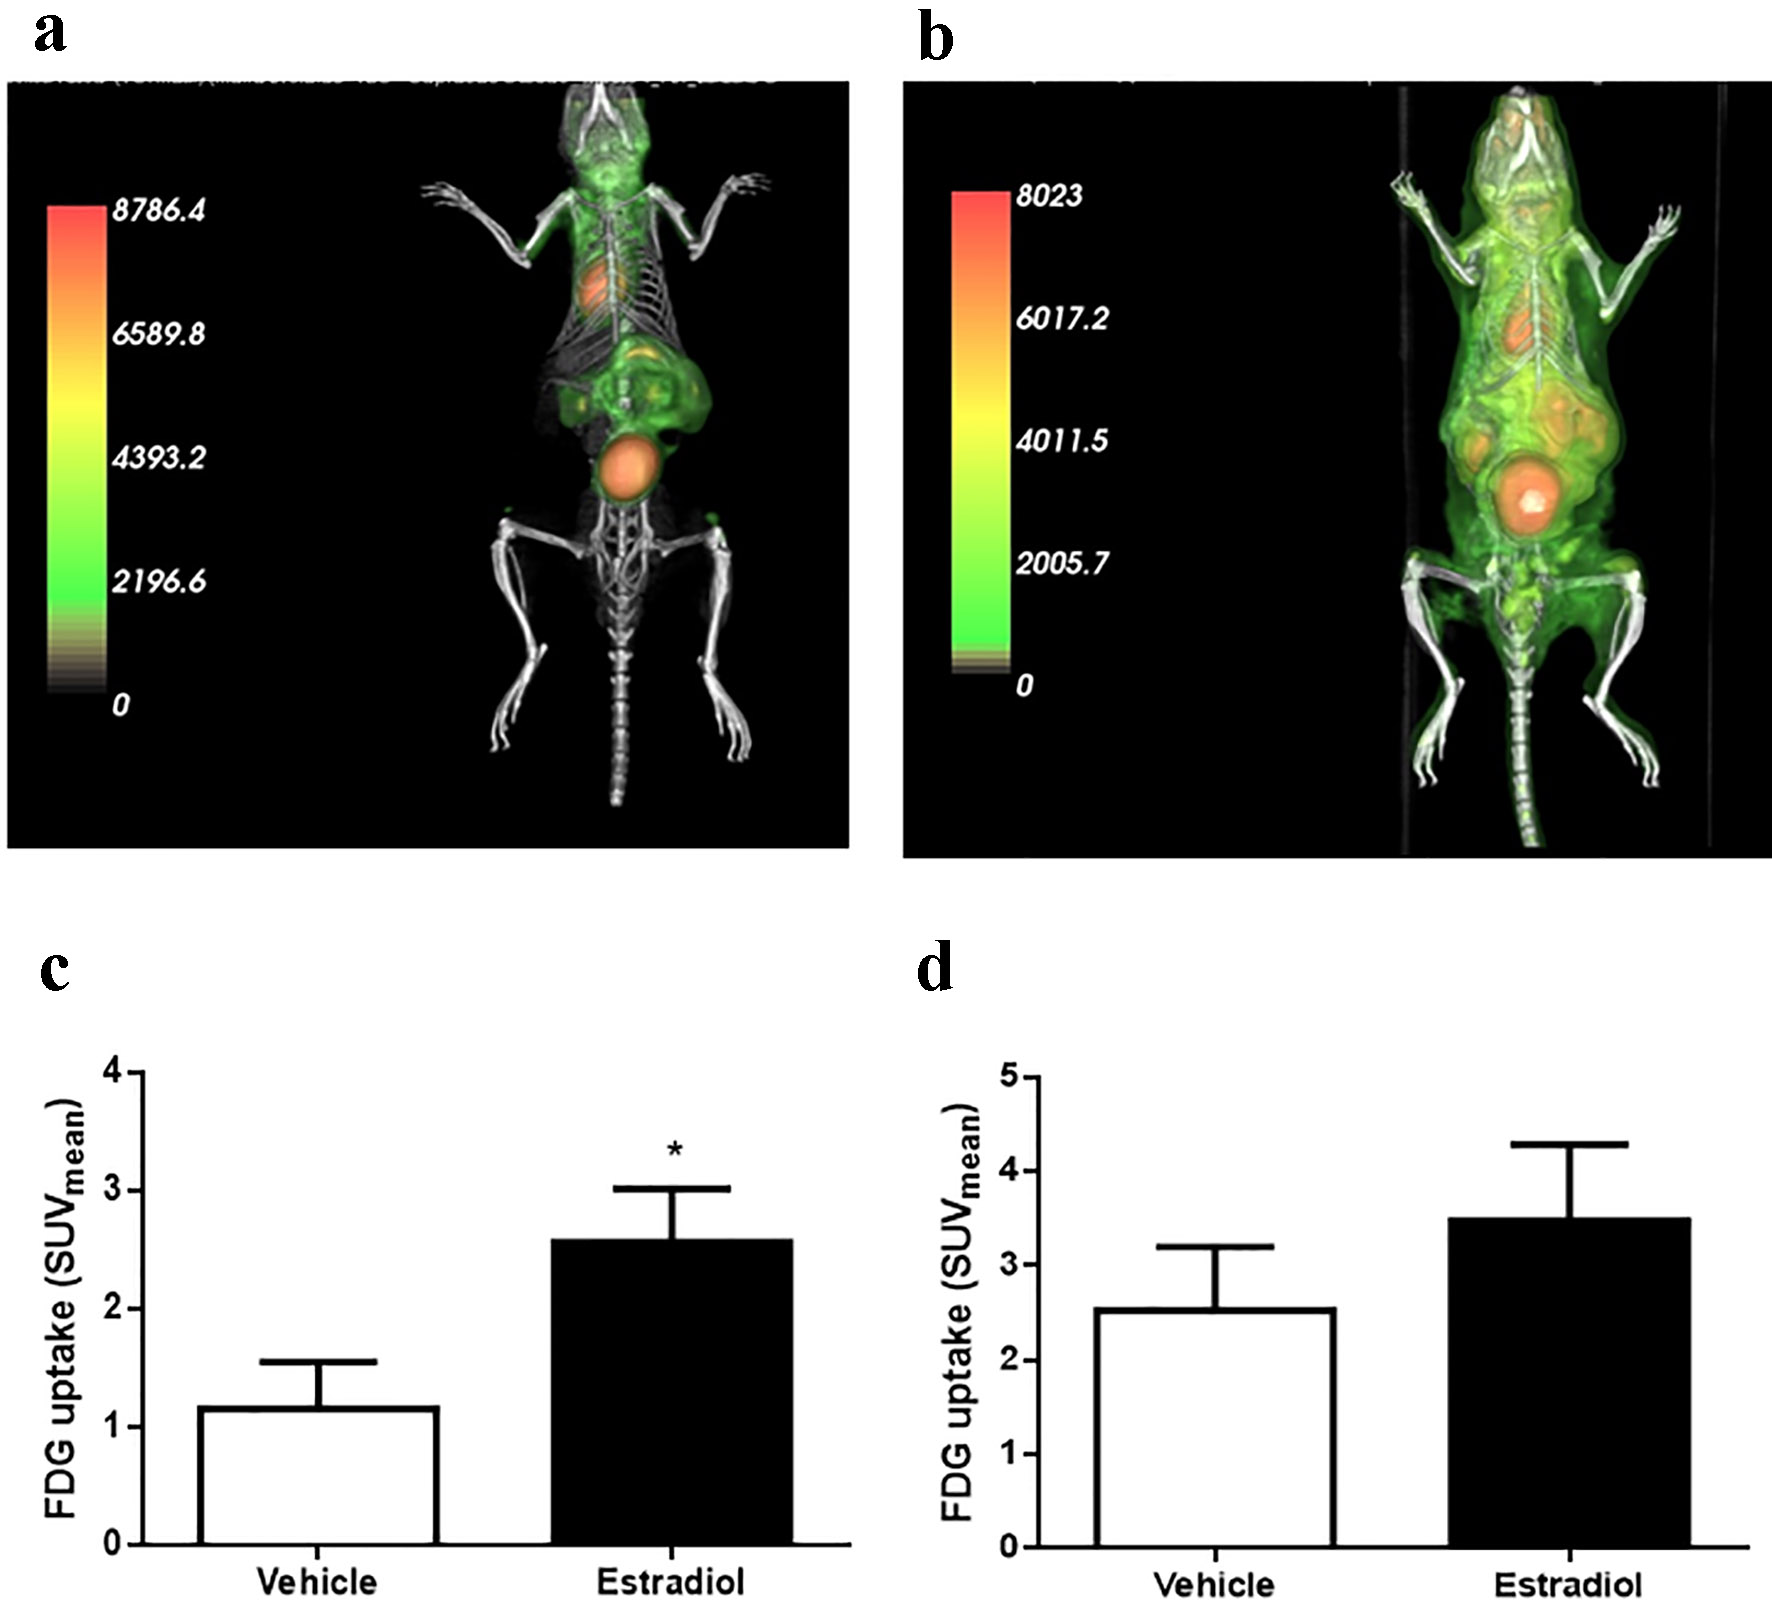 Click for large image | Figure 7. Glucose (FDG) uptake by microPET/CT and gamma counter. (a) Representative image of PET/CT scan in animals stimulated with vehicle or (b) 10 µg/kg body weight of estradiol. (c) Glucose uptake by the muscle and (d) liver (n = 6 - 7 animals/group). Data are expressed as the mean ± SEM. t-test compared with vehicle group. t-test: *P < 0.05 compared with vehicle group. PET/CT: positron emission tomography/computed tomography; SEM: standard error of the mean. |
In muscles from male malnourished mice, the effect of E2 on the insulin pathway is reflected by increased AKT phosphorylation (Fig. 8a). No differences in AKT phosphorylation were found in the liver or adipose tissue under insulin or E2 conditions (data not shown).
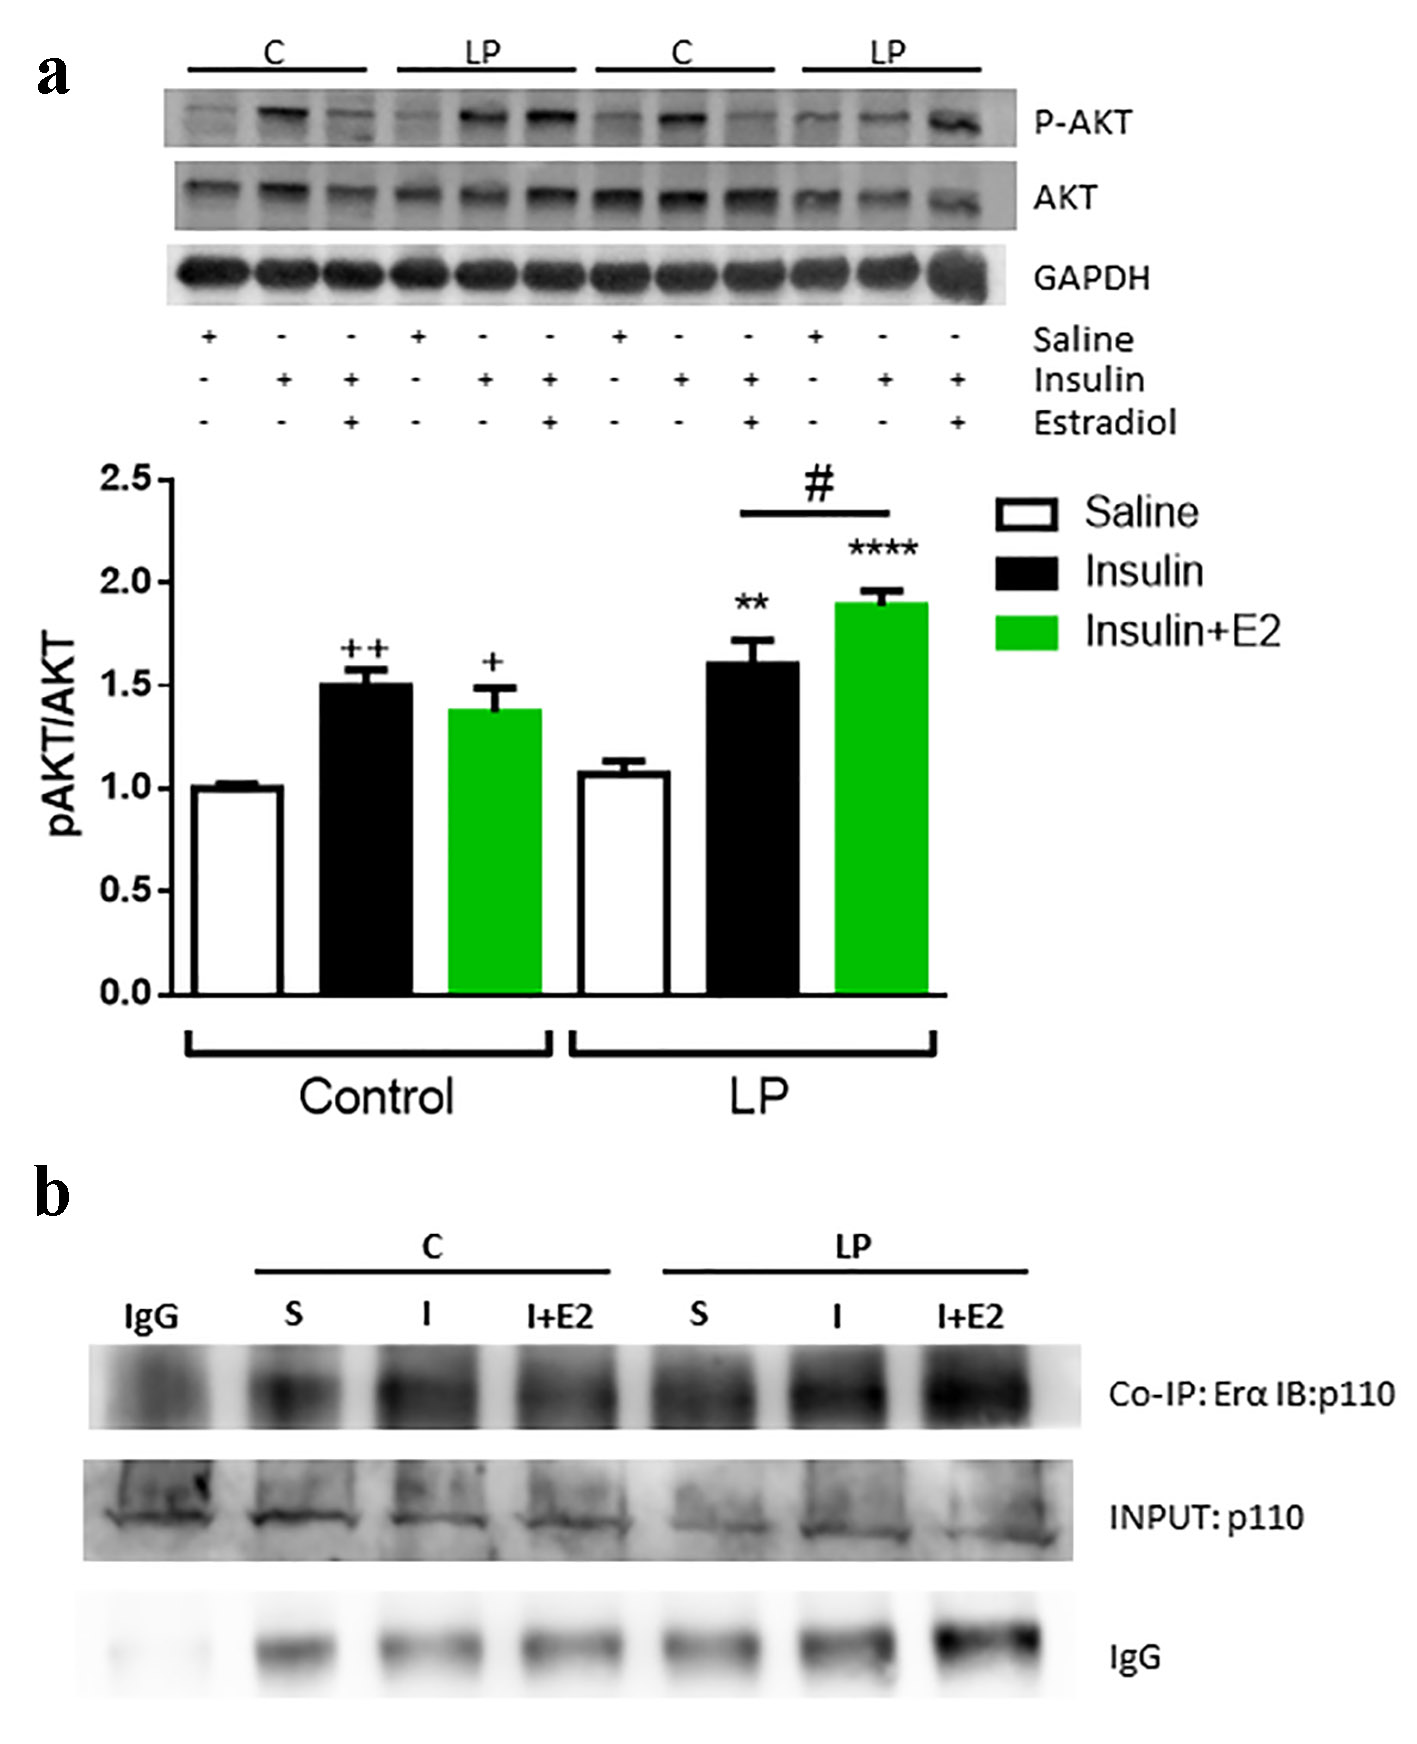 Click for large image | Figure 8. Insulin stimulation with or without E2 in protein restricted male mice in the muscle. (a) Representative Western blotting protein bands and the relative quantification of AKT phosphorylation in muscle. Data are expressed as the mean ± SEM (n = 4 - 6 animals/group). One-way ANOVA: **P < 0.01 and ***P < 0.001 compared with LP vehicle group; ++P < 0.01 and +++P < 0.001 compared with control vehicle group; #P < 0.05 compare LP insulin vs. LP insulin + E2 group by t-test. (b) Representative Western blotting protein bands from the co-immunoprecipitation of the ERα and immunoblotting of PI3K, p110 subunit. Samples were prepared with 2 µg of antibody and 1 µg of IgG as a negative control. SEM: standard error of the mean; ANOVA: analysis of variance; LP: low protein; ER: estrogen receptor; PI3K: phosphatidylinositol 3-kinase. |
Studies in the breast cancer cell line MCF7 demonstrated that E2 stimulates cell growth through the upregulation of phosphatidylinositol 3-kinase (PI3K)/AKT signaling via ERα [37]. Based on this evidence, we investigated whether this process occurs in LP male mice. When we immunoprecipitated ERα from gastrocnemius samples and immunoblotted the PI3K (the p110 subunit), we observed a higher intensity band in the muscles of malnourished male mice stimulated with E2 and insulin in a concomitant way (Fig. 8b). These data indicate a higher interaction between ERα and PI3K in the presence of E2, increasing the activation of the PI3K/AKT pathway and inducing a consequent increase in p-AKT.
Is insulin sensitivity increased via ERα co-regulators?
Post-transcriptional regulation of ERs plays a key role in controlling their activity. For example, in human breast cancer cells, overexpression of SCR-3 resulted in a decreased response of ERs to tamoxifen [38-40]. When we studied this co-activator in the muscles of the different groups 5 min after insulin or insulin + E2 stimulation, we did not observe differences in the protein content in any group (Supplementary Fig. 5A, www.jofem.org).
Temporary methylation in the R260 of ERα by PRMT1 induces the formation of a cytoplasmic complex, formed by ERα, PI3K, tyrosine kinase SCR and FAX, and it increases AKT activity [41]. Our data did not show alterations in the PRMT1 content in the muscle (Supplementary Fig. 5B, www.jofem.org). PELP1 is another co-activator of ER that acts as a scaffold, regulating the interaction between ER and SRC, activating SRC and the family of ERK kinases and subsequently activating PI3K via estrogen [42, 43]. We did not find expression of this protein in the muscle of Swiss mice (data not shown).
| Discussion | ▴Top |
In the present study, we demonstrated that E2 has an important acute effect on insulin sensitivity in protein-restricted mice. In particular, E2 improves insulin sensitivity in an ERα-dependent manner. We also found that ERα activates the PI3K signaling pathway with a subsequent increase in Akt phosphorylation in the gastrocnemius muscle of LP mice. This increased Akt activity leads to an augmented glucose uptake, which contributes to the improvement of insulin action. No changes were found at the ER protein levels in the different tissues examined, suggesting that the expression profile does not influence the E2 effect.
In addition, we found an upregulation of circulating E2 in LP male mice, accompanied by a decrease in circulating free testosterone levels (Table 1). This phenomenon is comparable to what occurs in ageing men, where an increase in E2 and a decrease in T levels were observed, in contrast to that observed in healthy young subjects. It is known that men with lower T levels are at higher risk of developing metabolic syndrome [44]. A higher ratio of T/E2 may protect against it, since higher T levels are linked to better insulin sensitivity [45]. In addition, it is known that AR is involved in adiponectin physiology. Adiponectin plasma levels are high in hypogonadal men and are reduced by T therapy [46]. T infusion also decreases adiponectin in mice [47], an effect that is at least partially mediated via AR, since adiponectin is increased in AR-deficient mice [48]. In LP mice, adiponectin is increased [32], which could explain the higher basal insulin sensitivity in this model.
The increased E2 levels reflect increased aromatase activity in LP mice, and the aromatization of T into E2 is critical for energy homeostasis in males [11]. Orchiectomized male rodent, treated either with T or E2, remain lean, while those treated with the pure androgen DHT (that is not aromatized to E2) develop obesity [49].
The ERs were involved in glucose homeostasis [12-14, 50], and they may be implicated in higher insulin sensitivity in malnourished rodents. Figure 2 shows that ER gene expression is modulated by diet; however, these changes in gene expression did not reflect alterations in protein content (Fig. 3). Thus, the increased insulin sensitivity in these mice cannot be explained by modification of the ER protein content.
E2 is a steroid hormone that favors insulin sensitivity. In ovariectomized rodents, a reduction in circulating E2 provokes insulin resistance and impairment of muscle glucose disposal [51]. In menopausal women, there is a decline in insulin sensitivity concomitant with an increase in fat mass and higher levels of circulating inflammatory markers [52]. In LP mice, we observed a rapid response to E2, within approximately 5 min after its administration. LP mice showed a profound decrease in glycemic levels (Supplementary Fig. 2, www.jofem.org) and consequently, an increase in the GIR to restore the blood glucose to fasting levels (Fig. 4a). The E2-mediated improvement in insulin sensitivity was linked to an enhancement of glucose uptake in LP mice (Fig. 4b). This effect is not sex-dependent since female LP mice showed similar effects on GIR and glucose uptake after E2 stimulation. This effect on insulin sensitivity is a consequence of protein restriction, producing metabolic re-programming in mice, independent of sex. Conflicting results have been found in clinical studies in which insulin action was evaluated in euglycemic-hyperinsulinemic clamp assays in menopausal women under menopausal hormone therapy (MHT) [53]. Pereira et al [54] proposed that the results could be conditioned by the temporal window after the last menses. They observed that E2 increased insulin action in early postmenopausal women but decreased it in late postmenopausal women. This finding suggests that the beneficial effect of E2 on insulin sensitivity depends on the time period since the onset of menopause. In LP male mice, where we can isolate the high and cycling E2 levels, insulin action is increased in the presence of E2, and its effect is produced by a rapid ERα-mediated response.
There is some controversy about the role of ER and the α and β isoforms in muscle. The results in wild-type vs. KO animals or using a nonsteroidal selective ER modulator, such as tamoxifen, suggest that ERβ is the main isoform in skeletal muscle, acting as a repressor of GLUT4 expression. However, ERα is involved in GLUT4 translocation, and its absence in KO animals decreases GLUT4 expression [27, 55]. Our data showed that ERα is responsible for the increased insulin sensitivity (Fig. 5). When LP male mice were treated with a general ER antagonist, the effect of E2 was abolished. When they were treated with an ERα-specific antagonist, MPP, the effect was also prevented. In contrast, E2 increased insulin sensitivity when male mice were treated with PHTTP, an ERβ-specific antagonist. This pharmacological approach allows us to conclude that the effect of E2 on insulin sensitivity occurs in an ERα-mediated manner.
To skip the fact that muscle is the main tissue that regulates glucose uptake under the influence of insulin, we studied the effect of E2 on glucose uptake using the PET/CT scan technique. In the absence of exogenous insulin, E2 increased FDG uptake in muscle (Fig. 7 and Supplementary Fig. 4, www.jofem.org), and this result confirms that there is a direct effect of E2 in glucose homeostasis in LP male mice, independent of the hyperinsulinemic condition of the clamp, where the glucose administered is driven preferentially into skeletal muscle and only the insulin-dependent fraction of glucose uptake is explored [56-59].
This increase in glucose uptake was produced by an augmentation of AKT phosphorylation, which increased the level of GLUT4 at the cellular plasma membrane. This increased phosphorylation was a consequence of the direct interaction of ERα with PI3K.
Studies in human cell lines [38-43] and in silico show that ERα activity could be modulated by different co-regulators, such as SCR3, PRMT1 or PELP1. Our results showed that PELP1 was not expressed in male mouse muscle (data not shown) and that E2 did not influence the activity of the other co-regulators. Both SCR3 and PRMT1 did not show any change compared with the control group, suggesting that neither E2 nor LP diet influenced their quantity (Supplementary Fig. 5, www.jofem.org).
Conclusion
In summary, our results show an acute effect of estradiol on insulin signaling in skeletal muscle in protein-restricted mice. This potentiation in the insulin pathway is mediated by the ERα. The ER directly interacts with PI3K, which increases the phosphorylation of AKT and consequently, glucose uptake in muscle. However, the results suggest that ERs are not involved in the adaptation to the metabolic programming produced by LP in mice. These data could offer a novel approach to develop a new combination of compounds with E2 to increase insulin sensitivity, specifically in muscle.
Acknowledgments
We thank Ms Tatiane Ramos for her technical assistance; PhD. MD. Celsio Dario Ramos and the Department of Nuclear Medicine of Hospital das Clinicas (UNICAMP, Campinas, Brazil) for the [18F]FDG donation; and Ms. Fernanda Moura and Ms. Edna Marina Souza for their excellent PET-CT technical assistance.
Financial Disclosure
This study was supported by grants from the Fundacao de Amparo a Pesquisa do Estado de Sao Paulo (FAPESP 2014/09532-8; 2014/01717-9 and 2015/12611-0).
Conflict of Interest
There is no conflict of interest.
Informed Consent
Not applicable.
Author Contributions
MGA and EMC designed the research. MGA, ELG, NCL and SB performed the research. MGA, ACB and EMC prepared the manuscript. All authors have read and approved the final version of the manuscript submitted for publication. All authors agree to be accountable for all aspects of the work in ensuring that questions related to the accuracy or integrity of any part of the work are appropriately investigated and resolved. All persons designated as authors qualify for authorship, and all those who qualify for authorship are listed.
| References | ▴Top |
- Hales CN, Barker DJ. Type 2 (non-insulin-dependent) diabetes mellitus: the thrifty phenotype hypothesis. Diabetologia. 1992;35(7):595-601.
doi pubmed - Hales CN, Barker DJ. The thrifty phenotype hypothesis. Br Med Bull. 2001;60:5-20.
doi pubmed - Soriano S, Gonzalez A, Marroqui L, Tuduri E, Vieira E, Amaral AG, Batista TM, et al. Reduced insulin secretion in protein malnourished mice is associated with multiple changes in the beta-cell stimulus-secretion coupling. Endocrinology. 2010;151(8):3543-3554.
doi pubmed - Carneiro EM, et al. Low protein diet impairs glucose-induced insulin secretion from and 45Ca uptake by pancreatic rat islets. The Journal of Nutritional Biochemistry. 1995;6(6):314-318.
doi - Rao RH. Chronic undernutrition may accentuate the beta cell dysfunction of type 2 diabetes. Diabetes Res Clin Pract. 1990;8(2):125-130.
doi - Latorraca MQ, Reis MA, Carneiro EM, Mello MA, Velloso LA, Saad MJ, Boschero AC. Protein deficiency and nutritional recovery modulate insulin secretion and the early steps of insulin action in rats. J Nutr. 1998;128(10):1643-1649.
doi pubmed - Reis MA, Carneiro EM, Mello MA, Boschero AC, Saad MJ, Velloso LA. Glucose-induced insulin secretion is impaired and insulin-induced phosphorylation of the insulin receptor and insulin receptor substrate-1 are increased in protein-deficient rats. J Nutr. 1997;127(3):403-410.
doi pubmed - Gavete ML, Martin MA, Alvarez C, Escriva F. Maternal food restriction enhances insulin-induced GLUT-4 translocation and insulin signaling pathway in skeletal muscle from suckling rats. Endocrinology. 2005;146(8):3368-3378.
doi pubmed - Toyoshima Y, Ohne Y, Takahashi SI, Noguchi T, Kato H. Dietary protein deprivation decreases the serine phosphorylation of insulin receptor substrate-1 in rat skeletal muscle. J Mol Endocrinol. 2004;32(2):519-531.
doi pubmed - Hevener AL, Clegg DJ, Mauvais-Jarvis F. Impaired estrogen receptor action in the pathogenesis of the metabolic syndrome. Mol Cell Endocrinol. 2015;418(Pt 3):306-321.
doi pubmed - Mauvais-Jarvis F. Estrogen and androgen receptors: regulators of fuel homeostasis and emerging targets for diabetes and obesity. Trends Endocrinol Metab. 2011;22(1):24-33.
doi pubmed - Heine PA, Taylor JA, Iwamoto GA, Lubahn DB, Cooke PS. Increased adipose tissue in male and female estrogen receptor-alpha knockout mice. Proc Natl Acad Sci U S A. 2000;97(23):12729-12734.
doi pubmed - Manrique C, Lastra G, Habibi J, Mugerfeld I, Garro M, Sowers JR. Loss of estrogen receptor alpha signaling leads to insulin resistance and obesity in young and adult female mice. Cardiorenal Med. 2012;2(3):200-210.
doi pubmed - Cooke PS, Heine PA, Taylor JA, Lubahn DB. The role of estrogen and estrogen receptor-alpha in male adipose tissue. Mol Cell Endocrinol. 2001;178(1-2):147-154.
doi - Alonso-Magdalena P, Ropero AB, Carrera MP, Cederroth CR, Baquie M, Gauthier BR, Nef S, et al. Pancreatic insulin content regulation by the estrogen receptor ER alpha. PLoS One. 2008;3(4):e2069.
doi pubmed - Wong WP, Tiano JP, Liu S, Hewitt SC, Le May C, Dalle S, Katzenellenbogen JA, et al. Extranuclear estrogen receptor-alpha stimulates NeuroD1 binding to the insulin promoter and favors insulin synthesis. Proc Natl Acad Sci U S A. 2010;107(29):13057-13062.
doi pubmed - Soriano S, Alonso-Magdalena P, Garcia-Arevalo M, Novials A, Muhammed SJ, Salehi A, Gustafsson JA, et al. Rapid insulinotropic action of low doses of bisphenol-A on mouse and human islets of Langerhans: role of estrogen receptor beta. PLoS One. 2012;7(2):e31109.
doi pubmed - Bryzgalova G, Gao H, Ahren B, Zierath JR, Galuska D, Steiler TL, Dahlman-Wright K, et al. Evidence that oestrogen receptor-alpha plays an important role in the regulation of glucose homeostasis in mice: insulin sensitivity in the liver. Diabetologia. 2006;49(3):588-597.
doi pubmed - Zhu L, Martinez MN, Emfinger CH, Palmisano BT, Stafford JM. Estrogen signaling prevents diet-induced hepatic insulin resistance in male mice with obesity. Am J Physiol Endocrinol Metab. 2014;306(10):E1188-1197.
doi pubmed - Crandall DL, Busler DE, Novak TJ, Weber RV, Kral JG. Identification of estrogen receptor beta RNA in human breast and abdominal subcutaneous adipose tissue. Biochem Biophys Res Commun. 1998;248(3):523-526.
doi pubmed - Ribas V, Nguyen MT, Henstridge DC, Nguyen AK, Beaven SW, Watt MJ, Hevener AL. Impaired oxidative metabolism and inflammation are associated with insulin resistance in ERalpha-deficient mice. Am J Physiol Endocrinol Metab. 2010;298(2):E304-319.
doi pubmed - Riant E, Waget A, Cogo H, Arnal JF, Burcelin R, Gourdy P. Estrogens protect against high-fat diet-induced insulin resistance and glucose intolerance in mice. Endocrinology. 2009;150(5):2109-2117.
doi pubmed - Barros RP, Gabbi C, Morani A, Warner M, Gustafsson JA. Participation of ERalpha and ERbeta in glucose homeostasis in skeletal muscle and white adipose tissue. Am J Physiol Endocrinol Metab. 2009;297(1):E124-133.
doi pubmed - Foryst-Ludwig A, Clemenz M, Hohmann S, Hartge M, Sprang C, Frost N, Krikov M, et al. Metabolic actions of estrogen receptor beta (ERbeta) are mediated by a negative cross-talk with PPARgamma. PLoS Genet. 2008;4(6):e1000108.
doi pubmed - Rogers NH, Witczak CA, Hirshman MF, Goodyear LJ, Greenberg AS. Estradiol stimulates Akt, AMP-activated protein kinase (AMPK) and TBC1D1/4, but not glucose uptake in rat soleus. Biochem Biophys Res Commun. 2009;382(4):646-650.
doi pubmed - Barros RP, Morani A, Moriscot A, Machado UF. Insulin resistance of pregnancy involves estrogen-induced repression of muscle GLUT4. Mol Cell Endocrinol. 2008;295(1-2):24-31.
doi pubmed - Barros RP, Machado UF, Warner M, Gustafsson JA. Muscle GLUT4 regulation by estrogen receptors ERbeta and ERalpha. Proc Natl Acad Sci U S A. 2006;103(5):1605-1608.
doi pubmed - Livingstone C, Collison M. Sex steroids and insulin resistance. Clin Sci (Lond). 2002;102(2):151-166.
doi - Navarro G, Xu W, Jacobson DA, Wicksteed B, Allard C, Zhang G, De Gendt K, et al. Extranuclear actions of the androgen receptor enhance glucose-stimulated insulin secretion in the male. Cell Metab. 2016;23(5):837-851.
doi pubmed - Coviello AD, Legro RS, Dunaif A. Adolescent girls with polycystic ovary syndrome have an increased risk of the metabolic syndrome associated with increasing androgen levels independent of obesity and insulin resistance. J Clin Endocrinol Metab. 2006;91(2):492-497.
doi pubmed - Diamond MP, Grainger D, Diamond MC, Sherwin RS, Defronzo RA. Effects of methyltestosterone on insulin secretion and sensitivity in women. J Clin Endocrinol Metab. 1998;83(12):4420-4425.
doi pubmed - Batista TM, Ribeiro RA, da Silva PM, Camargo RL, Lollo PC, Boschero AC, Carneiro EM. Taurine supplementation improves liver glucose control in normal protein and malnourished mice fed a high-fat diet. Mol Nutr Food Res. 2013;57(3):423-434.
doi pubmed - Livak KJ, Schmittgen TD. Analysis of relative gene expression data using real-time quantitative PCR and the 2(-Delta Delta C(T)) Method. Methods. 2001;25(4):402-408.
doi pubmed - Li DS, Yuan YH, Tu HJ, Liang QL, Dai LJ. A protocol for islet isolation from mouse pancreas. Nat Protoc. 2009;4(11):1649-1652.
doi pubmed - Alonso-Magdalena P, Morimoto S, Ripoll C, Fuentes E, Nadal A. The estrogenic effect of bisphenol A disrupts pancreatic beta-cell function in vivo and induces insulin resistance. Environ Health Perspect. 2006;114(1):106-112.
doi pubmed - Johnson MD, Kenney N, Stoica A, Hilakivi-Clarke L, Singh B, Chepko G, Clarke R, et al. Cadmium mimics the in vivo effects of estrogen in the uterus and mammary gland. Nat Med. 2003;9(8):1081-1084.
doi pubmed - Lee YR, Park J, Yu HN, Kim JS, Youn HJ, Jung SH. Up-regulation of PI3K/Akt signaling by 17beta-estradiol through activation of estrogen receptor-alpha, but not estrogen receptor-beta, and stimulates cell growth in breast cancer cells. Biochem Biophys Res Commun. 2005;336(4):1221-1226.
doi pubmed - Ali S, Coombes RC. Endocrine-responsive breast cancer and strategies for combating resistance. Nat Rev Cancer. 2002;2(2):101-112.
doi pubmed - Ring A, Dowsett M. Mechanisms of tamoxifen resistance. Endocr Relat Cancer. 2004;11(4):643-658.
doi pubmed - Osborne CK, Bardou V, Hopp TA, Chamness GC, Hilsenbeck SG, Fuqua SA, Wong J, et al. Role of the estrogen receptor coactivator AIB1 (SRC-3) and HER-2/neu in tamoxifen resistance in breast cancer. J Natl Cancer Inst. 2003;95(5):353-361.
doi pubmed - Le Romancer M, Treilleux I, Leconte N, Robin-Lespinasse Y, Sentis S, Bouchekioua-Bouzaghou K, Goddard S, et al. Regulation of estrogen rapid signaling through arginine methylation by PRMT1. Mol Cell. 2008;31(2):212-221.
doi pubmed - Gururaj AE, Rayala SK, Vadlamudi RK, Kumar R. Novel mechanisms of resistance to endocrine therapy: genomic and nongenomic considerations. Clin Cancer Res. 2006;12(3 Pt 2):1001s-1007s.
doi pubmed - Musgrove EA, Sutherland RL. Biological determinants of endocrine resistance in breast cancer. Nat Rev Cancer. 2009;9(9):631-643.
doi pubmed - Antonio L, Wu FC, O'Neill TW, Pye SR, Carter EL, Finn JD, Rutter MK, et al. Associations between sex steroids and the development of metabolic syndrome: a longitudinal study in European men. J Clin Endocrinol Metab. 2015;100(4):1396-1404.
doi pubmed - Pitteloud N, Mootha VK, Dwyer AA, Hardin M, Lee H, Eriksson KF, Tripathy D, et al. Relationship between testosterone levels, insulin sensitivity, and mitochondrial function in men. Diabetes Care. 2005;28(7):1636-1642.
doi pubmed - Lanfranco F, Zitzmann M, Simoni M, Nieschlag E. Serum adiponectin levels in hypogonadal males: influence of testosterone replacement therapy. Clin Endocrinol (Oxf). 2004;60(4):500-507.
doi pubmed - Nishizawa H, Shimomura I, Kishida K, Maeda N, Kuriyama H, Nagaretani H, Matsuda M, et al. Androgens decrease plasma adiponectin, an insulin-sensitizing adipocyte-derived protein. Diabetes. 2002;51(9):2734-2741.
doi pubmed - Fan W, Yanase T, Nomura M, Okabe T, Goto K, Sato T, Kawano H, et al. Androgen receptor null male mice develop late-onset obesity caused by decreased energy expenditure and lipolytic activity but show normal insulin sensitivity with high adiponectin secretion. Diabetes. 2005;54(4):1000-1008.
doi pubmed - Moverare-Skrtic S, Venken K, Andersson N, Lindberg MK, Svensson J, Swanson C, Vanderschueren D, et al. Dihydrotestosterone treatment results in obesity and altered lipid metabolism in orchidectomized mice. Obesity (Silver Spring). 2006;14(4):662-672.
doi pubmed - Musatov S, Chen W, Pfaff DW, Mobbs CV, Yang XJ, Clegg DJ, Kaplitt MG, et al. Silencing of estrogen receptor alpha in the ventromedial nucleus of hypothalamus leads to metabolic syndrome. Proc Natl Acad Sci U S A. 2007;104(7):2501-2506.
doi pubmed - Campbell SE, Febbraio MA. Effect of the ovarian hormones on GLUT4 expression and contraction-stimulated glucose uptake. Am J Physiol Endocrinol Metab. 2002;282(5):E1139-1146.
doi pubmed - Carr MC. The emergence of the metabolic syndrome with menopause. J Clin Endocrinol Metab. 2003;88(6):2404-2411.
doi pubmed - Mauvais-Jarvis F, Manson JE, Stevenson JC, Fonseca VA. Menopausal hormone therapy and type 2 diabetes prevention: evidence, mechanisms, and clinical implications. Endocr Rev. 2017;38(3):173-188.
doi pubmed - Pereira RI, Casey BA, Swibas TA, Erickson CB, Wolfe P, Van Pelt RE. Timing of estradiol treatment after menopause may determine benefit or harm to insulin action. J Clin Endocrinol Metab. 2015;100(12):4456-4462.
doi pubmed - Barros RP, Machado UF, Gustafsson JA. Estrogen receptors: new players in diabetes mellitus. Trends Mol Med. 2006;12(9):425-431.
doi pubmed - Kim JK, Michael MD, Previs SF, Peroni OD, Mauvais-Jarvis F, Neschen S, Kahn BB, et al. Redistribution of substrates to adipose tissue promotes obesity in mice with selective insulin resistance in muscle. J Clin Invest. 2000;105(12):1791-1797.
doi pubmed - Mauvais-Jarvis F. Novel link between inflammation, endothelial dysfunction, and muscle insulin resistance. Diabetes. 2013;62(3):688-690.
doi pubmed - Mauvais-Jarvis F, Kulkarni RN, Kahn CR. Knockout models are useful tools to dissect the pathophysiology and genetics of insulin resistance. Clin Endocrinol (Oxf). 2002;57(1):1-9.
doi pubmed - Mauvais-Jarvis F, Virkamaki A, Michael MD, Winnay JN, Zisman A, Kulkarni RN, Kahn CR. A model to explore the interaction between muscle insulin resistance and beta-cell dysfunction in the development of type 2 diabetes. Diabetes. 2000;49(12):2126-2134.
doi pubmed
This article is distributed under the terms of the Creative Commons Attribution Non-Commercial 4.0 International License, which permits unrestricted non-commercial use, distribution, and reproduction in any medium, provided the original work is properly cited.
Journal of Endocrinology and Metabolism is published by Elmer Press Inc.