Figures
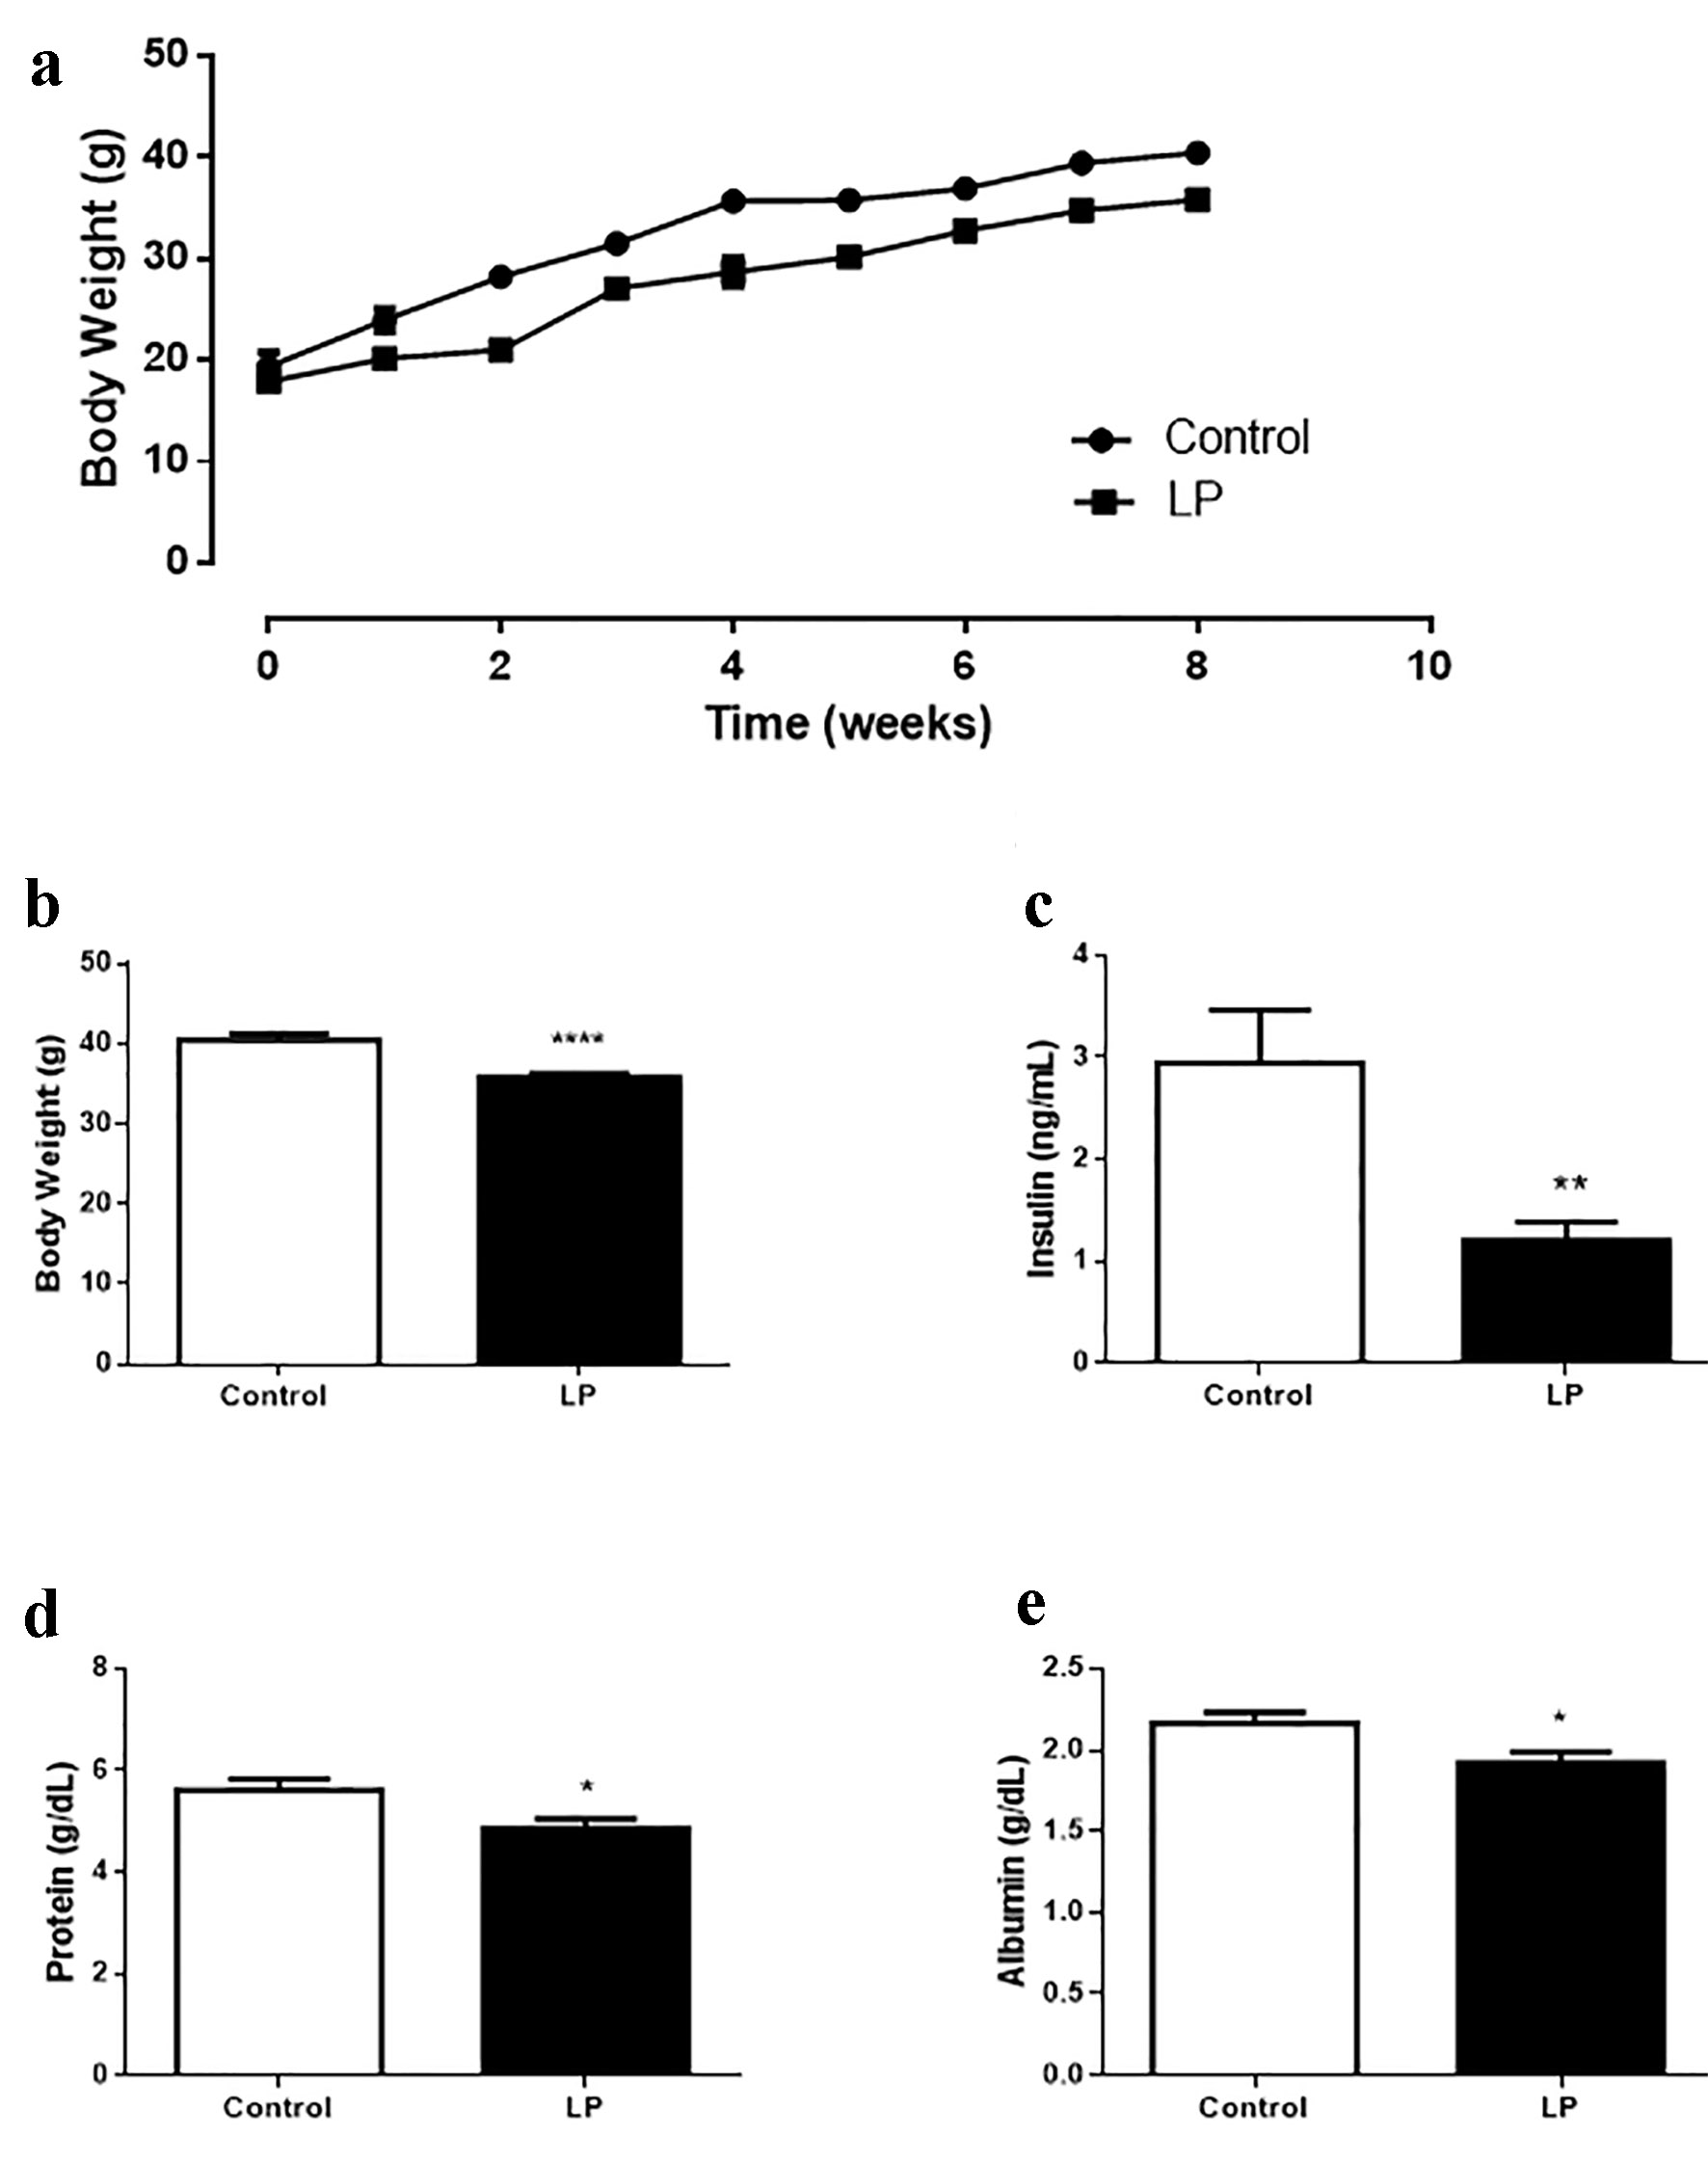
Figure 1. Malnourishment male mouse model characterization. (a) Body weight evolution during 8 weeks of diet treatment. (b) Body weight after 8 weeks of low-protein (6%) diet treatment. (c) Insulin plasma levels. (d) Protein plasma levels. (e) Albumin plasma levels. Data are expressed as the mean ± SEM (n = 12 - 16 animals/group). t-test: *P < 0.05 compared with control group; **P < 0.01 compared with control group. LP: low protein; SEM: standard error of the mean.
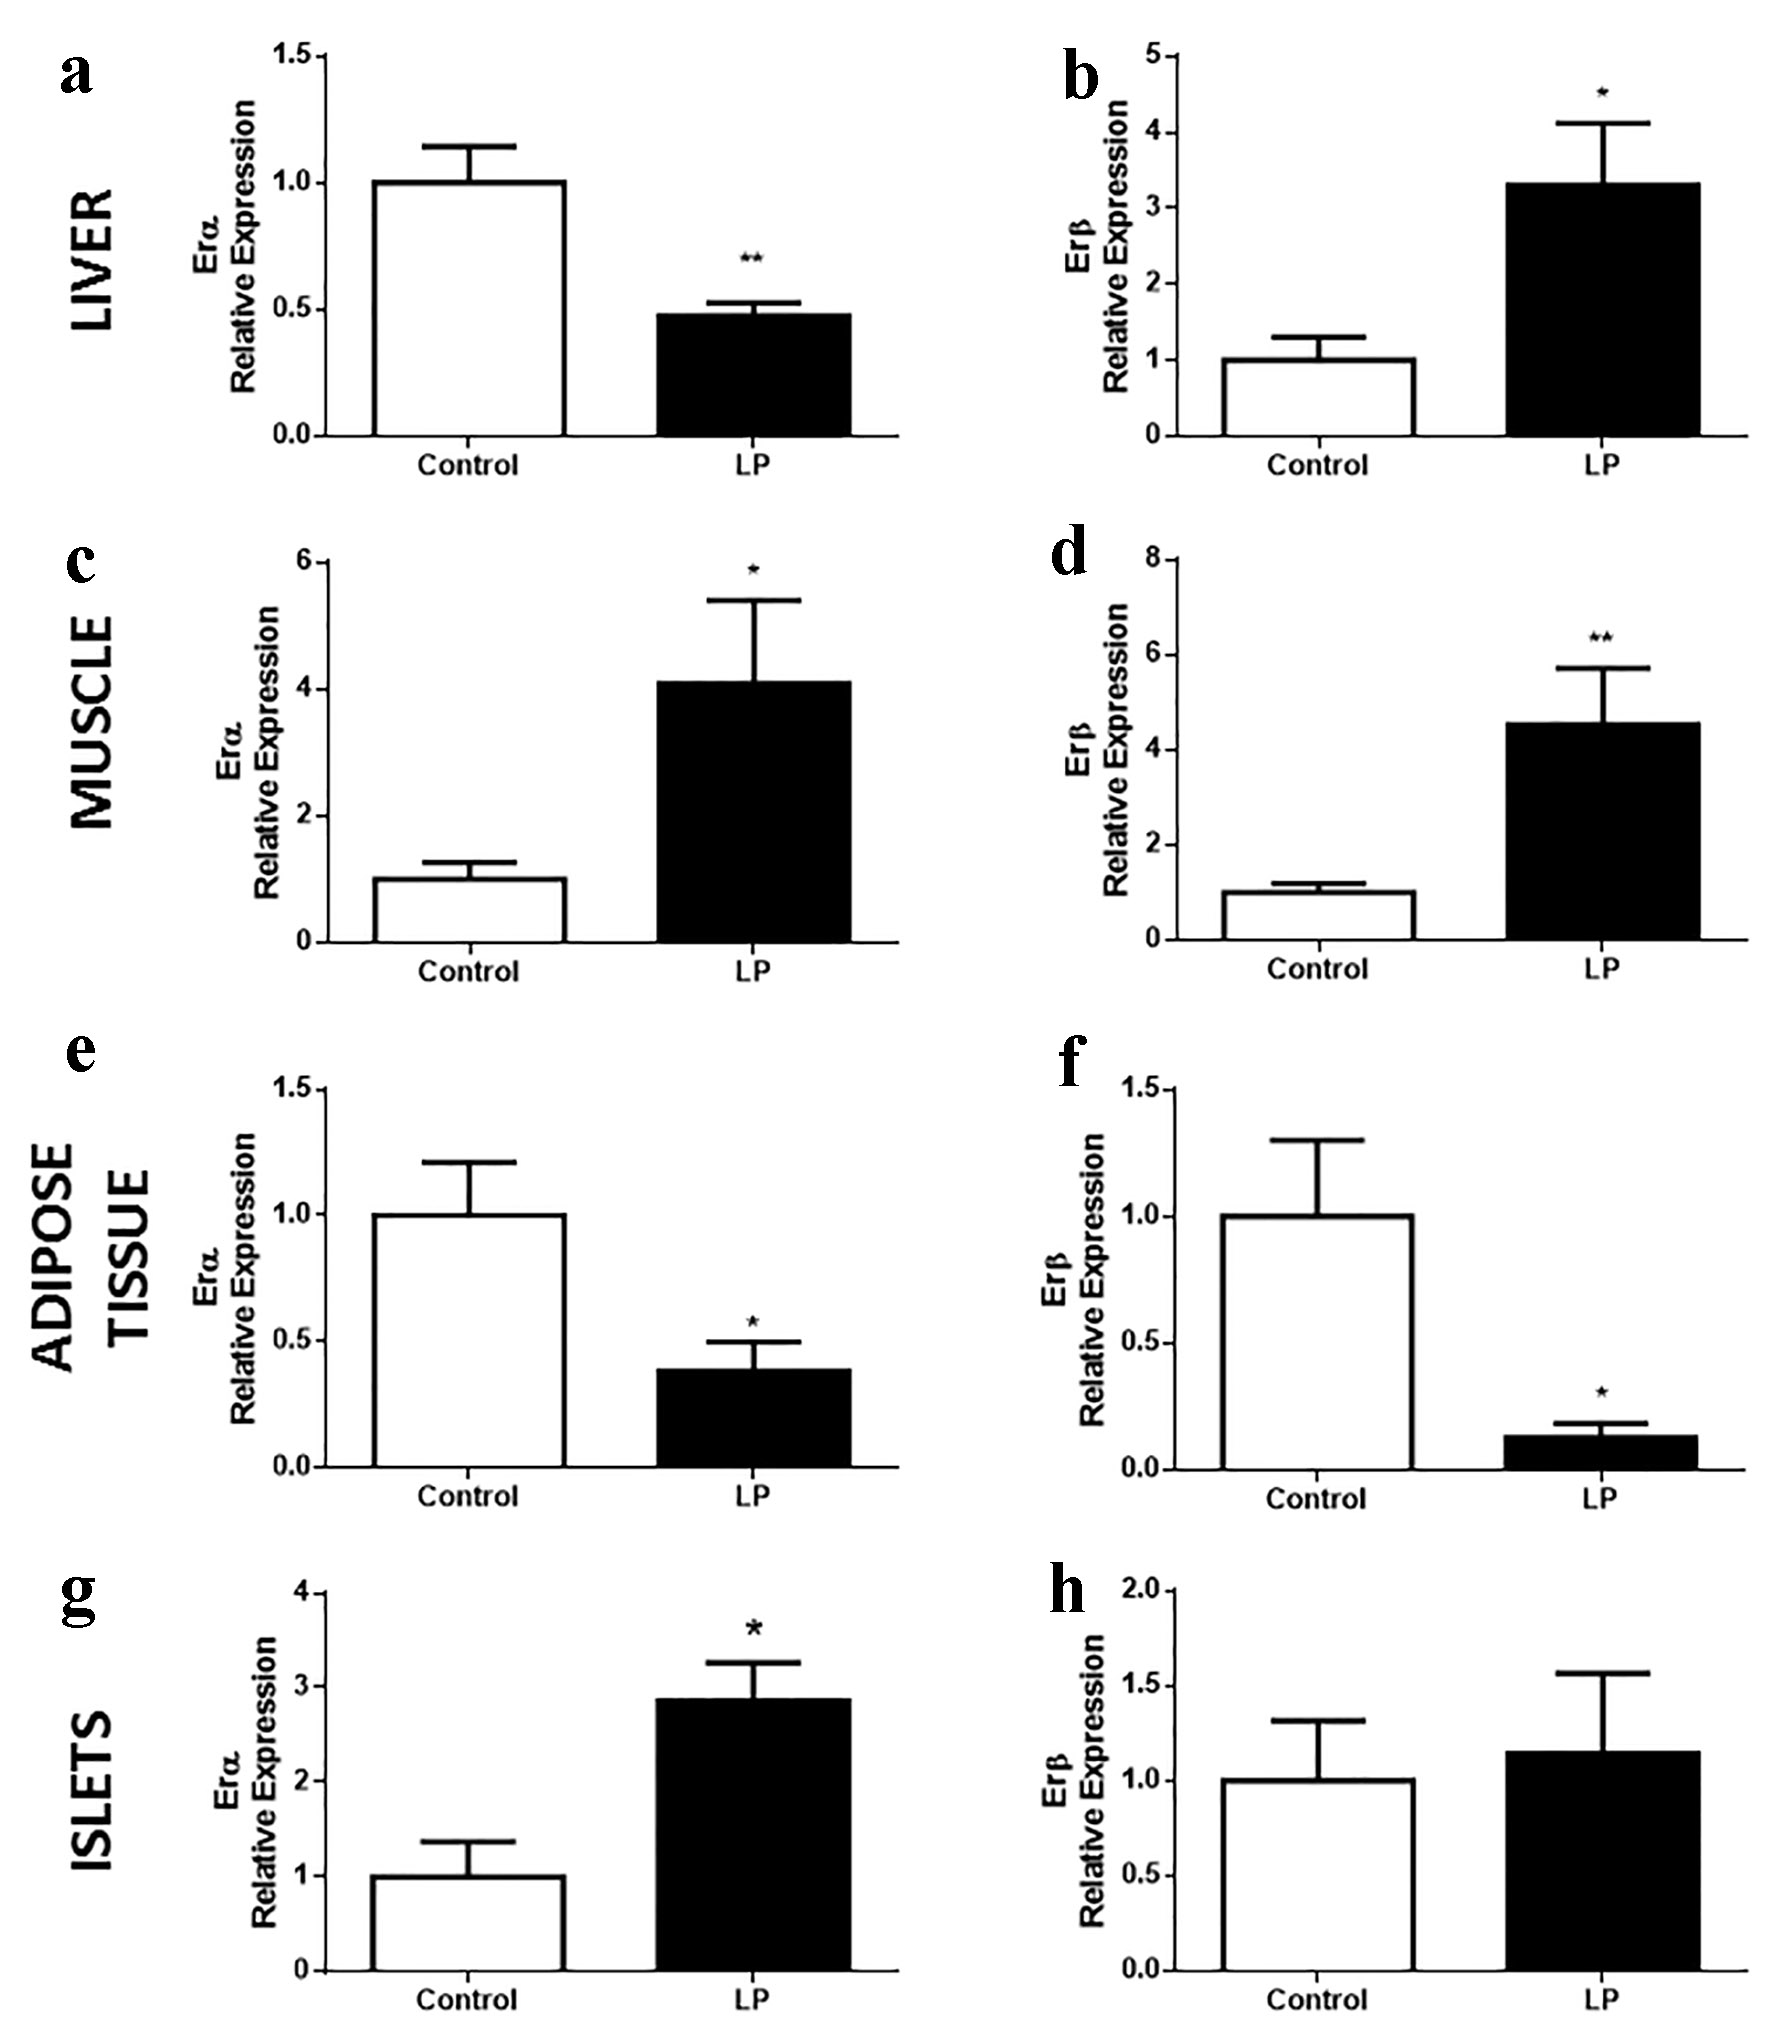
Figure 2. ER gene expression in islets of Langerhans and peripheral tissues implicated in glucose homeostasis in Swiss mice fed an LP diet (6%) for 8 weeks. (a, b) ERα and β relative expression, respectively, in the liver (n = 7 - 10 mice/treatment), (c, d) in the gastrocnemius muscle (n = 9 - 10 mice/treatment), (e, f) in adipose tissue (n = 7 - 12 mice/treatment), (g, h) in the islets of Langerhans (n = 4 mice/treatment). Data are expressed as the mean ± SEM. t-test: *P < 0.05 compared with control group; **P < 0.01 compared with control group. ER: estrogen receptor; LP: low protein; SEM: standard error of the mean.
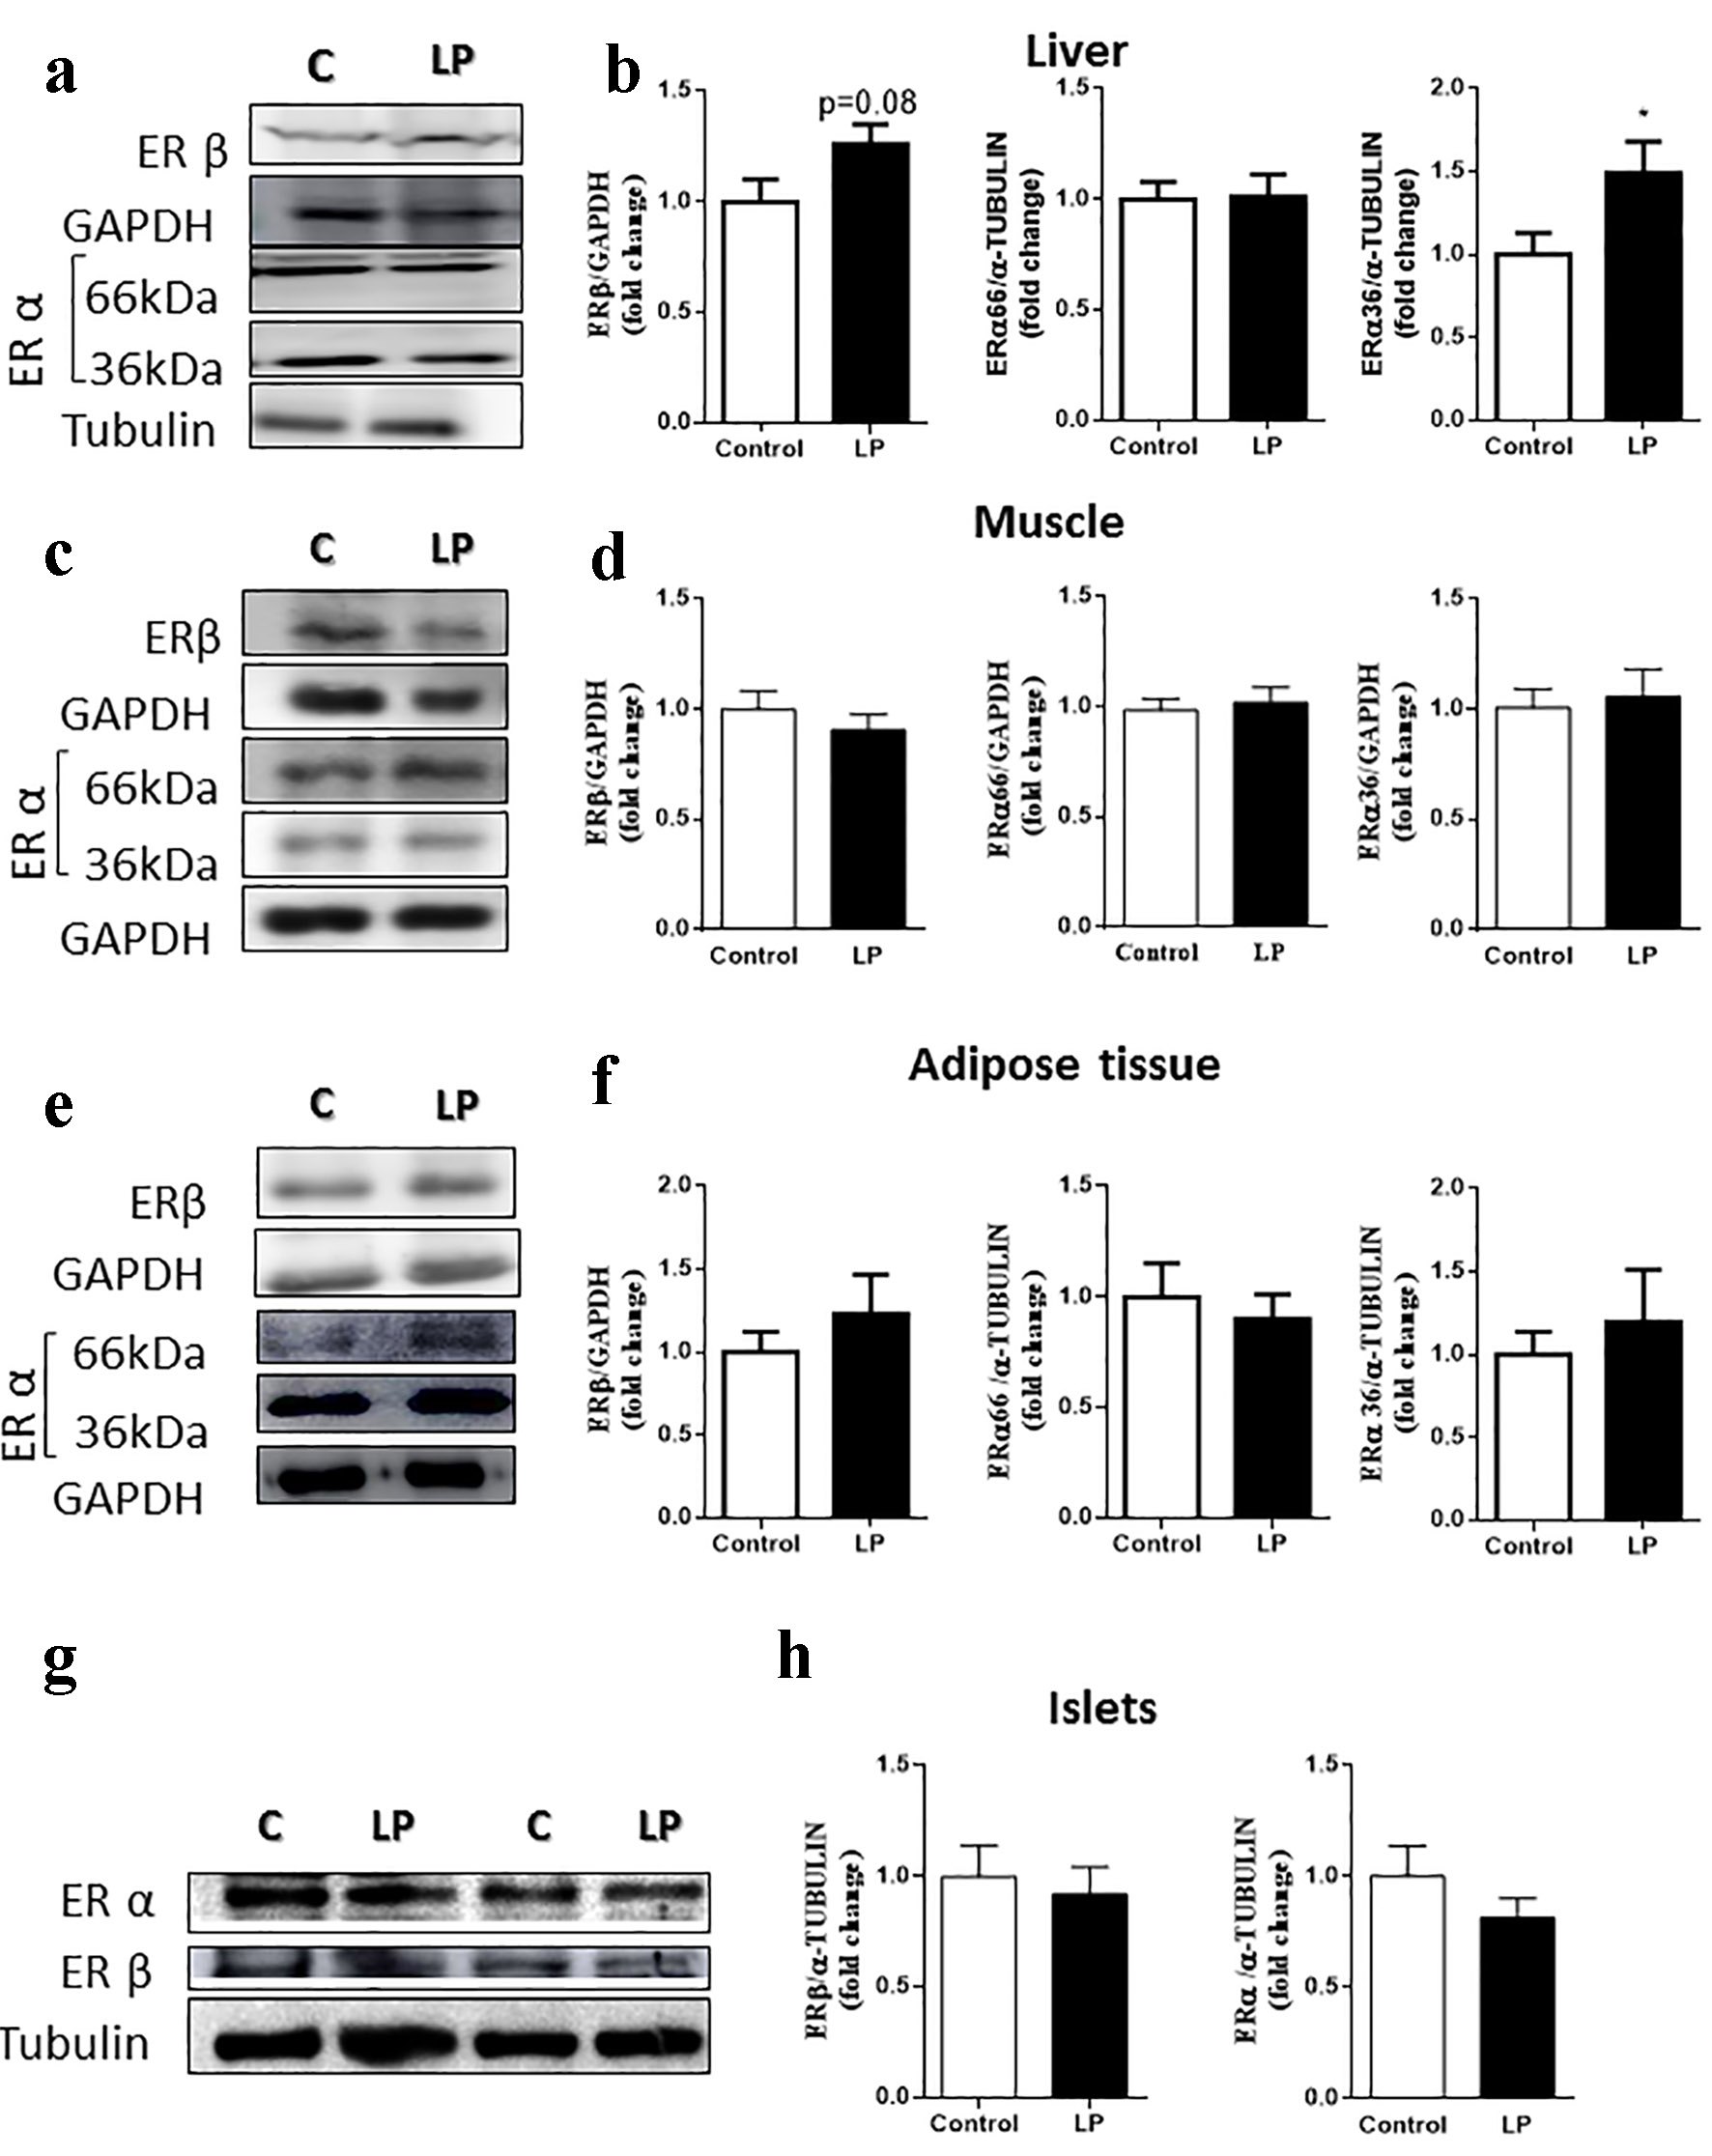
Figure 3. ER protein levels in male mice fed an LP diet (6%) for 8 weeks. (a) Representative immunoblots of ER protein in the liver. (b) Quantification of ERβ, ERα66 and ERα36 isoforms by densitometry of the band (n = 7 - 10 mice/treatment). (c) Representative immunoblots of ER protein in the muscle. (d) Quantification of ERβ, ERα66 and ERα36 isoforms by densitometry of the band (n = 13 mice/treatment). (e) Representative immunoblots of ER protein in adipose tissue. (f) Quantification of ERβ, ERα66 and ERα36 isoforms by densitometry of the band (n = 6 - 8 mice/treatment). (g) Representative immunoblots of ER protein in the islets. (h) Quantification of ERβ and ERα66 isoforms by densitometry of the band (n = 6 - 7 mice/treatment). Data are expressed as the mean ± SEM. t-test: *P < 0.05 compared with the control group. ER: estrogen receptor; LP: low protein; SEM: standard error of the mean.
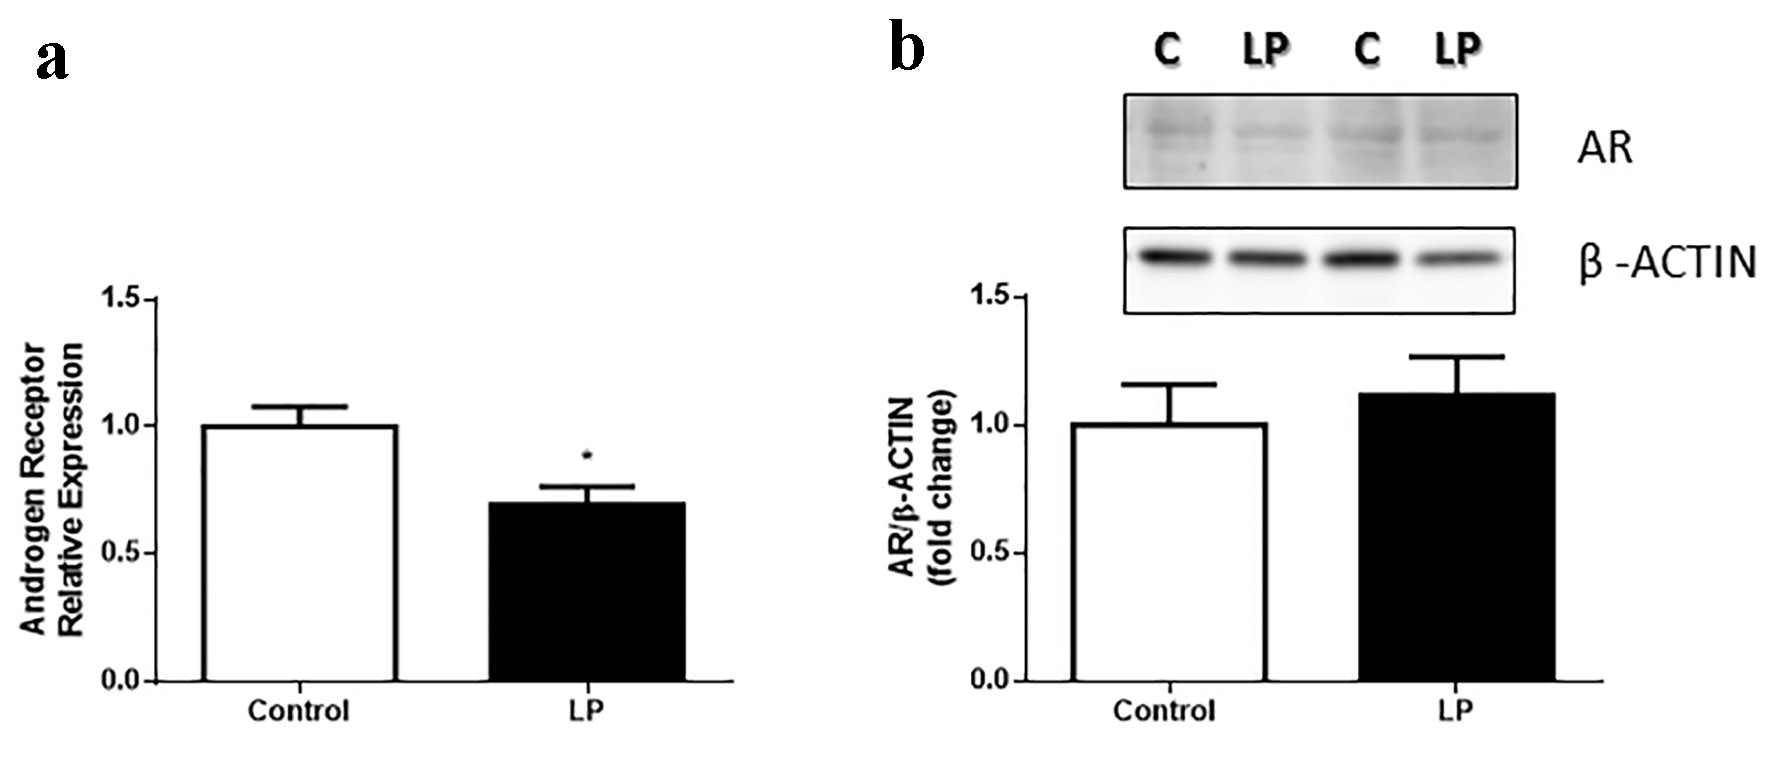
Figure 4. AR gene expression in gastrocnemius muscle in Swiss male mice fed an LP diet (6%) for 8 weeks. (a) AR relative expression gastrocnemius muscle (n = 7 - 8 mice/treatment). (b) Quantification of AR protein content in the gastrocnemius muscle and representative bands (n = 11 - 13 mice/treatment). Data are expressed as the mean ± SEM. t-test: *P < 0.05 compared with the control group. AR: androgen receptor; LP: low protein; SEM: standard error of the mean.
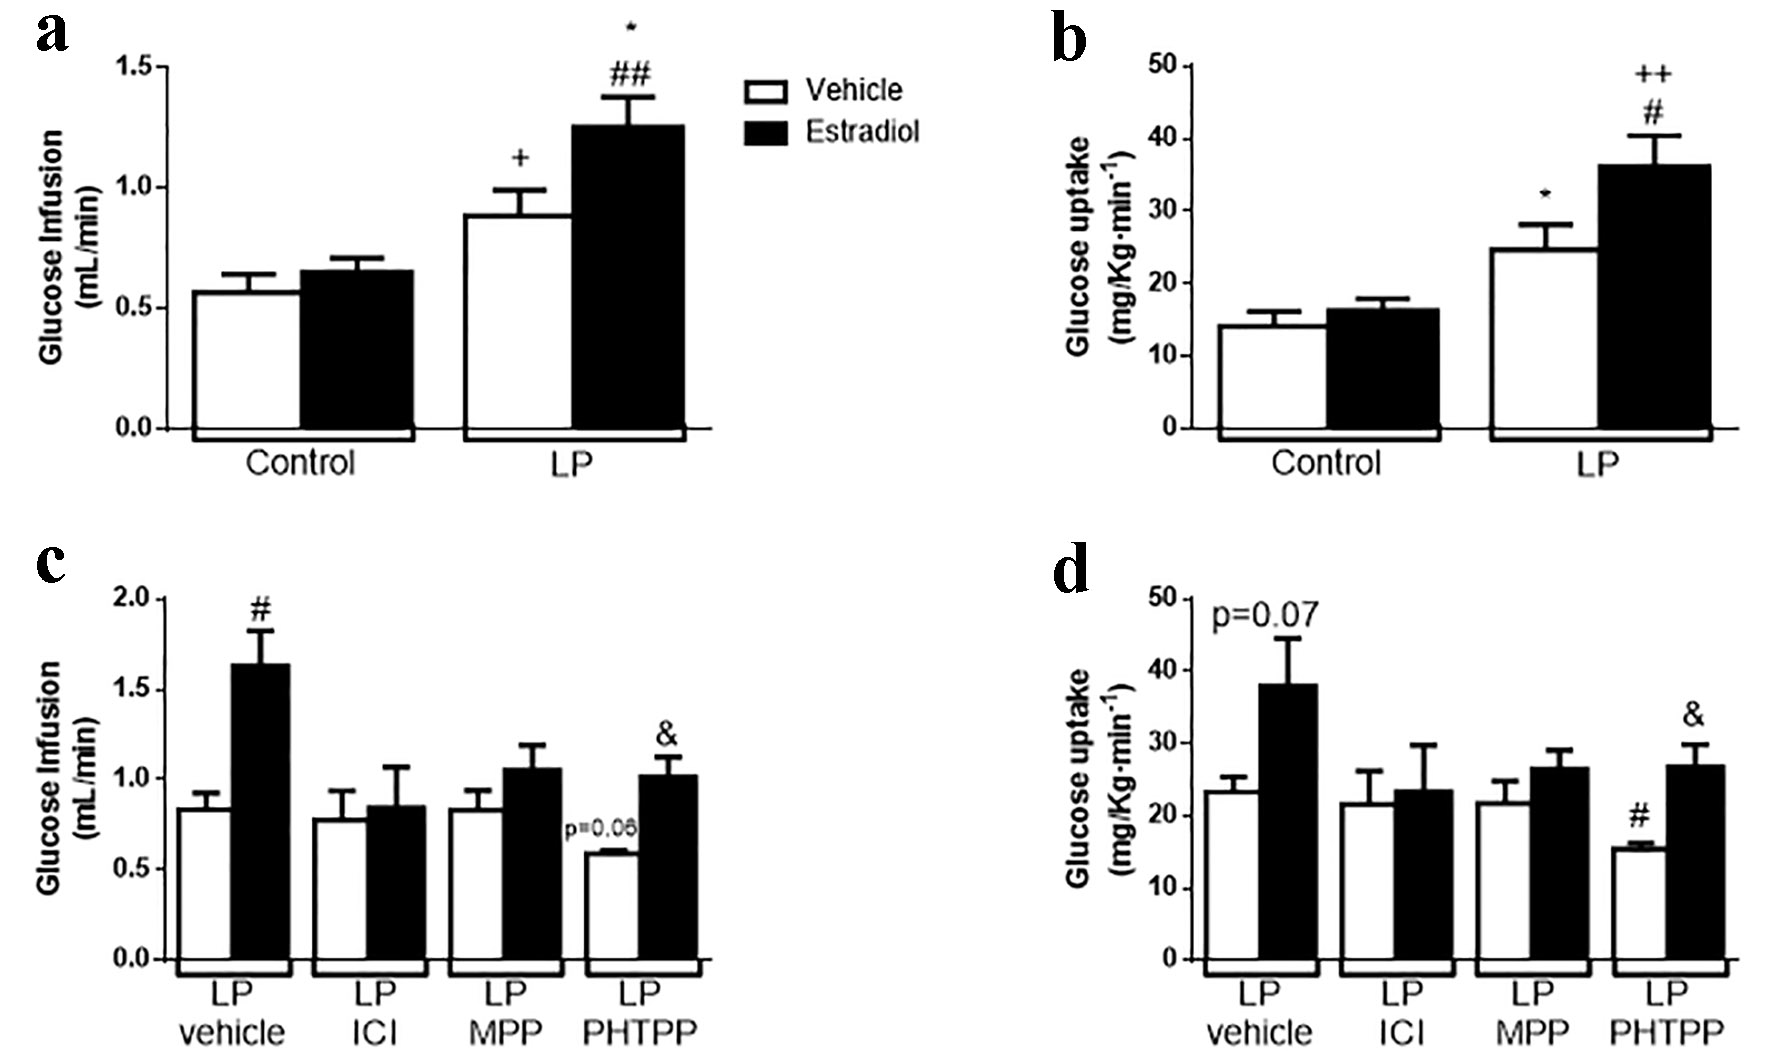
Figure 5. Effect of the natural hormone estradiol on insulin sensitivity by euglycemic-hyperinsulinemic clamp on malnourished male mice. (a) Glucose infusion rate (GIR) during clamp (n = 4 - 5 mice/group). (b) Glucose uptake during clamp (n = 5 mice/group). (c) GIR on animals treated with 500 µg/kg body weight of ER antagonists (ICI, general ER antagonist; MPP, ERα antagonist; PHTTP, ERβ antagonist) for 4 days (n = 3 - 4 mice/group). (d) Glucose uptake on the same animals in (c). In white, animals stimulated with glucose + vehicle; in black, same animals stimulated in a normoglycemic state with 10 µg/kg body weight of estradiol. Data are expressed as the mean ± SEM. t-test: *P < 0.05 vs. control-vehicle; #P < 0.05 vs. LP-vehicle; ++P < 0.01 vs. control + E2; &P < 0.05 vs. LPPHTTP-vehicle. GIR: glucose infusion rate; ER: estrogen receptor; LP: low protein; SEM: standard error of the mean.
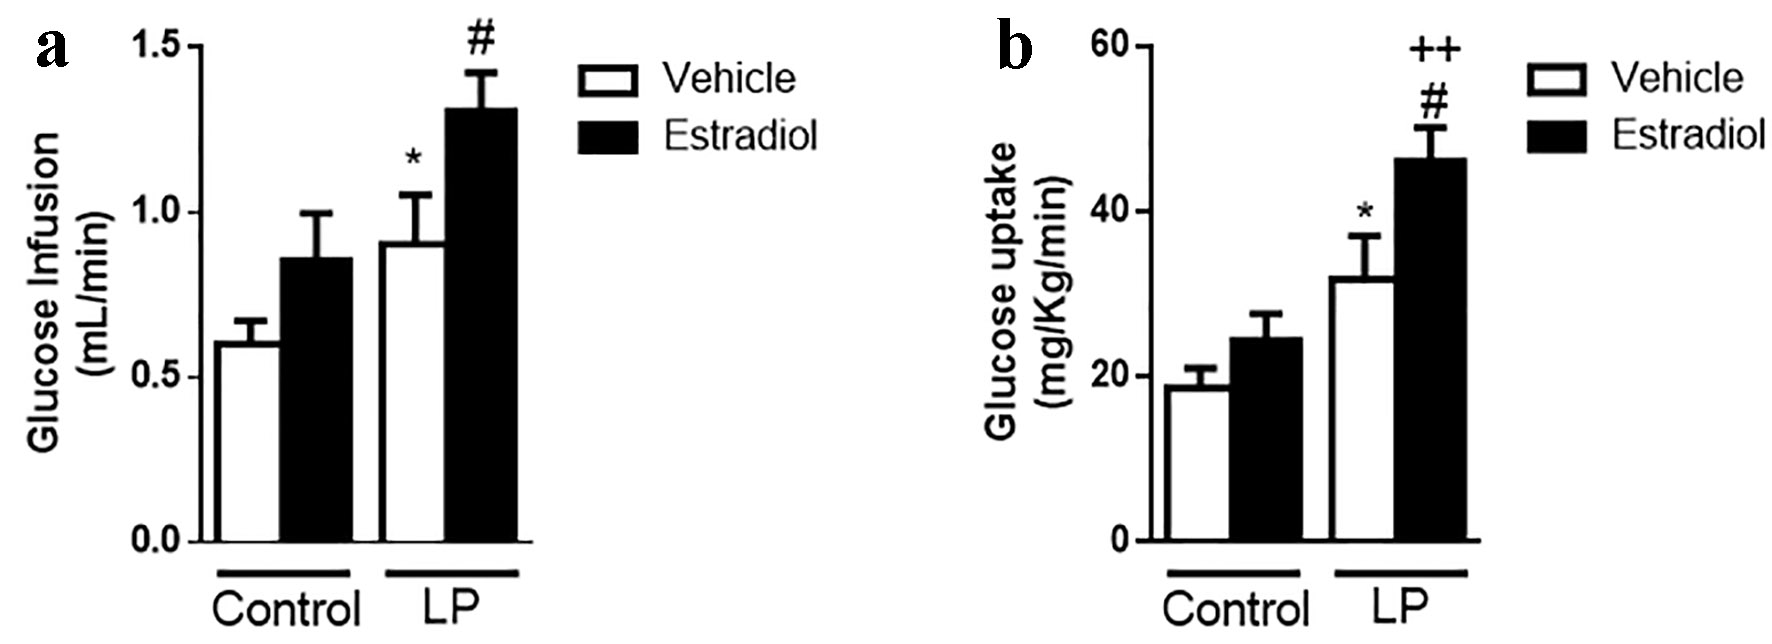
Figure 6. Effect of E2 on insulin sensitivity by euglycemic-hyperinsulinemic clamp in female malnourished mice. (a) GIR during clamp (n = 5 - 6 mice/group). (b) Glucose uptake during clamp (n = 5 - 6 mice/group). In white, animals stimulated with glucose + vehicle; in black, the same animals stimulated in a normoglycemic state with 10 µg/kg body weight of estradiol. Data are expressed as the mean ± SEM. t-test: *P < 0.05 vs. control; #P < 0.05 vs. LP; ++P < 0.01 vs. control + E2. GIR: glucose infusion rate; LP: low protein; SEM: standard error of the mean.
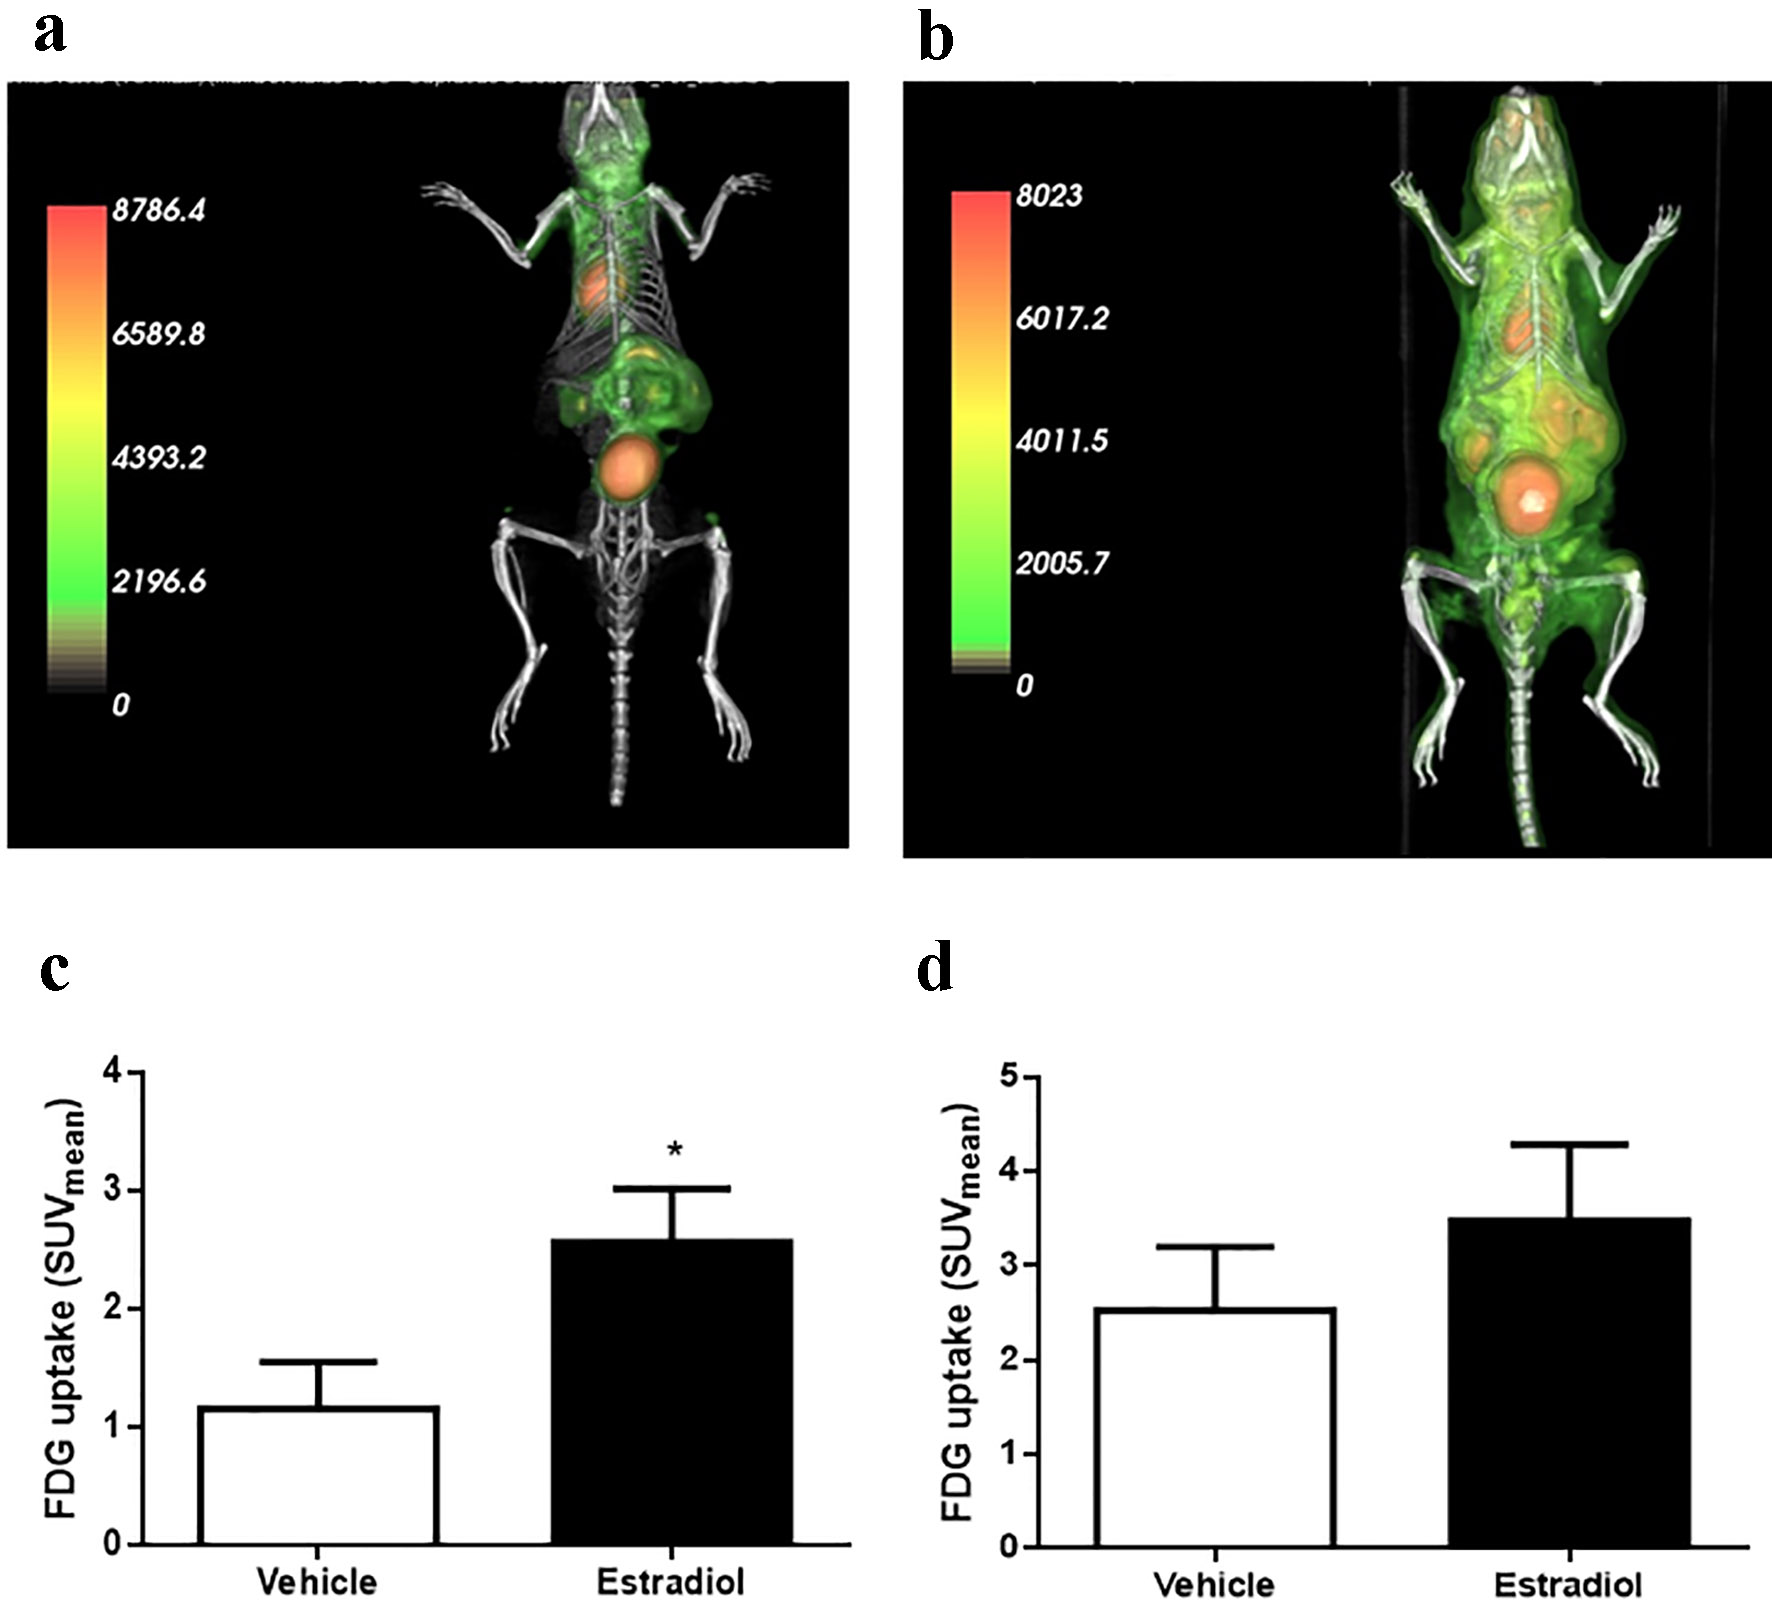
Figure 7. Glucose (FDG) uptake by microPET/CT and gamma counter. (a) Representative image of PET/CT scan in animals stimulated with vehicle or (b) 10 µg/kg body weight of estradiol. (c) Glucose uptake by the muscle and (d) liver (n = 6 - 7 animals/group). Data are expressed as the mean ± SEM. t-test compared with vehicle group. t-test: *P < 0.05 compared with vehicle group. PET/CT: positron emission tomography/computed tomography; SEM: standard error of the mean.
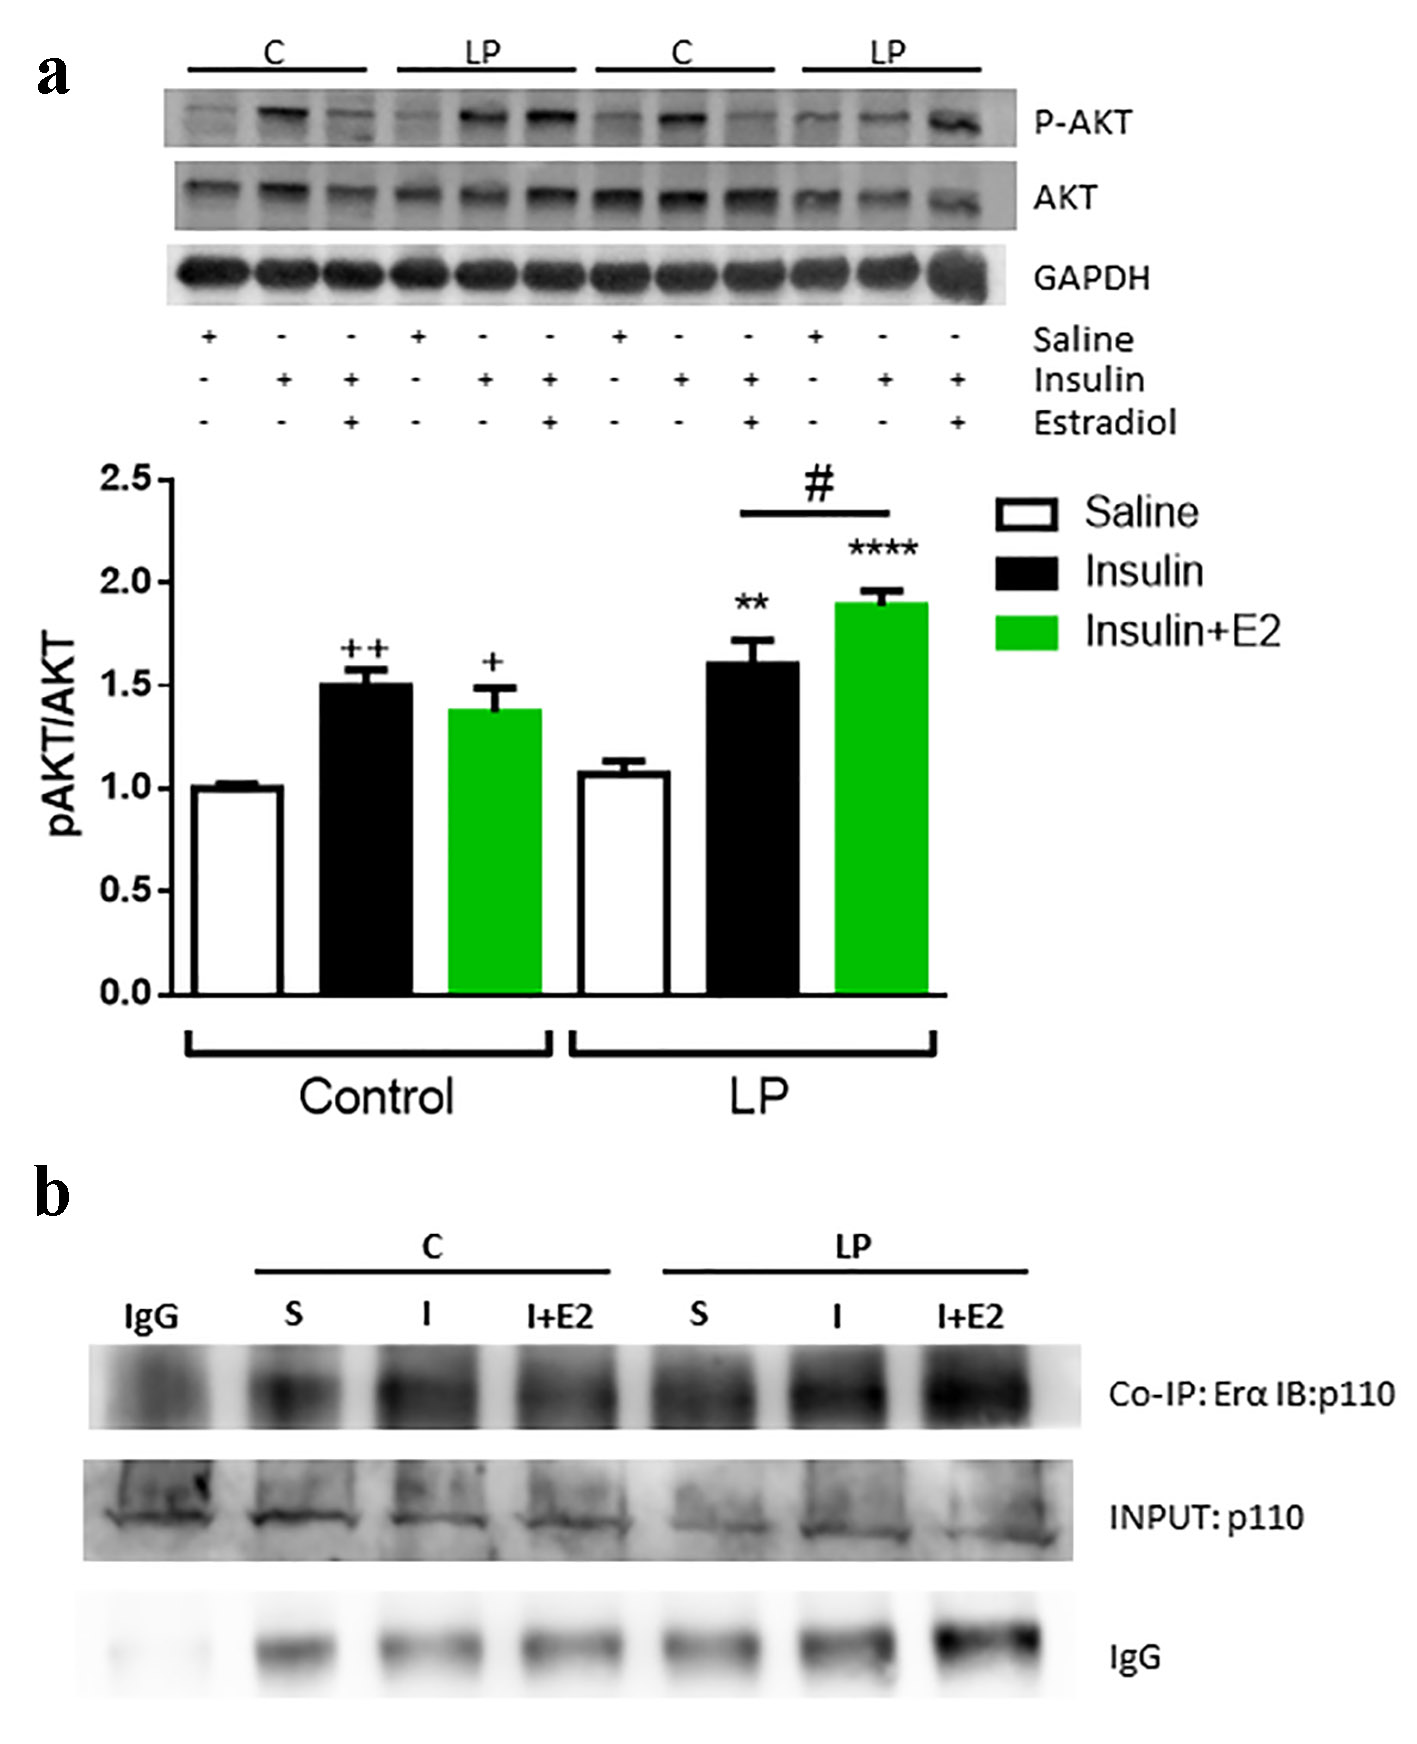
Figure 8. Insulin stimulation with or without E2 in protein restricted male mice in the muscle. (a) Representative Western blotting protein bands and the relative quantification of AKT phosphorylation in muscle. Data are expressed as the mean ± SEM (n = 4 - 6 animals/group). One-way ANOVA: **P < 0.01 and ***P < 0.001 compared with LP vehicle group; ++P < 0.01 and +++P < 0.001 compared with control vehicle group; #P < 0.05 compare LP insulin vs. LP insulin + E2 group by t-test. (b) Representative Western blotting protein bands from the co-immunoprecipitation of the ERα and immunoblotting of PI3K, p110 subunit. Samples were prepared with 2 µg of antibody and 1 µg of IgG as a negative control. SEM: standard error of the mean; ANOVA: analysis of variance; LP: low protein; ER: estrogen receptor; PI3K: phosphatidylinositol 3-kinase.
Table
Table 1. Steroids Hormone Plasma Levels in Control and Protein Restriction Mice
| Control | LP |
|---|
| Data are expressed as mean ± SEM (estradiol (n = 12 - 14 animals/treatment) and testosterone (n = 16 animals/treatment)). Significance by t-test: *P = 0.048; **P = 0.0067. LP: low protein; SEM: standard error of the mean. |
| Estradiol (pg/mL) | 0.36 ± 0.08 | 0.62 ± 0.09* |
| Testosterone (ng/mL) | 15.36 ± 3.44 | 4.67 ± 1.28** |