

| Journal of Endocrinology and Metabolism, ISSN 1923-2861 print, 1923-287X online, Open Access |
| Article copyright, the authors; Journal compilation copyright, J Endocrinol Metab and Elmer Press Inc |
| Journal website https://www.jofem.org |
Original Article
Volume 14, Number 1, February 2024, pages 21-32

Association of Metabolic Syndrome With Serum Uric Acid Level in Male Workers
Sook Hee Sunga, Ji Young Moona, Seung Jin Choia, b
aHealth and Medical Section, Radiation Health Institute, Korea Hydro and Nuclear Power Co., Ltd, Seoul 04505, Korea
bCorresponding Author: Seung Jin Choi, Health and Medical Section, Radiation Health Institute, Korea Hydro and Nuclear Power Co., Ltd, Seoul 04505, Korea
Manuscript submitted November 22, 2023, accepted December 22, 2023, published online January 10, 2024
Short title: Uric Acid and Metabolic Syndrome
doi: https://doi.org/10.14740/jem927
| Abstract | ▴Top |
Background: Metabolic syndrome (MetS) is a type of the inflammatory diseases that is a known risk factor for many conditions, including type 2 diabetes mellitus (DM) and cardiovascular disease (CVD). Preventing or managing of MetS involves biomarkers for early identification or predicting the risk of developing the condition. The association between serum uric acid (SUA) and MetS in a large population of Korean male workers was investigated.
Methods: We conducted a cross-sectional study of 9,191 male workers who comprised 6,626 daytime workers (DW) and 2,565 shift workers (SW) aged 20 - 58 years who had undergone regular health check-up in 2021. Body mass index (BMI), waist circumference (WC), blood pressure (BP), white blood cell count (WBC), biochemical parameters including SUA, liver enzymes, lipid profile and serum creatinine (Cr) were measured and participants responded to a questionnaire on health-related behavior. Participants were placed in quartiles based on their SUA levels. Associations between SUA and the prevalence of MetS or metabolic components (MS) were explored using multiple logistic regression analysis.
Results: The overall prevalence of MetS was 24.6%, and the prevalence of MetS in DW was significantly higher than in SW (25.8% vs. 21.7%, P = 0.001). The prevalence of MetS, number of MS, and number of SW were positively correlated with SUA levels, as were all other variables except age, high-density lipoprotein cholesterol (HDL-C) and prevalence of DM, which were negatively correlated with SUA levels. After adjusting for multiple potential confounders, the odds ratio (OR) for MetS of the highest SUA quartile compared to the reference was 1.86 (95% confidence interval (CI): 1.60 - 2.15); however, after adjusting for BMI, it was 1.32 (95% CI: 1.12 - 1.54). The SUA level was also associated with high BP, high fasting plasma glucose (FPG) and hypertriglyceridemia after full adjustment. Notably, hypertriglyceridemia was also associated with a high-normal SUA level.
Conclusions: SUA levels may be independent predictors of MetS in Korean male workers. Hypertriglyceridemia is closely associated with SUA levels.
Keywords: Uric acid; Metabolic syndrome; Inflammation; Odds ratio; Worker; Hypertriglyceridemia
| Introduction | ▴Top |
Increasing prevalence of metabolic syndrome (MetS) is an important public health problem. In Korea, the prevalence of MetS was 21.3% (men: 24.1%, women: 18.4%) in 2021, higher than that in 2020 (20.6%; men: 23.0%, women: 18.0%); prevalence also increased according to age (20s to 50s) [1, 2]. MetS involves high blood pressure (BP), hyperglycemia, high triglyceride (TG), low high-density lipoprotein cholesterol (HDL-C) and abdominal obesity. MetS as a risk factor of cardiovascular disease (CVD) is related to increased CV morbidity and mortality and its association with type 2 diabetes mellitus (DM), fatty liver, and some cancers was studied [3-6]. Early identification of MetS is crucial for its management, and identifying at-risk patients is important for its prevention; both goals require an understanding of the role of associated risk factors. Hence, a novel biomarker would be useful for predicting the development of and identifying MetS.
Several studies have investigated the relationship between MetS and its risk factors, with serum uric acid (SUA) levels being the most clearly related to MetS [7]. Elevated SUA levels are associated with CVD, chronic kidney disease, diabetes, obesity, and dyslipidemia [8-13]. MetS is characterized by high burden of inflammation [14]. On the other hand, SUA is considered as a marker of inflammation in metabolic and chronic conditions such as type 2 DM, hypertension, liver steatosis, thyroiditis, new onset diabetes, and diabetic kidney disease [15-20]. Insulin resistance (IR) may contribute to hyperuricemia as a causal factor in MetS [7], although the pathogenic role of UA in the development of MetS remains unclear. Nonetheless, epidemiological studies have shown that hyperuricemia is a predictor of MetS development [21, 22].
The association of MetS prevalence with metabolic components (MS) and SUA levels has been studied in various populations [10-13, 21, 22]. In workers, the working environment and lifestyle factors may affect the association between SUA levels and MetS [23, 24]. Herein, we investigated the association between SUA levels, MetS, MS, and multiple potential confounding factors in Korean male workers.
| Materials and Methods | ▴Top |
Subjects
Workers consisted of 10,796 subjects aged 20 to 58 years who underwent annual health check-ups in 2021. From this population, 49 workers who missed survey or examination, 1,482 female workers, and 74 workers who were taking agents to lower serum UA were excluded. Overall, 9,191 men were enrolled in the study. The number of daytime workers (DW) and shift workers (SW) was 6,626 and 2,565 (two shifts: 170, three shifts: 2,395), respectively. This research was approved by Institution Review Board of Seoul National University Bundang Hospital, Korea (B-1703-385-003). This study was conducted in compliance with the ethical standards of the responsible institution on human subjects as well as with the Helsinki Declaration. Written informed consent was obtained from each subject.
Measurements
Participants fasted for at least 8 h before the examination. Anthropometry was performed using standard methods. Body mass index (BMI) was defined as body weight (BW) divided by height squared (kg/m2). Systolic and diastolic BP were measured using standard technique. Waist circumference (WC) was measured according to standards by skilled professionals. Blood sampling was performed from antecubital vein. We measured white blood cell count (WBC) and liver enzymes including gamma-glutamyl transpeptidase (GGT), alanine aminotransferase (ALT), and aspartate aminotransferase (AST). Fasting plasma glucose (FPG), serum creatinine (Cr) and lipid profiles including HDL-C, TG, total cholesterol (T-Chol) and low-density lipoprotein cholesterol (LDL-C) were measured. SUA level was measured using enzymatic colorimetric method. A questionnaire on health-related behaviors was administered to all participants. Among behavioral risk factors, smoking status consisted of current smokers, former smokers and non-smokers. Alcohol consumption was classified as drinker (more than once a week) and no drinker. We defined exercise as “above recommended physical activity (PA)” if the individual participated in moderately intense aerobic PA for 5 days a week, at least 30 min; vigorously intense activity for 3 days a week, at least 20 min; or walking for 30 min every day. Others were considered “below recommended PA”.
Definition of MetS
We applied the criteria for MetS based on the 2009 harmonized definition [25] and diagnosed individuals as having MetS if three of these criteria match: 1) WC ≥ 90 cm for men; 2) TG level ≥ 150 mg/dL or receiving medications for hypertriglyceridemia; 3) HDL-C level < 40 mg/dL in men; 4) BP ≥ 130/85 mm Hg or receiving medications for hypertension; or 5) FPG level ≥ 100 mg/dL or receiving medications for type 2 DM. We applied the appropriate central obesity criteria of the Korean Society for the Study of Obesity as a cut-off for WC [26].
Statistical analysis
The variables were tested for normality using the Kolmogorov-Smirnov test and skewness and kurtosis analysis. If either method was satisfied, the data were considered to be normally distributed. For the comparison between participants with and without MetS, the Student’s t-test was performed for continuous (mean values ± standard deviation (SD)) variables and the Chi-square test for categorical variables (relative frequencies). Pearson’s correlation analysis was used for correlations between SUA level and other variables.
SUA levels were divided into quartiles as follows: Q1 (≤ 5.5 mg/dL), Q2 (5.6 - 6.3 mg/dL), Q3 (6.4 - 7.1 mg/dL) and Q4 (≥ 7.2 mg/dL). Continuous variables and categorical variables were compared with SUA quartiles using analysis of variance (ANOVA) and the Chi-square test, respectively. Next, we performed multiple logistic regression analysis to compare the association between variables and the prevalence of MetS. Age, WBC, AST, ALT, GGT, Cr, alcohol consumption, smoking, exercise and BMI were adjusted as potential confounders. Six models were used to correct for confounding factors (model 1: unadjusted; model 2: age; model 3: model 2 + WBC, ALT, AST, GGT; model 4: model 3 + Cr; model 5: model 4 + alcohol consumption, smoking status and exercise; model 6: model 5 + BMI). Odds ratios (ORs) and 95% confidence intervals (CIs) were used to estimate the MetS risk in each quartile. Finally, we examined the association of the SUA quartile with each MS separately using model 5 and model 6. All analyses were computed using SPSS for Windows (version 26.0; SPSS Inc., Chicago, IL, USA). If a P value was less than 0.05, it was considered statistically significant.
| Results | ▴Top |
Clinical characteristics
Table 1 shows the clinical characteristics of the study participants. In this study, the prevalence of MetS was 24.6%. Compared to workers without MetS, SUA levels in workers with MetS were significantly higher (P < 0.001). Age, BMI, WC, BP, WBC, AST, ALT, GGT, FPG, TG and Cr levels, number of MS, alcohol consumption, and smoking status were significantly higher in workers with MetS (P < 0.001). HDL-C and the number of above recommended PA were significantly lower in men with MetS (P < 0.001). The prevalences of MetS and MS were significantly higher in DW than in SW, although WBC and SUA levels were significantly higher in SW (P < 0.001) (Table 2).
 Click to view | Table 1. Characteristics of Study Participants |
Click to view | Table 2. Characteristics of Daytime Workers and Shift Workers |
Relationships between SUA and clinical variables
Except for age, FPG, and HDL-C, which showed negative correlations, SUA levels were positively correlated with all other variables (Table 3). We analyzed the clinical characteristics, including individual components of MetS, according to the SUA level quartiles using ANOVA (Table 4). Mean values of BMI, WC, BP, WBC, AST, ALT, GGT, T-Chol, LDL-C, TG and Cr levels correlated positively with SUA of the different quartiles. Age as well as FPG and HDL-C decreased with increasing SUA quartiles (P < 0.001). FPG levels were significantly different in each quartile; however, they were inversely related to SUA levels up to the third quartile, while it increased in the highest quartile. Additionally, the prevalence of DM decreased as SUA level increased (P < 0.001). The prevalence of MetS and number of cases were significantly different among the four quartiles (P < 0.001) (Fig. 1). The number of current smokers was highest in Q2, despite being significantly different among quartiles (P < 0.013). There were no significant differences in the number of alcohol drinkers according to SUA quartile (P = 0.526), and the number of above recommended PA was the same among (P = 0.480). The number of SW showed a significant positive relationship with the SUA quartile (P < 0.001).
Click to view | Table 3. Correlation Analyses Between Serum Uric Acid and Variables |
Click to view | Table 4. Characteristics of Variables According to Serum Uric Acid Quartiles |
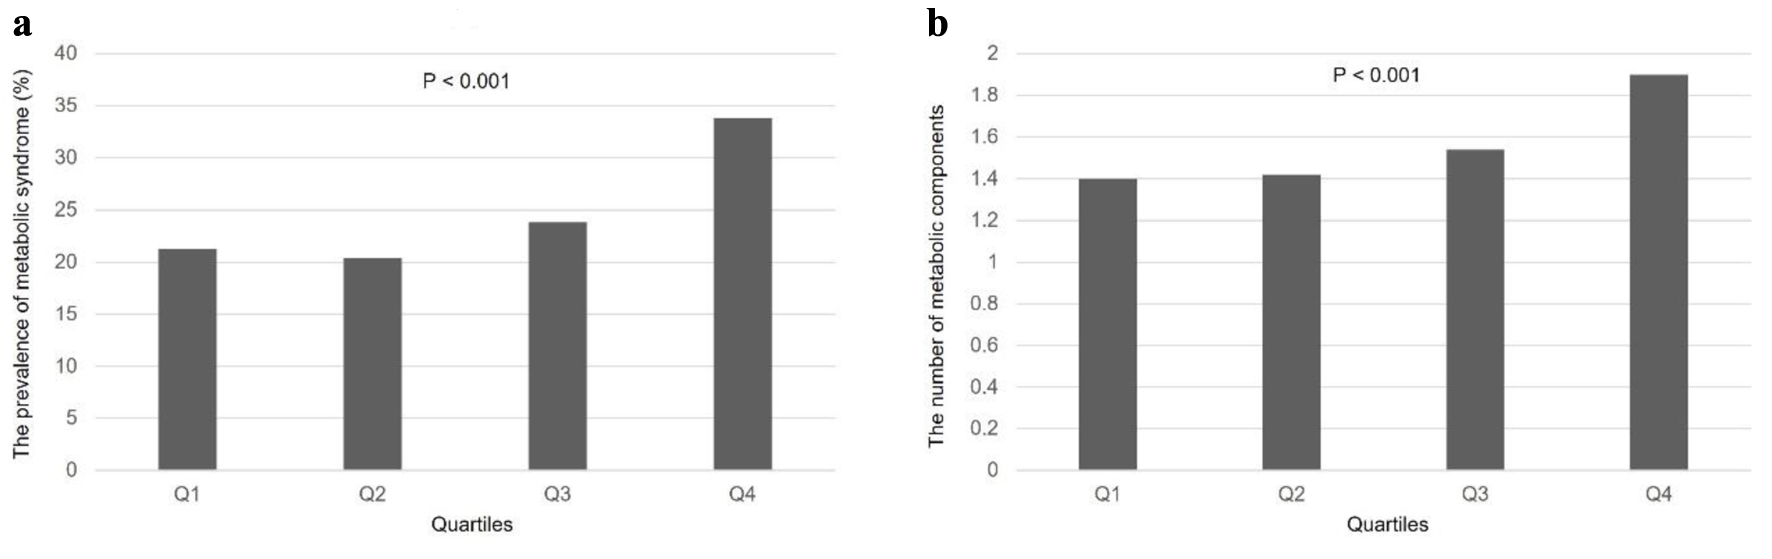 Click for large image | Figure 1. Prevalence of MetS and number of MS according to SUA quartiles. (a) The prevalence of MetS showed significant correlation with SUA quartiles (P < 0.001). (b) MS also had a positive relationship depending on the SUA quartiles (P < 0.001). MetS: metabolic syndrome; MS: metabolic components; SUA: serum uric acid. |
Associations of MetS according to SUA levels in quartiles
Table 5 shows the ORs with 95% CIs for the prevalence of MetS according to the SUA quartile. Quartiles with the lowest SUA level were used as reference groups. As the SUA level in the quartiles increased, the OR for MetS increased in the crude model (model 1). The unadjusted OR of MetS in the highest SUA quartile compared with the lowest quartile was 1.89 (95% CI: 1.66 - 2.15). After adjusting model 1 for age (model 2), the OR increased to 2.54 (95% CI: 2.22 - 2.92). After adjusting for WBC, ALT, AST, GGT (model 3), and Cr (model 4) levels, alcohol consumption, smoking status, and exercise (model 5), the ORs of MetS in the highest SUA quartile were attenuated, but significant associations remained between MetS and SUA levels. After additional adjustment for BMI (model 6), the OR decreased to 1.32 (95% CI: 1.12 - 1.54), which was a weakened but still significant association.
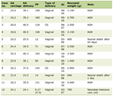
Click to view | Table 5. Odds Ratios of Metabolic Syndrome According to Serum Uric Acid Quartiles |
Associations of individual components of MetS according to SUA quartiles
After adjusting for age, WBC, ALT, AST, GGT and Cr levels, alcohol consumption, smoking status, and exercise, the associations between SUA quartiles and each MetS component were assessed (Table 6). SUA levels remained significantly associated with all MetS components in the highest quartiles (P < 0.001). Of these, high WC and TG levels showed significant associations even in the third quartiles of SUA levels (P < 0.001). When we further adjusted for BMI (model 6), SUA showed a significant association with high BP (P = 0.007) and glucose (P = 0.009) and TG levels (P < 0.001) in the highest quartiles. Particularly, a high TG level (P = 0.004) was significantly associated with the SUA level even in third quartile. The ORs of a high TG level were 1.22 (95% CI: 1.07 - 1.39) and 1.65 (95% CI: 1.44 - 1.89) in the third and highest SUA quartiles, respectively. However, the associations of SUA quartiles with a high WC (P = 0.264) and low HDL-C levels (P = 0.067) were no longer significant.
Click to view | Table 6. Odds Ratios of Metabolic Syndrome Components Adjusted by Model 5 and Model 6 According to Serum Uric Acid Quartiles |
| Discussion | ▴Top |
SUA levels were associated with MetS after adjusting for multiple confounding factors. When BMI was adjusted as a confounding factor, the strength of the associations decreased, although the association remained significant, suggesting that BMI may contribute to the observed associations. These results are consistent with those of previous cross-sectional and prospective studies. In a Korean study, SUA level in both men and women showed a positive relationship with the prevalence of MetS after adjusting for multiple potential confounding factors [27], and SUA levels were independent risk factors or predictors of MetS in longitudinal studies of Chinese and Japanese populations [21, 28]. Similarly, a prospective study in Korea suggested that SUA levels are a predictive risk factor for MetS [29]. The ORs for the prevalence of MetS were 1.32-fold higher in the highest quartile of SUA levels than in the lowest reference quartile. In a prospective study of Korean male workers, SUA levels were independently associated with the incidence of MetS in middle-aged men, and the hazard ratio was 1.48 after adjusting for multiple potential confounders [30], although BMI was not included as a potential confounder. In another prospective study of Korean male workers aged 30 - 39 years, there was a 1.41-fold higher risk of developing MetS in the highest SUA quartile than in the reference quartile [31].
The underlying mechanism by which high SUA levels might increase the risk of MetS development include endothelial dysfunction and reduced production of nitric oxide [32, 33], which may lead to IR and hyperinsulinemia; the latter increases renal re-absorption of UA [34]. Additionally, elevated UA levels can induce oxidative stress in adipocytes and stimulate vascular smooth muscle cell proliferation, although oxidative stress also increases antioxidant activity [35, 36]. Another consideration is that IR also reduces the activity of glyceraldehyde-3-phosphate dehydrogenase, resulting in hypertriglyceridemia and low HDL-C levels [37, 38].
When MetS components were evaluated individually after full adjustment, SUA levels were associated with a high BP, high FPG, and hypertriglyceridemia. Hyperuricemia is independently associated with hypertension [39]; this is similar to our results. Elevated SUA levels are involved in sterile inflammation of smooth muscle cells of vascular tissues, leading to a pro-inflammatory state, increasing cell proliferation and production of inflammatory mediators [33].
In our study, hyperuricemia and hyperglycemia were significantly associated with the SUA level even after full adjustment. Increased levels of reactive oxygen species due to hyperglycemia damaged insulin signaling pathways and led to IR [40]. However, in other studies, SUA levels increased until the pre-diabetes stage but decreased after being diagnosed with DM [41, 42]. In our study, the number of patients with DM decreased as SUA levels increased. We did not have data on insulin levels or homeostasis model assessment (HOMA)-IR, so we could not use them as confounding factors. In some studies, SUA levels in men were nonlinearly related to FPG levels, unlike in women [27, 41]; our study yielded similar results. Researchers have suggested that the distribution of SUA may differ between men and women with pre-diabetes and DM [27]. Therefore, further research on the nonlinear relationship between SUA levels, glucose metabolism, and differences in SUA levels between men and women is needed.
Hypertriglyceridemia increases the synthesis of free fatty acids and activates adenosine triphosphate (ATP) decomposition, increasing UA levels [43]. Synthesis of fatty acids in the liver leads to the synthesis of purines and increases urea synthesis [44]. Additionally, studies have shown a positive correlation between TG and SUA levels [13, 45]. In our study, ORs were the highest among the MS after adjustment for multiple potential confounding factors and significantly increased even in normal range of SUA levels. This indicates that TG monitoring can prevent hyperuricemia.
In our study, hyperuricemia was negatively correlated with HDL-C after adjusting for BMI. Other studies also showed that unlike TG, HDL-C was not associated with hyperuricemia [12, 46]. Obesity has risk factors that neutralize beneficial effects of HDL-C and can affect HDL-C metabolism, function, subclass distribution, and reduced cholesterol efflux; therefore, further research is needed [47, 48].
WC, as an individual MetS component, was not significantly associated when BMI was adjusted. The BMI, as an indicator of obesity, is as effective as WC in predicting the development of MetS [49]. Therefore, adjusting for BMI expectedly attenuates the significant association between SUA levels and MS. Norvik et al found that SUA levels at baseline and after 7 years were not associated with central obesity in normal-weight and overweight individuals [50]. Additionally, an independent association between longitudinal UA changes and the development of MetS was observed, regardless of BMI [50]. However, elevated BP and hyperglycemia were only associated with overweight individuals. Therefore, prospective studies on the influence of BMI on SUA levels are needed.
The number of SW also increased significantly with increasing SUA quartiles, suggesting that working conditions may affect worker health, with adverse effects, such as circadian rhythm changes, having been reported. Lifestyle habits, such as night meals, fast food consumption, lack of exercise and alcohol consumption, can cause hyperuricemia, which can lead to MetS [51]. Nevertheless, the prevalence of MetS in the DW group was significantly higher in this study. Larger number of DWs than SWs (6,626 vs. 2,565), the significantly higher average age of DWs (43.5 ± 9.6 vs. 38.7 ± 9.7, P < 0.001), and the fact that rotating SWs who work clockwise shifts are less prone to circadian misalignment than night SWs may be related to this result [52].
The numbers of workers who drank more than twice a week and exercise less than the recommended PA level did not correlate with SUA quartiles, although they were significantly increased in the MetS group. The association between alcohol consumption and hyperuricemia is well-known, and SUA levels decrease as exercise intensity increases [53, 54]. However, in our study, the questionnaire relied only on memory and we did not obtain information on the amount of alcohol consumption or the specific duration of each exercise intensity.
Low-grade chronic inflammation is associated with MetS [55]. Inflammatory markers observed in MetS are pro-inflammatory cytokines such as interleukin-6 (IL-6), C-reactive protein (CRP), and tumor necrosis factor-α (TNF-α) [56]. IL-6 released by both macrophages and adipocytes is associated with IR [57]. Level of CRP increased by IL-6 is correlated with MetS [58]. Macrophages within the adipose tissue produce TNF-α, which is correlated with IR [57]. Toll-like receptors (TLRs) are innate immune system receptors and activate downstream inflammatory pathways [59]. SUA levels are positively correlated with pro-inflammatory cytokines, and hyperuricemia is associated with gout [60]. Leukocyte is also an inflammatory marker and correlates with SUA levels [61], which was consistent with our results. In this study, SUA levels were positively associated with MetS regardless of WBC.
SW have higher WBC and a greater risk of MetS than DW [62, 63]. This is associated with reduced sleep quality and shorter or longer sleep duration for SW [64]. In our study, the mean WBC and SUA levels of SW were significantly higher than those of DW. However, the prevalence of MetS among SW was significantly lower than that of DW. Prospective studies on the causal relationship between work style and inflammatory factors are needed.
ALT, AST and GGT levels are significantly associated with SUA levels, which is consistent with our findings [65]. ALT and AST levels, even within normal range, are positively correlated with the prevalence of MetS [66]. UA induces inflammation and oxidative stress, which leads to hepatocyte death, decreased liver capacity and ultimately non-alcoholic fatty liver disease (NAFLD), which is associated with IR [65].
Taken together, SUA levels are considered as a biomarker of developing MetS in Korean male workers. Recent investigations have focused on the predictive role of SUA levels in the development and progression of MetS, although the pathophysiological mechanism remains elusive [22, 29, 67]. The information provided herein regarding the prevalence of MetS in this population should be useful for planning of health programs designed to counteract the development of MetS. SUA levels are commonly measured during health examinations in South Korea. Hence, careful follow-up of individuals with elevated SUA levels is prudent for the prevention of MetS. It is also important to note that follow-up observations of TG levels may be necessary to prevent hyperuricemia, which is a risk factor for MetS development.
We observed an association between SUA levels and the prevalence of MetS in a large sample of male workers after adjusting for multiple potential confounding factors, including WBC as a biomarker of inflammation, liver enzymes related with fatty liver disease, and life style factors. Specifically, we observed a significant difference in the prevalence of MetS and the distribution of SUA levels between DW and SW.
Our study has several limitations. First, cross-sectional research design does not allow for causal relationship to be determined. Second, we cannot consider the participants as representative of the general population because they were healthy male workers. Third, we did not measure insulin levels, and the HOMA-IR was not adjusted for the association between MetS and SUA levels. Finally, no dietary factors affected SUA levels in our questionnaire.
Conclusion
In our study, SUA levels were independently associated with the prevalence of MetS. SUA levels may be an independent risk factor for MetS. Hypertriglyceridemia may be a useful biomarker for monitoring hyperuricemia. Additionally, longitudinal prospective studies and further research on the pathogenesis of MetS are required to provide additional insights.
Acknowledgments
None to declare.
Financial Disclosure
The study was supported by a grant from the Korea Hydro & Nuclear Power project (A23LF01).
Conflict of Interest
The authors declare no conflict of interest.
Informed Consent
All participants provided informed consent.
Author Contributions
SHS: analysis of data, drafting the work. JYM: acquisition and interpretation of data. SJC: conceptualization and design of the work, drafting and revising, final approval of the version.
Data Availability
The data supporting the findings of this study are available from the corresponding author upon reasonable request.
Abbreviations
ALT: alanine aminotransferase; ANOVA: analysis of variance; AST: aspartate aminotransferase; ATP: adenosine triphosphate; BMI: body mass index; BP: blood pressure; BW: body weight; CI: confidence interval; Cr: serum creatinine; CVD: cardiovascular disease; DM: diabetes mellitus; DW: daytime worker; FPG: fasting plasma glucose; GGT: gamma-glutamyl transpeptidase; HDL-C: high-density lipoprotein cholesterol; HOMA: homeostasis model assessment; IR: insulin resistance; LDL-C: low-density lipoprotein cholesterol; MetS: metabolic syndrome; OR: odds ratio; PA: physical activity; Q: quartile; SD: standard deviation; SUA: serum uric acid; SW: shift worker; T-Chol: total cholesterol; TG: triglyceride; WBC: white blood cell count; WC: waist circumference
| References | ▴Top |
- National Health Insurance Service. National Health Screening Statistical Yearbook 2021. National Health Insurance Service; 2022 Dec. Report No. 11-B550928-000048-10.
- National Health Insurance Service. National Health Screening Statistical Yearbook 2020. National Health Insurance Service; 2021 Dec. Report No. 11-B550928-000048-10
- Wilson PW, D'Agostino RB, Parise H, Sullivan L, Meigs JB. Metabolic syndrome as a precursor of cardiovascular disease and type 2 diabetes mellitus. Circulation. 2005;112(20):3066-3072.
doi pubmed - Hamaguchi M, Kojima T, Takeda N, Nakagawa T, Taniguchi H, Fujii K, Omatsu T, et al. The metabolic syndrome as a predictor of nonalcoholic fatty liver disease. Ann Intern Med. 2005;143(10):722-728.
doi pubmed - Esposito K, Chiodini P, Colao A, Lenzi A, Giugliano D. Metabolic syndrome and risk of cancer: a systematic review and meta-analysis. Diabetes Care. 2012;35(11):2402-2411.
doi pubmed pmc - Andreadis EA, Tsourous GI, Tzavara CK, Georgiopoulos DX, Katsanou PM, Marakomichelakis GE, Diamantopoulos EJ. Metabolic syndrome and incident cardiovascular morbidity and mortality in a Mediterranean hypertensive population. Am J Hypertens. 2007;20(5):558-564.
doi pubmed - Li C, Hsieh MC, Chang SJ. Metabolic syndrome, diabetes, and hyperuricemia. Curr Opin Rheumatol. 2013;25(2):210-216.
doi pubmed - Soltani Z, Rasheed K, Kapusta DR, Reisin E. Potential role of uric acid in metabolic syndrome, hypertension, kidney injury, and cardiovascular diseases: is it time for reappraisal? Curr Hypertens Rep. 2013;15(3):175-181.
doi pubmed pmc - Li L, Yang C, Zhao Y, Zeng X, Liu F, Fu P. Is hyperuricemia an independent risk factor for new-onset chronic kidney disease? A systematic review and meta-analysis based on observational cohort studies. BMC Nephrol. 2014;15:122.
doi pubmed pmc - Lee JJ, Ahn J, Hwang J, Han SW, Lee KN, Kim JB, Lee S, et al. Relationship between uric acid and blood pressure in different age groups. Clin Hypertens. 2015;21:14.
doi pubmed pmc - Miyake T, Kumagi T, Furukawa S, Hirooka M, Kawasaki K, Koizumi M, Todo Y, et al. Hyperuricemia is a risk factor for the onset of impaired fasting glucose in men with a high plasma glucose level: a community-based study. PLoS One. 2014;9(9):e107882.
doi pubmed pmc - Hikita M, Ohno I, Mori Y, Ichida K, Yokose T, Hosoya T. Relationship between hyperuricemia and body fat distribution. Intern Med. 2007;46(17):1353-1358.
doi pubmed - Peng TC, Wang CC, Kao TW, Chan JY, Yang YH, Chang YW, Chen WL. Relationship between hyperuricemia and lipid profiles in US adults. Biomed Res Int. 2015;2015:127596.
doi pubmed pmc - Kocak MZ, Aktas G, Erkus E, Sincer I, Atak B, Duman T. Serum uric acid to HDL-cholesterol ratio is a strong predictor of metabolic syndrome in type 2 diabetes mellitus. Rev Assoc Med Bras (1992). 2019;65(1):9-15.
doi pubmed - Aktas G, Kocak MZ, Bilgin S, Atak BM, Duman TT, Kurtkulagi O. Uric acid to HDL cholesterol ratio is a strong predictor of diabetic control in men with type 2 diabetes mellitus. Aging Male. 2020;23(5):1098-1102.
doi pubmed - Aktas G, Khalid A, Kurtkulagi O, Duman TT, Bilgin S, Kahveci G, Atak Tel BM, et al. Poorly controlled hypertension is associated with elevated serum uric acid to HDL-cholesterol ratio: a cross-sectional cohort study. Postgrad Med. 2022;134(3):297-302.
doi pubmed - Kosekli MA, Kurtkulagii O, Kahveci G, Duman TT, Tel BMA, Bilgin S, Demirkol ME, et al. The association between serum uric acid to high density lipoprotein-cholesterol ratio and non-alcoholic fatty liver disease: the abund study. Rev Assoc Med Bras (1992). 2021;67(4):549-554.
doi pubmed - Kurtkulagi O, Tel BMA, Kahveci G, Bilgin S, Duman TT, Erturk A, Balci B, et al. Hashimoto's thyroiditis is associated with elevated serum uric acid to high density lipoprotein-cholesterol ratio. Rom J Intern Med. 2021;59(4):403-408.
doi pubmed - Kosekli MA, Aktas G. Serum uric acid to HDL cholesterol ratio is associated with diabetic control in new onset type 2 diabetic population. Acta Clin Croat. 2023;62:277-282.
- Aktas G, Yilmaz S, Kantarci DB, Duman TT, Bilgin S, Balci SB, Atak Tel BM. Is serum uric acid-to-HDL cholesterol ratio elevation associated with diabetic kidney injury? Postgrad Med. 2023;135(5):519-523.
doi pubmed - Oda E. Serum uric acid is an independent predictor of metabolic syndrome in a Japanese health screening population. Heart Vessels. 2014;29(4):496-503.
doi pubmed - Sui X, Church TS, Meriwether RA, Lobelo F, Blair SN. Uric acid and the development of metabolic syndrome in women and men. Metabolism. 2008;57(6):845-852.
doi pubmed pmc - Sookoian S, Gemma C, Fernandez Gianotti T, Burgueno A, Alvarez A, Gonzalez CD, Pirola CJ. Effects of rotating shift work on biomarkers of metabolic syndrome and inflammation. J Intern Med. 2007;261(3):285-292.
doi pubmed - Ryu S, Chang Y, Zhang Y, Kim SG, Cho J, Son HJ, Shin H, et al. A cohort study of hyperuricemia in middle-aged South Korean men. Am J Epidemiol. 2012;175(2):133-143.
doi pubmed - Alberti KG, Eckel RH, Grundy SM, Zimmet PZ, Cleeman JI, Donato KA, Fruchart JC, et al. Harmonizing the metabolic syndrome: a joint interim statement of the International Diabetes Federation Task Force on Epidemiology and Prevention; National Heart, Lung, and Blood Institute; American Heart Association; World Heart Federation; International Atherosclerosis Society; and International Association for the Study of Obesity. Circulation. 2009;120(16):1640-1645.
doi pubmed - Lee SY, Park HS, Kim DJ, Han JH, Kim SM, Cho GJ, Kim DY, et al. Appropriate waist circumference cutoff points for central obesity in Korean adults. Diabetes Res Clin Pract. 2007;75(1):72-80.
doi pubmed - Lee JM, Kim HC, Cho HM, Oh SM, Choi DP, Suh I. Association between serum uric acid level and metabolic syndrome. J Prev Med Public Health. 2012;45(3):181-187.
doi pubmed pmc - Zhang Q, Zhang C, Song X, Lin H, Zhang D, Meng W, Zhang Y, et al. A longitudinal cohort based association study between uric acid level and metabolic syndrome in Chinese Han urban male population. BMC Public Health. 2012;12:419.
doi pubmed pmc - Yadav D, Lee ES, Kim HM, Choi E, Lee EY, Lim JS, Ahn SV, et al. Prospective study of serum uric acid levels and incident metabolic syndrome in a Korean rural cohort. Atherosclerosis. 2015;241(1):271-277.
doi pubmed - Lee JK, Ryoo JH, Choi JM, Park SK. Serum uric acid level and the incidence of metabolic syndrome in middle-aged Korean men: a 5-year follow-up study. J Prev Med Public Health. 2014;47(6):317-326.
doi pubmed pmc - Ryu S, Song J, Choi BY, Lee SJ, Kim WS, Chang Y, Kim DI, et al. Incidence and risk factors for metabolic syndrome in Korean male workers, ages 30 to 39. Ann Epidemiol. 2007;17(4):245-252.
doi pubmed - Jia G, Aroor AR, Whaley-Connell AT, Sowers JR. Fructose and uric acid: is there a role in endothelial function? Curr Hypertens Rep. 2014;16(6):434.
doi pubmed pmc - Johnson RJ, Kang DH, Feig D, Kivlighn S, Kanellis J, Watanabe S, Tuttle KR, et al. Is there a pathogenetic role for uric acid in hypertension and cardiovascular and renal disease? Hypertension. 2003;41(6):1183-1190.
doi pubmed - Muscelli E, Natali A, Bianchi S, Bigazzi R, Galvan AQ, Sironi AM, Frascerra S, et al. Effect of insulin on renal sodium and uric acid handling in essential hypertension. Am J Hypertens. 1996;9(8):746-752.
doi pubmed - Sautin YY, Nakagawa T, Zharikov S, Johnson RJ. Adverse effects of the classic antioxidant uric acid in adipocytes: NAPDH oxidase-mediated oxidative/nitrosative stress. Am J Physiol Cell Physiol. 2007;293(2):C584-596.
- Corry DB, Eslami P, Yamamoto K, Nyby MD, Makino H, Tuck ML. Uric acid stimulates vascular smooth muscle cell proliferation and oxidative stress via the vascular renin-angiotensin system. J Hypertens. 2008;26(2):269-275.
doi pubmed - Leyva F, Wingrove CS, Godsland IF, Stevenson JC. The glycolytic pathway to coronary heart disease: a hypothesis. Metabolism. 1998;47(6):657-662.
doi pubmed - Schmidt MI, Watson RL, Duncan BB, Metcalf P, Brancati FL, Sharrett AR, Davis CE, et al. Clustering of dyslipidemia, hyperuricemia, diabetes, and hypertension and its association with fasting insulin and central and overall obesity in a general population. Atherosclerosis Risk in Communities Study Investigators. Metabolism. 1996;45(6):699-706.
doi pubmed - Heinig M, Johnson RJ. Role of uric acid in hypertension, renal disease, and metabolic syndrome. Cleve Clin J Med. 2006;73(12):1059-1064.
doi pubmed - Hurrle S, Hsu WH. The etiology of oxidative stress in insulin resistance. Biomed J. 2017;40(5):257-262.
doi pubmed pmc - van der Schaft N, Brahimaj A, Wen KX, Franco OH, Dehghan A. The association between serum uric acid and the incidence of prediabetes and type 2 diabetes mellitus: The Rotterdam Study. PLoS One. 2017;12(6):e0179482.
doi pubmed pmc - Hairong N, Zengchang P, Shaojie W, Weiguo G, Lei Z, Jie R, Feng N, et al. Serum uric acid, plasma glucose and diabetes. Diab Vasc Dis Res. 2010;7(1):40-46.
doi pubmed - Balasubramanian T. Uric acid or 1-methyl uric acid in the urinary bladder increases serum glucose, insulin, true triglyceride, and total cholesterol levels in Wistar rats. ScientificWorldJournal. 2003;3:930-936.
doi pubmed pmc - Matsuura F, Yamashita S, Nakamura T, Nishida M, Nozaki S, Funahashi T, Matsuzawa Y. Effect of visceral fat accumulation on uric acid metabolism in male obese subjects: visceral fat obesity is linked more closely to overproduction of uric acid than subcutaneous fat obesity. Metabolism. 1998;47(8):929-933.
doi pubmed - Hou YL, Yang XL, Wang CX, Zhi LX, Yang MJ, You CG. Hypertriglyceridemia and hyperglycemia: a retrospective study of urban residents. Lipids Health Dis. 2019;18(1):81.
- Baygi F, Herttua K, Sheidaei A, Ahmadvand A, Jensen OC. Association of serum uric acid with cardio-metabolic risk factors and metabolic syndrome in seafarers working on tankers. BMC Public Health. 2020;20(1):442.
doi pubmed pmc - Woudberg NJ, Lecour S, Goedecke JH. HDL subclass distribution shifts with increasing central adiposity. J Obes. 2019;2019:2107178.
doi pubmed pmc - Stadler JT, Marsche G. Obesity-related changes in high-density lipoprotein metabolism and function. Int J Mol Sci. 2020;21(23):8985.
doi pubmed pmc - Gierach M, Gierach J, Ewertowska M, Arndt A, Junik R. Correlation between body mass index and waist circumference in patients with metabolic syndrome. ISRN Endocrinol. 2014;2014:514589.
doi pubmed pmc - Norvik JV, Storhaug HM, Ytrehus K, Jenssen TG, Zykova SN, Eriksen BO, Solbu MD. Overweight modifies the longitudinal association between uric acid and some components of the metabolic syndrome: The Tromso Study. BMC Cardiovasc Disord. 2016;16:85.
doi pubmed pmc - Haus E, Reinberg A, Mauvieux B, Le Floc'h N, Sackett-Lundeen L, Touitou Y. Risk of obesity in male shift workers: A chronophysiological approach. Chronobiol Int. 2016;33(8):1018-1036.
doi pubmed - Shiffer D, Minonzio M, Dipaola F, Bertola M, Zamuner AR, Dalla Vecchia LA, Solbiati M, et al. Effects of clockwise and counterclockwise job shift work rotation on sleep and work-life balance on hospital nurses. Int J Environ Res Public Health. 2018;15(9):2038.
doi pubmed pmc - Jee YH, Jung KJ, Park YB, Spiller W, Jee SH. Causal effect of alcohol consumption on hyperuricemia using a Mendelian randomization design. Int J Rheum Dis. 2019;22(10):1912-1919.
doi pubmed - Hou Y, Ma R, Gao S, Kaudimba KK, Yan H, Liu T, Wang R. The effect of low and moderate exercise on hyperuricemia: protocol for a randomized controlled study. Front Endocrinol (Lausanne). 2021;12:716802.
doi pubmed pmc - Fahed G, Aoun L, Bou Zerdan M, Allam S, Bou Zerdan M, Bouferraa Y, Assi HI. Metabolic syndrome: updates on pathophysiology and management in 2021. Int J Mol Sci. 2022;23(2):786.
doi pubmed pmc - Li DY, Zhang YC, Philips MI, Sawamura T, Mehta JL. Upregulation of endothelial receptor for oxidized low-density lipoprotein (LOX-1) in cultured human coronary artery endothelial cells by angiotensin II type 1 receptor activation. Circ Res. 1999;84(9):1043-1049.
doi pubmed - Weisberg SP, McCann D, Desai M, Rosenbaum M, Leibel RL, Ferrante AW, Jr. Obesity is associated with macrophage accumulation in adipose tissue. J Clin Invest. 2003;112(12):1796-1808.
doi pubmed pmc - Ridker PM, Hennekens CH, Buring JE, Rifai N. C-reactive protein and other markers of inflammation in the prediction of cardiovascular disease in women. N Engl J Med. 2000;342(12):836-843.
doi pubmed - Kawai T, Akira S. The role of pattern-recognition receptors in innate immunity: update on Toll-like receptors. Nat Immunol. 2010;11(5):373-384.
doi pubmed - Zha X, Yang B, Xia G, Wang S. Combination of uric acid and pro-inflammatory cytokines in discriminating patients with gout from healthy controls. J Inflamm Res. 2022;15:1413-1420.
doi pubmed pmc - Liu J, Shen P, Ma X, Yu X, Ni L, Hao X, Wang W, et al. White blood cell count and the incidence of hyperuricemia: insights from a community-based study. Front Med. 2019;13(6):741-746.
doi pubmed - Lu YC, Wang CP, Yu TH, Tsai IT, Hung WC, Lu IC, Hsu CC, et al. Shift work is associated with metabolic syndrome in male steel workers-the role of resistin and WBC count-related metabolic derangements. Diabetol Metab Syndr. 2017;9:83.
doi pubmed pmc - Chang WP, Lin YK. Relationship between rotating shift work and white blood cell count, white blood cell differential count, obesity, and metabolic syndrome of nurses. Chronobiol Int. 2022;39(2):159-168.
doi pubmed - Dowd JB, Goldman N, Weinstein M. Sleep duration, sleep quality, and biomarkers of inflammation in a Taiwanese population. Ann Epidemiol. 2011;21(11):799-806.
doi pubmed pmc - Deb S, Sakharkar P. A population based study of liver function amongst adults with hyperuricemia and gout in the United States. Diseases. 2021;9(3):61.
doi pubmed pmc - Kim HR, Han MA. Association between serum liver enzymes and metabolic syndrome in Korean adults. Int J Environ Res Public Health. 2018;15(8):1658.
doi pubmed pmc - Yu TY, Jee JH, Bae JC, Jin SM, Baek JH, Lee MK, Kim JH. Serum uric acid: A strong and independent predictor of metabolic syndrome after adjusting for body composition. Metabolism. 2016;65(4):432-440.
doi pubmed
This article is distributed under the terms of the Creative Commons Attribution Non-Commercial 4.0 International License, which permits unrestricted non-commercial use, distribution, and reproduction in any medium, provided the original work is properly cited.
Journal of Endocrinology and Metabolism is published by Elmer Press Inc.