Journal of Endocrinology and Metabolism, ISSN 1923-2861 print, 1923-287X online, Open Access
Article copyright, the authors; Journal compilation copyright, J Endocrinol Metab and Elmer Press Inc
Journal website https://www.jofem.org

Original Article

Volume 14, Number 1, February 2024, pages 21-32


Association of Metabolic Syndrome With Serum Uric Acid Level in Male Workers

Figure

Figure 1.
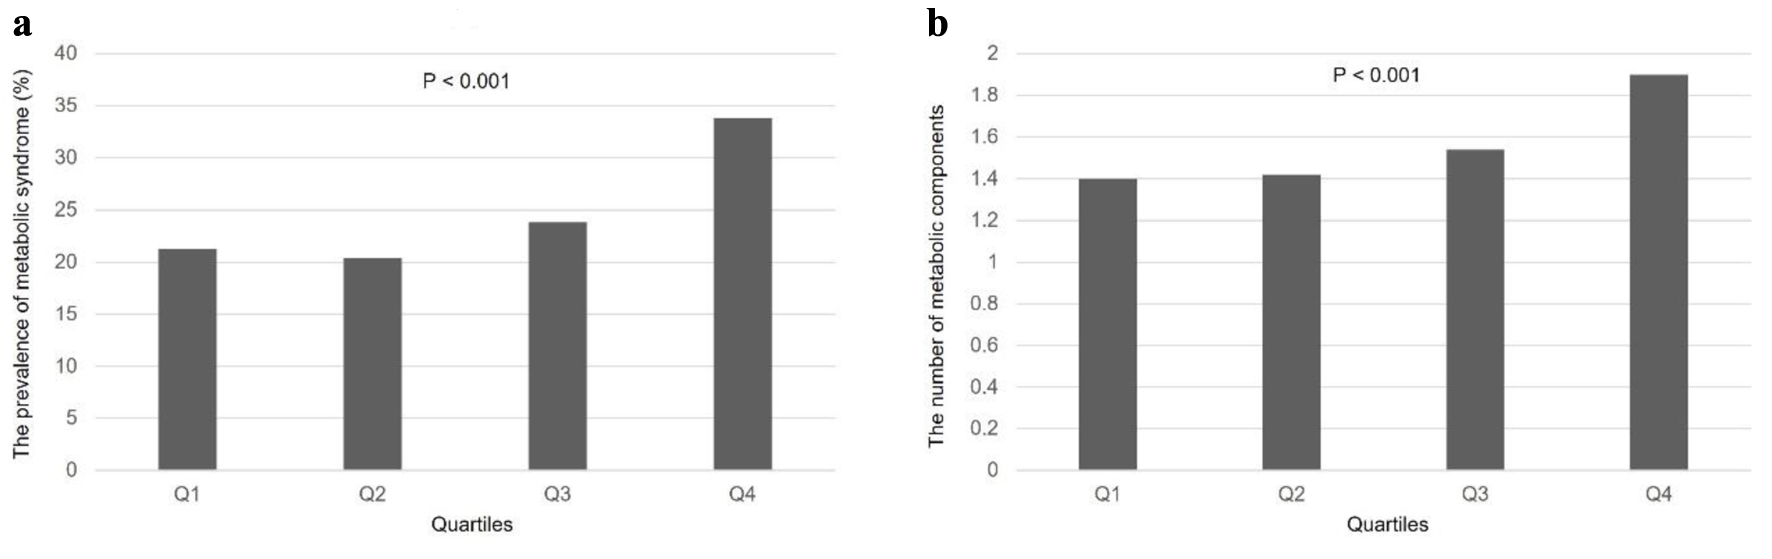
Figure 1. Prevalence of MetS and number of MS according to SUA quartiles. (a) The prevalence of MetS showed significant correlation with SUA quartiles (P < 0.001). (b) MS also had a positive relationship depending on the SUA quartiles (P < 0.001). MetS: metabolic syndrome; MS: metabolic components; SUA: serum uric acid.

Tables

Table 1. Characteristics of Study Participants
 
VariablesWorker without MetS (n = 6,926)Worker with MetS (n = 2,265)P value
ALT: alanine aminotransferase; AST: aspartate aminotransferase; BMI: body mass index; Cr: creatinine; DBP: diastolic blood pressure; DW: daytime worker; FPG: fasting plasma glucose; GGT: gamma-glutamyl transpeptidase; HDL-C: high-density lipoprotein cholesterol; LDL-C: low-density lipoprotein cholesterol; MetS: metabolic syndrome; MS: metabolic components; PA: physical activity; SBP: systolic blood pressure; SW: shift worker; T-Chol: total cholesterol; TG: triglyceride; UA: uric acid; WBC: white blood cell count; WC: waist circumference.
Age (years)41.0 ± 9.945.9 ± 8.9< 0.001
BMI (kg/m2)24.3 ± 2.627.2 ± 3.3< 0.001
WC (cm)83.0 ± 6.891.2 ± 8.0< 0.001
SBP (mm Hg)120.9 ± 10.7128.6 ± 11.5< 0.001
DBP (mm Hg)77.1 ± 8.782.0 ± 9.1< 0.001
WBC (/µL)5,940 ± 1,4646,333 ± 1,539< 0.001
AST (U/L)25.6 ± 17.730.9 ± 19.7< 0.001
ALT (U/L)27.7 ± 19.541.2 ± 31.5< 0.001
GGT (U/L)33.0 ± 30.353.6 ± 50.6< 0.001
FPG (mg/dL)95.2 ± 12.4109.4 ± 24.0< 0.001
T-Chol (mg/dL)202.5 ± 35.1203.7 ± 41.90.235
HDL-C (mg/dL)55.7 ± 11.946.2 ± 10.2< 0.001
LDL-C (mg/dL)126.6 ± 32.2122.3 ± 37.7< 0.001
TG (mg/dL)117.0 ± 73.5213.8 ± 167.4< 0.001
UA (mg/dL)6.2 ± 1.36.5 ± 1.4< 0.001
Cr (mg/dL)0.95 ± 0.140.97 ± 0.170.003
MS (n)0.9 ± 0.83.5 ± 0.7< 0.001
Alcohol consumption (%)< 0.001
  ≥ Twice a week1,219 (17.6)515 (22.7)
  ≤ Once a week5,707 (82.4)1,750 (77.3)
Smoking status (%)< 0.001
  Non-smoker3,258 (47.0)743 (32.8)
  Former smoker2,067 (29.8)836 (36.9)
  Current smoker1,601 (23.1)686 (30.3)
Exercise (%)< 0.001
  Above recommended PA1,992 (28.8)525 (23.2)
  Below recommended PA4,934 (71.2)1,740 (76.8)
Workers (%)< 0.001
  DW4,917 (71.0)1,709 (75.5)
  SW2,009 (29.0)556 (24.5)
DM (%)0.065
  Yes508 (7.3)140 (6.2)
  No6,418 (92.7)2,125 (93.8)


Table 2. Characteristics of Daytime Workers and Shift Workers
 
VariablesDW (n = 6,626)SW (n = 2,565)P value
ALT: alanine aminotransferase; AST: aspartate aminotransferase; BMI: body mass index; Cr: creatinine; DBP: diastolic blood pressure; DW: daytime worker; FPG: fasting plasma glucose; HDL-C: high-density lipoprotein cholesterol; LDL-C: low-density lipoprotein cholesterol; MetS: metabolic syndrome; MS: metabolic components; PA: physical activity; SBP: systolic blood pressure; SW: shift worker; T-Chol: total cholesterol; TG: triglyceride; UA: uric acid; WBC: white blood cell count; WC: waist circumference.
Age (years)43.5 ± 9.638.7 ± 9.7< 0.001
BMI (kg/m2)24.9 ± 3.125.2 ± 3.2< 0.001
WC (cm)85.2 ± 7.884.5 ± 8.20.001
SBP (mm Hg)122.6 ± 11.1123.3 ± 11.90.004
DBP (mm Hg)77.8 ± 9.076.9 ± 9.5< 0.001
WBC (/µL)5,940 ± 1,4646,333 ± 1,539< 0.001
AST (U/L)26.9 ± 18.926.7 ± 16.70.634
ALT (U/L)31.0 ± 23.930.9 ± 23.30.760
FPG (mg/dL)99.0 ± 17.797.6 ± 15.4< 0.001
T-Chol (mg/dL)203.8 ± 37.6200.1 ± 35.0< 0.001
HDL-C (mg/dL)53.1 ± 12.253.8 ± 11.80.017
LDL-C (mg/dL)126.2 ± 34.1123.8 ± 32.30.002
TG (mg/dL)140.7 ± 112.3141.2 ± 113.70.820
UA (mg/dL)6.25 ± 1.306.41 ± 1.30< 0.001
Cr (mg/dL)0.96 ± 0.150.92 ± 0.13< 0.001
MS (n)1.6 ± 1.31.4 ± 1.3< 0.001
Alcohol consumption (%)< 0.001
  ≥ Twice a week1,371 (20.7)363 (14.2)
  ≤ Once a week5,255 (79.3)2,202 (85.8)
Smoking status (%)< 0.001
  Non-smoker2,846 (43.0)1,155 (45.0)
  Former smoker2,214 (33.4)689 (26.9)
  Current smoker1,566 (23.6)721 (28.1)
Exercise (%)0.002
  Above recommended activity1,756 (26.5)761 (29.7)
  Below recommended activity4,870 (73.5)1,804 (70.3)
MetS (%)0.001
  Yes1,709 (25.8)556 (21.7)
  No4,917 (74.2)2,009 (78.3)


Table 3. Correlation Analyses Between Serum Uric Acid and Variables
 
VariablesSerum UA levels
βP value
ALT: alanine aminotransferase; AST: aspartate aminotransferase; BMI: body mass index; Cr: creatinine; DBP: diastolic blood pressure; FPG: fasting plasma glucose; GGT: gamma-glutamyl transpeptidase; HDL-C: high-density lipoprotein cholesterol; LDL-C: low-density lipoprotein cholesterol; MS: metabolic components; SBP: systolic blood pressure; T-Chol: total cholesterol; TG: triglyceride; UA: uric acid; WBC: white blood cell count; WC: waist circumference.
Age (years)-0.167< 0.001
BMI (kg/m2)0.223< 0.001
WC (cm)0.203< 0.001
SBP (mm Hg)0.092< 0.001
DBP (mm Hg)0.075< 0.001
WBC (/µL)0.090< 0.001
GOT (U/L)0.089< 0.001
GPT (U/L)0.157< 0.001
GGT (U/L)0.108< 0.001
FPG (mg/dL)-0.050< 0.001
T-Chol (mg/dL)0.139< 0.001
HDL-C (mg/dL)-0.151< 0.001
LDL-C (mg/dL)0.141< 0.001
TG (mg/dL)0.127< 0.001
Cr (mg/dL)0.152< 0.001
MS (n)0.133< 0.001


Table 4. Characteristics of Variables According to Serum Uric Acid Quartiles
 
VariablesQ1 (≤ 5.5 mg/dL)Q2 (5.6 - 6.3 mg/dL)Q3 (6.4 - 7.1 mg/dL)Q4 (≥ 7.2 mg/dL)P trend
ALT: alanine aminotransferase; AST: aspartate aminotransferase; BMI: body mass index; Cr: creatinine; DBP: diastolic blood pressure; DM: diabetes mellitus; FPG: fasting plasma glucose; GGT: gamma-glutamyl transpeptidase; HDL-C: high-density lipoprotein cholesterol; LDL-C: low-density lipoprotein cholesterol; MetS: metabolic syndrome; MS: metabolic components; PA: physical activity; Q: quartile; SBP: systolic blood pressure; SW: shift worker; T-Chol: total cholesterol; TG: triglyceride; UA: uric acid; WBC: white blood cell count; WC: waist circumference.
Number of patients2,5552,3272,0932,216
Age (years)44.5 ± 9.942.4 ± 9.841.5 ± 9.940.1 ± 9.5< 0.001
BMI (kg/m2)24.2 ± 3.024.7 ± 2.825.1 ± 2.826.1 ± 3.4< 0.001
WC (cm)83.3 ± 7.884.2 ± 7.385.3 ± 7.487.7 ± 8.5< 0.001
SBP (mm Hg)121.6 ± 10.9122.5 ± 11.4122.8 ± 11.4124.7 ± 11.7< 0.001
DBP (mm Hg)76.8 ± 8.977.5 ± 9.277.2 ± 9.278.9 ± 9.2< 0.001
WBC (/µL)5,900 ± 1,5745,979 ± 1,4566,089 ± 1,4716,261 ± 1,446< 0.001
AST (U/L)25.6 ± 15.325.9 ± 19.926.6 ± 13.329.8 ± 23.1< 0.001
ALT (U/L)27.4 ± 19.028.9 ± 20.031.3 ± 24.937.2 ± 29.4< 0.001
GGT (U/L)34.0 ± 35.135.8 ± 36.037.8 ± 35.945.5 ± 41.6< 0.001
FPG (mg/dL)100.2 ± 21.998.1 ± 16.597.4 ± 14.498.6 ± 13.6< 0.001
T-Chol (mg/dL)197.0 ± 37.1200.5 ± 35.5204.7 ± 36.8210.2 ± 36.9< 0.001
HDL-C (mg/dL)55.5 ± 13.054.1 ± 12.052.8 ± 11.650.6 ± 11.2< 0.001
LDL-C (mg/dL)119.5 ± 33.3124.1 ± 32.7128.0 ± 33.8131.8 ± 33.7< 0.001
TG (mg/dL)127.1 ± 125.9131.9 ± 86.9141.4 ± 95.8165.7 ± 130.3< 0.001
Cr (mg/dL)0.93 ± 0.150.94 ± 0.140.96 ± 0.150.99 ± 0.16< 0.001
MS (n)1.40 ± 1.331.42 ± 1.291.54 ± 1.311.90 ± 1.36< 0.001
MetS (%)543 (21.3)476 (20.4)498 (23.8)749 (33.8)< 0.001
Current smoker (%)598 (23.4)600 (25.8)528 (25.2)561 (25.3)0.013
Alcohol drinker (%)474 (18.6)421 (18.1)403 (19.3)436 (19.7)0.526
Above recommended PA (%)672 (26.3)637 (27.4)590 (28.2)618 (27.9)0.480
SW (%)618 (24.2)647 (27.8)605 (28.9)695 (31.3)< 0.001
DM (%)225 (8.8)183 (7.9)147 (7.0)93 (4.2)< 0.001


Table 5. Odds Ratios of Metabolic Syndrome According to Serum Uric Acid Quartiles
 
Serum UA levels
Q1 (≤ 5.5 mg/dL)Q2 (5.6 - 6.3 mg/dL)Q3 (6.4 - 7.1 mg/dL)Q4 (≥ 7.2 mg/dL)
Model 1: crude odds ratios. Model 2: adjusted for age. Model 3: model 2 + WBC, ALT, AST, GGT. Model 4: model 3 + Cr. Model 5: model 4 + alcohol consumption, smoking status, exercise. Model 6: model 5 + BMI. ALT: alanine aminotransferase; AST: aspartate aminotransferase; BMI: body mass index; Cr: creatinine; GGT: gamma-glutamyl transpeptidase; Q: quartile; UA: uric acid; WBC: white blood cell count.
Model 11.000
  Exp(B)0.9531.1571.888
  Lower0.8301.0081.659
  Upper1.0941.3282.149
  P value0.4940.039< 0.001
Model 21.000
  Exp(B)1.0671.3762.543
  Lower0.9261.1932.219
  Upper1.2291.5872.915
  P value0.372< 0.001< 0.001
Model 31.000
  Exp(B)0.9831.1671.886
  Lower0.8471.0041.631
  Upper1.1411.3572.180
  P value0.8260.044< 0.001
Model 41.000
  Exp(B)0.9821.1621.870
  Lower0.8461.0001.614
  Upper1.1391.3522.166
  P value0.8070.051< 0.001
Model 51.000
  Exp(B)0.9811.1581.858
  Lower0.8450.9951.604
  Upper1.1391.3472.153
  P value0.7980.057< 0.001
Model 61.000
  Exp(B)0.8850.9691.317
  Lower0.7560.8251.124
  Upper1.0351.1371.542
  P value0.1270.6960.001


Table 6. Odds Ratios of Metabolic Syndrome Components Adjusted by Model 5 and Model 6 According to Serum Uric Acid Quartiles
 
Serum UA levels (model 5)Serum UA levels (model 6)
Q1Q2Q3Q4Q1Q2Q3Q4
Model 5: adjusted by age, WBC, ALT, AST, GGT, Cr, alcohol consumption, smoking status, exercise. Model 6: model 5 + BMI. ALT: alanine aminotransferase; AST: aspartate aminotransferase; BMI: body mass index; BP: blood pressure; Cr: creatinine; WBC: white blood cell count; GGT: gamma-glutamyl transpeptidase; HDL-C: high-density lipoprotein cholesterol; Q: quartile; TG: triglyceride; UA: uric acid; WC: waist circumference.
High BP1.0001.000
  Exp(B)1.1061.1131.4651.0531.0101.197
  Lower0.9790.9811.2920.9300.8881.051
  Upper1.2481.2621.6621.1921.1491.363
  P value0.1050.096< 0.0010.4160.8760.007
High glucose1.0001.000
  Exp(B)1.0240.9991.3310.9980.9491.191
  Lower0.9060.8781.1700.8810.8341.045
  Upper1.1591.1351.5141.1291.0801.358
  P value0.7010.982< 0.0010.9700.4300.009
High WC1.0001.000
  Exp(B)1.0501.4112.0160.8321.0411.107
  Lower0.9041.2171.7460.6950.8690.926
  Upper1.2201.6372.3290.9961.2471.324
  P value0.524< 0.001< 0.0010.0460.6610.264
High TG1.0001.000
  Exp(B)1.0691.3011.8991.0301.2181.649
  Lower0.9391.1391.6640.9041.0651.441
  Upper1.2161.4852.1681.1741.3931.888
  P value0.315< 0.001< 0.0010.6580.004< 0.001
Low HDL-C1.0001.000
  Exp(B)1.0561.1041.3431.0211.0341.163
  Lower0.9040.9411.1470.8730.8800.989
  Upper1.2331.2951.5731.1941.2151.366
  P value0.4930.225< 0.0010.7990.6850.067