

| Journal of Endocrinology and Metabolism, ISSN 1923-2861 print, 1923-287X online, Open Access |
| Article copyright, the authors; Journal compilation copyright, J Endocrinol Metab and Elmer Press Inc |
| Journal website https://www.jofem.org |
Original Article
Volume 14, Number 1, February 2024, pages 48-58

Concordance and Associated Factors in Diagnostic Criteria for Prediabetes and Diabetes: An Analysis of Fasting Glucose, Postprandial Glucose, and Glycated Hemoglobin
Victor Juan Vera-Poncea, f ![]() , Fiorella E. Zuzunaga-Montoyab
, Fiorella E. Zuzunaga-Montoyab ![]() , Joan A. Loayza-Castroa
, Joan A. Loayza-Castroa ![]() , Luisa Erika Milagros Vasquez-Romeroa
, Luisa Erika Milagros Vasquez-Romeroa ![]() , Cori Raquel Iturregui Paucarc
, Cori Raquel Iturregui Paucarc ![]() , Mario J. Valladares-Garridod, e
, Mario J. Valladares-Garridod, e ![]() , Willy Ramosa
, Willy Ramosa ![]() , Norka Rocio Guillen Poncea
, Norka Rocio Guillen Poncea ![]() , Jhony A. De La Cruz-Vargasa
, Jhony A. De La Cruz-Vargasa ![]()
aInstituto de Investigaciones en Ciencias Biomedicas, Universidad Ricardo Palma, Lima, Peru
bInstituto de Investigacion de Enfermedades Tropicales, Universidad Nacional Toribio Rodriguez de Mendoza de Amazonas (UNTRM), Amazonas, Peru
cFacultad de Psicologia, Universidad Tecnologica del Peru, Lima, Peru
dEscuela de Medicina, Universidad Continental Lima, Peru
eOficina de Epidemiologia, Hospital Regional Lambayeque, Chiclayo, Peru
fCorresponding Author: Victor Juan Vera-Ponce, Instituto de Investigaciones en Ciencias Biomedicas, Universidad Ricardo Palma, Lima, Peru
Manuscript submitted November 27, 2023, accepted January 10, 2024, published online February 29, 2024
Short title: Diagnostic Criteria for Prediabetes and Diabetes
doi: https://doi.org/10.14740/jem919
| Abstract | ▴Top |
Background: Type 2 diabetes mellitus (T2DM) and prediabetes are rising chronic health conditions globally. Early and accurate identification of these disorders is crucial for effective prevention and management. The objective was to evaluate the concordance and associated factors of prediabetes and diabetes based on fasting glucose (FG), postprandial glucose (PPG), and glycated hemoglobin (HbA1c).
Methods: Primary analysis was conducted on patients from a polyclinic located in Lima, Peru. Prevalences were assessed, concordance was evaluated through the kappa index, and multivariable analyses were performed to identify associated factors for each.
Results: A total of 624 participants were included. Isolated values of FG, PPG, and HbA1c for prediabetes accounted for 7.1%, 10.6%, and 5% of cases, respectively, while the intersection of all three accounted for 39.7% of the total. For T2DM, isolated values were represented in 14.5%, 23.2%, and 8.7% of cases, respectively, while the intersection of all three accounted for 44.9%. The concordance between FG and PPG was 0.6970 (P < 0.001), between FG and HbA1c was 0.6163 (P < 0.001), and between PPG and HbA1c was 0.6903 (P < 0.001). Significant associations were found with factors such as gender, age, family history of T2DM, alcohol consumption, and hypertension.
Conclusions: The results revealed that PPG detected more cases in isolation, followed by FG and HbA1c. Comparison with previous studies showed variations in prevalence, underscoring the importance of considering multiple criteria in diagnosis.
Keywords: Diabetes mellitus; Prediabetic state; Epidemiologic factors; Public health
| Introduction | ▴Top |
Type 2 diabetes mellitus (T2DM) is a chronic metabolic disorder characterized by continually high amounts of sugar in the blood, resulting from changes in insulin production and/or action. This condition also impacts the processing of other carbohydrates, fats, and proteins. It poses a major public health issue due to its widespread nature and ongoing complications, making it one of the top sources of disability and death, in addition to affecting the quality of living of those suffering [1].
The incidence of T2DM has seen a considerable growth globally over the past few decades. In the United States, around 13% of the population experience the condition [2], while in China, its incidence amongst adult inhabitants has climbed from 4.7% in 1980 to 8.5% according to estimates [3]. In Latin America, an expected 62 million individuals are living with diabetes, a figure that has tripled throughout the region since 1980 [4], and in Peru, the illness influences approximately 7% of the total population predominantly amongst those over 30 years of age [5].
Determining when a person possesses diabetes relies on blood glucose levels being notably high. There are three main methods for diagnosing diabetes mellitus: fasting glucose (FG), glycated hemoglobin (HbA1c), and postprandial glucose (PPG). Each path has its own strengths and constraints, and which route is chosen could depend on the distinct group of people and medical circumstance [6].
The agreement between these diagnostic techniques is crucial for ensuring precise and timely identification of T2DM. However, harmony may not always exist when utilizing these methods to diagnose the same patient as either diabetic or non-diabetic. Discrepancies can surface owing to variances in the sensitivity and particularity of each technique, along with transformations in the populace studied and in their medical circumstances of the individuals [7-9]. Given the information among Peruvian residents remains limited [10], the objective of this study was to determine the prevalence and concordance among the three diagnostic forms of diabetes mellitus in a Peruvian sample.
| Materials and Methods | ▴Top |
Study design and context
This was a concordance study. Primary patient analysis was conducted at a polyclinic in Lima, Peru, from March 6 to June 10, 2023. The study followed the Standards for Reporting Diagnostic Accuracy Studies (STARD) guidelines [11].
Population, sample, and eligibility criteria
No sampling frame was available. The unit of analysis was the patient attending the healthcare center. The standards to join the group were: 1) individuals needed to be at an age of 45 years or more; 2) persons must go through all three diagnostic exams for adult-onset diabetes; 3) living in Lima to ensure returning for the next day’s results; and 4) compliance with the estimated time without food. Those not allowed were: 1) pregnant women; 2) refusal to sign the approved consent; 3) known medical problems affecting sugar levels; 4) using medicines that could change blood glucose amounts; 5) currently having treatment for elevated sugar; and 6) not being able to make an informed choice to participate.
Sample selection employed non-probabilistic consecutive sampling. All patients attending the clinic during the specified period and meeting the selection criteria were invited to participate.
Sample size
The sample size was calculated using a standard formula for estimating a proportion in an infinite population. Assuming an expected T2DM prevalence of 7% [12], and considering a 95% confidence interval (CI) and 2% precision, a sample size of 624 was calculated.
Anticipating a 50% rejection rate, a total of 936 participants were planned for evaluation. To reach this number, and assuming only 90% of approached individuals would meet the study’s eligibility criteria, a total of 1,040 individuals were invited to participate.
Data collection logistics allowed for an average of 10 people to be evaluated each day, from Monday to Saturday. To reach the required total, approximately 104 evaluation days were needed, extending the total recruitment and data collection period to about 4 months.
Variable definitions
Three different diagnostic methods for T2DM and prediabetes were evaluated. FG defined diabetes as an FG concentration of 126 mg/dL (7.0 mmol/L) or higher, and prediabetes as a concentration between 100 mg/dL (5.6 mmol/L) and 125 mg/dL (6.9 mmol/L). HbA1c diagnosed diabetes with a concentration of 6.5% or higher, and prediabetes with a concentration between 5.7% and 6.4%. PPG defined diabetes as a glucose concentration of 200 mg/dL (11.1 mmol/L) or higher, 2 h after an oral glucose load, and prediabetes as a concentration between 140 mg/dL (7.8 mmol/L) and 199 mg/dL (11.0 mmol/L), 2 h after an oral glucose load. These definitions are based on standard clinical practice guidelines, such as those from the American Diabetes Association (ADA) [6].
This study also assessed the concordance between various factors associated with T2DM and prediabetes. Evaluated factors included age (categorized as under 60 and over 60), gender (male vs. female), alcohol consumption in the last 30 days (yes vs. no), smoking activity in the last 30 days (yes vs. no), consumption of ≥ 5 servings of fruits/vegetables (yes vs. no), and physical activity, measured through the International Physical Activity Questionnaire (IPAQ) and categorized as light/moderate vs. vigorous. Family history of T2DM (yes vs. no), presence of obesity, measured by body mass index (BMI), and presence of arterial hypertension were also considered.
Data collection and procedure
A campaign was organized offering a T2DM or prediabetes diagnostic program. Participants were instructed to arrive fasting, with a fasting period of 8 to 12 h maximum. On day 1, upon arrival, patients were directed to the laboratory for blood analysis, including the process for PPG. On day 2, patients returned the next day to collect their test results. At that time, weight and height were measured, and they were evaluated by a physician who collected clinical history data and informed them of the test results. If any test showed values above the cutoff for diabetes, a retest was indicated. Finally, they were invited to participate in the study, explained its details, and given the informed consent form. If they agreed to participate, they were invited to sign the document.
Regarding data collection, staff were trained in the proper collection of patient data, whether or not they eventually participated in the study. All collected data were recorded in a manually filled-out medical history. Height was measured with a stadiometer, while weight was measured with an electronic scale, after instructing the subject to wear light clothing. Blood pressure was measured after a 5-min rest period, using an OMRON automatic monitor.
Blood samples were drawn by a specialized laboratory technical team. Before extraction, it was carefully verified that participants had complied with the required fasting period. A total of 5 mL of venous blood sample was drawn to evaluate FG. Then, an oral load of 75 g of anhydrous glucose, dissolved in a volume of 300 mL, was administered as part of the glucose tolerance test [6]. Two hours after glucose ingestion, a new blood sample was obtained to measure PPG levels. Immediately after extraction, in both cases, the blood sample was centrifuged for 5 min to separate the serum. This serum was then processed in an automatic Chemray 240 machine to obtain precise glucose measurements.
Statistical analysis
Statistical analyses were performed using R software version 4.0.5. Initially, a descriptive analysis was developed, summarizing categorical variables in absolute terms and percentages.
Factors associated with T2DM and prediabetes were evaluated through bivariate and multivariable regression analysis. Adjusted prevalence ratios (aPRs) with their respective 95% CIs were calculated. For these calculations, generalized linear models with robust variance estimation were used, assuming a Poisson distribution with logarithmic link functions.
Additionally, a Venn diagram and a concordance analysis were conducted to assess the consistency between different diagnostic methods for both outcomes.
Ethical considerations
The study protocol was approved by the ethics committee of the Ricardo Palma University School of Medicine (Committee Code: PI 009 2023), and the corresponding permission was obtained from the polyclinic where the diagnostic campaign was conducted. The purchase of materials and reagents necessary for the campaign was funded by the principal investigator before the study began, ensuring that all resources were available and that there were no conflicts of interest related to funding. To ensure participant confidentiality and anonymity, no sensitive personal data (such as names, identity document numbers, etc.) were requested. The database was handled with the utmost discretion, being accessible only by the principal investigator and the authorized research team.
Each participant was given an informed consent form, detailing the study’s purpose, procedures, risks, and benefits. Participants who agreed to participate had to mark the option “I have read the consent form and agree with it.” The entire research process was carried out in compliance with the Helsinki Declaration.
| Results | ▴Top |
A total of 624 participants were included in the study. The prevalence of prediabetes was 22.60%, and the prevalence of diabetes was 11.38%. Physical activity showed a trend towards low activity, with 80.45% of participants falling into this category. Regarding BMI, 37.52% of participants were classified as obese. Alcohol and tobacco consumption were relatively low, at 26.28% and 26.92%, respectively. Additionally, 33.97% of participants reported consuming five or more servings of fruits/vegetables per day, and 24.52% were classified with hypertension (HTN) (Table 1).
 Click to view | Table 1. Characteristics of the Study Sample |
The prevalence of prediabetes, according to FG, PPG, and HbA1c, was 17.72%, 20.98%, and 16.64%, respectively. For diabetes, the prevalence was 7.21%, 8.17%, and 6.57%, respectively (Fig. 1).
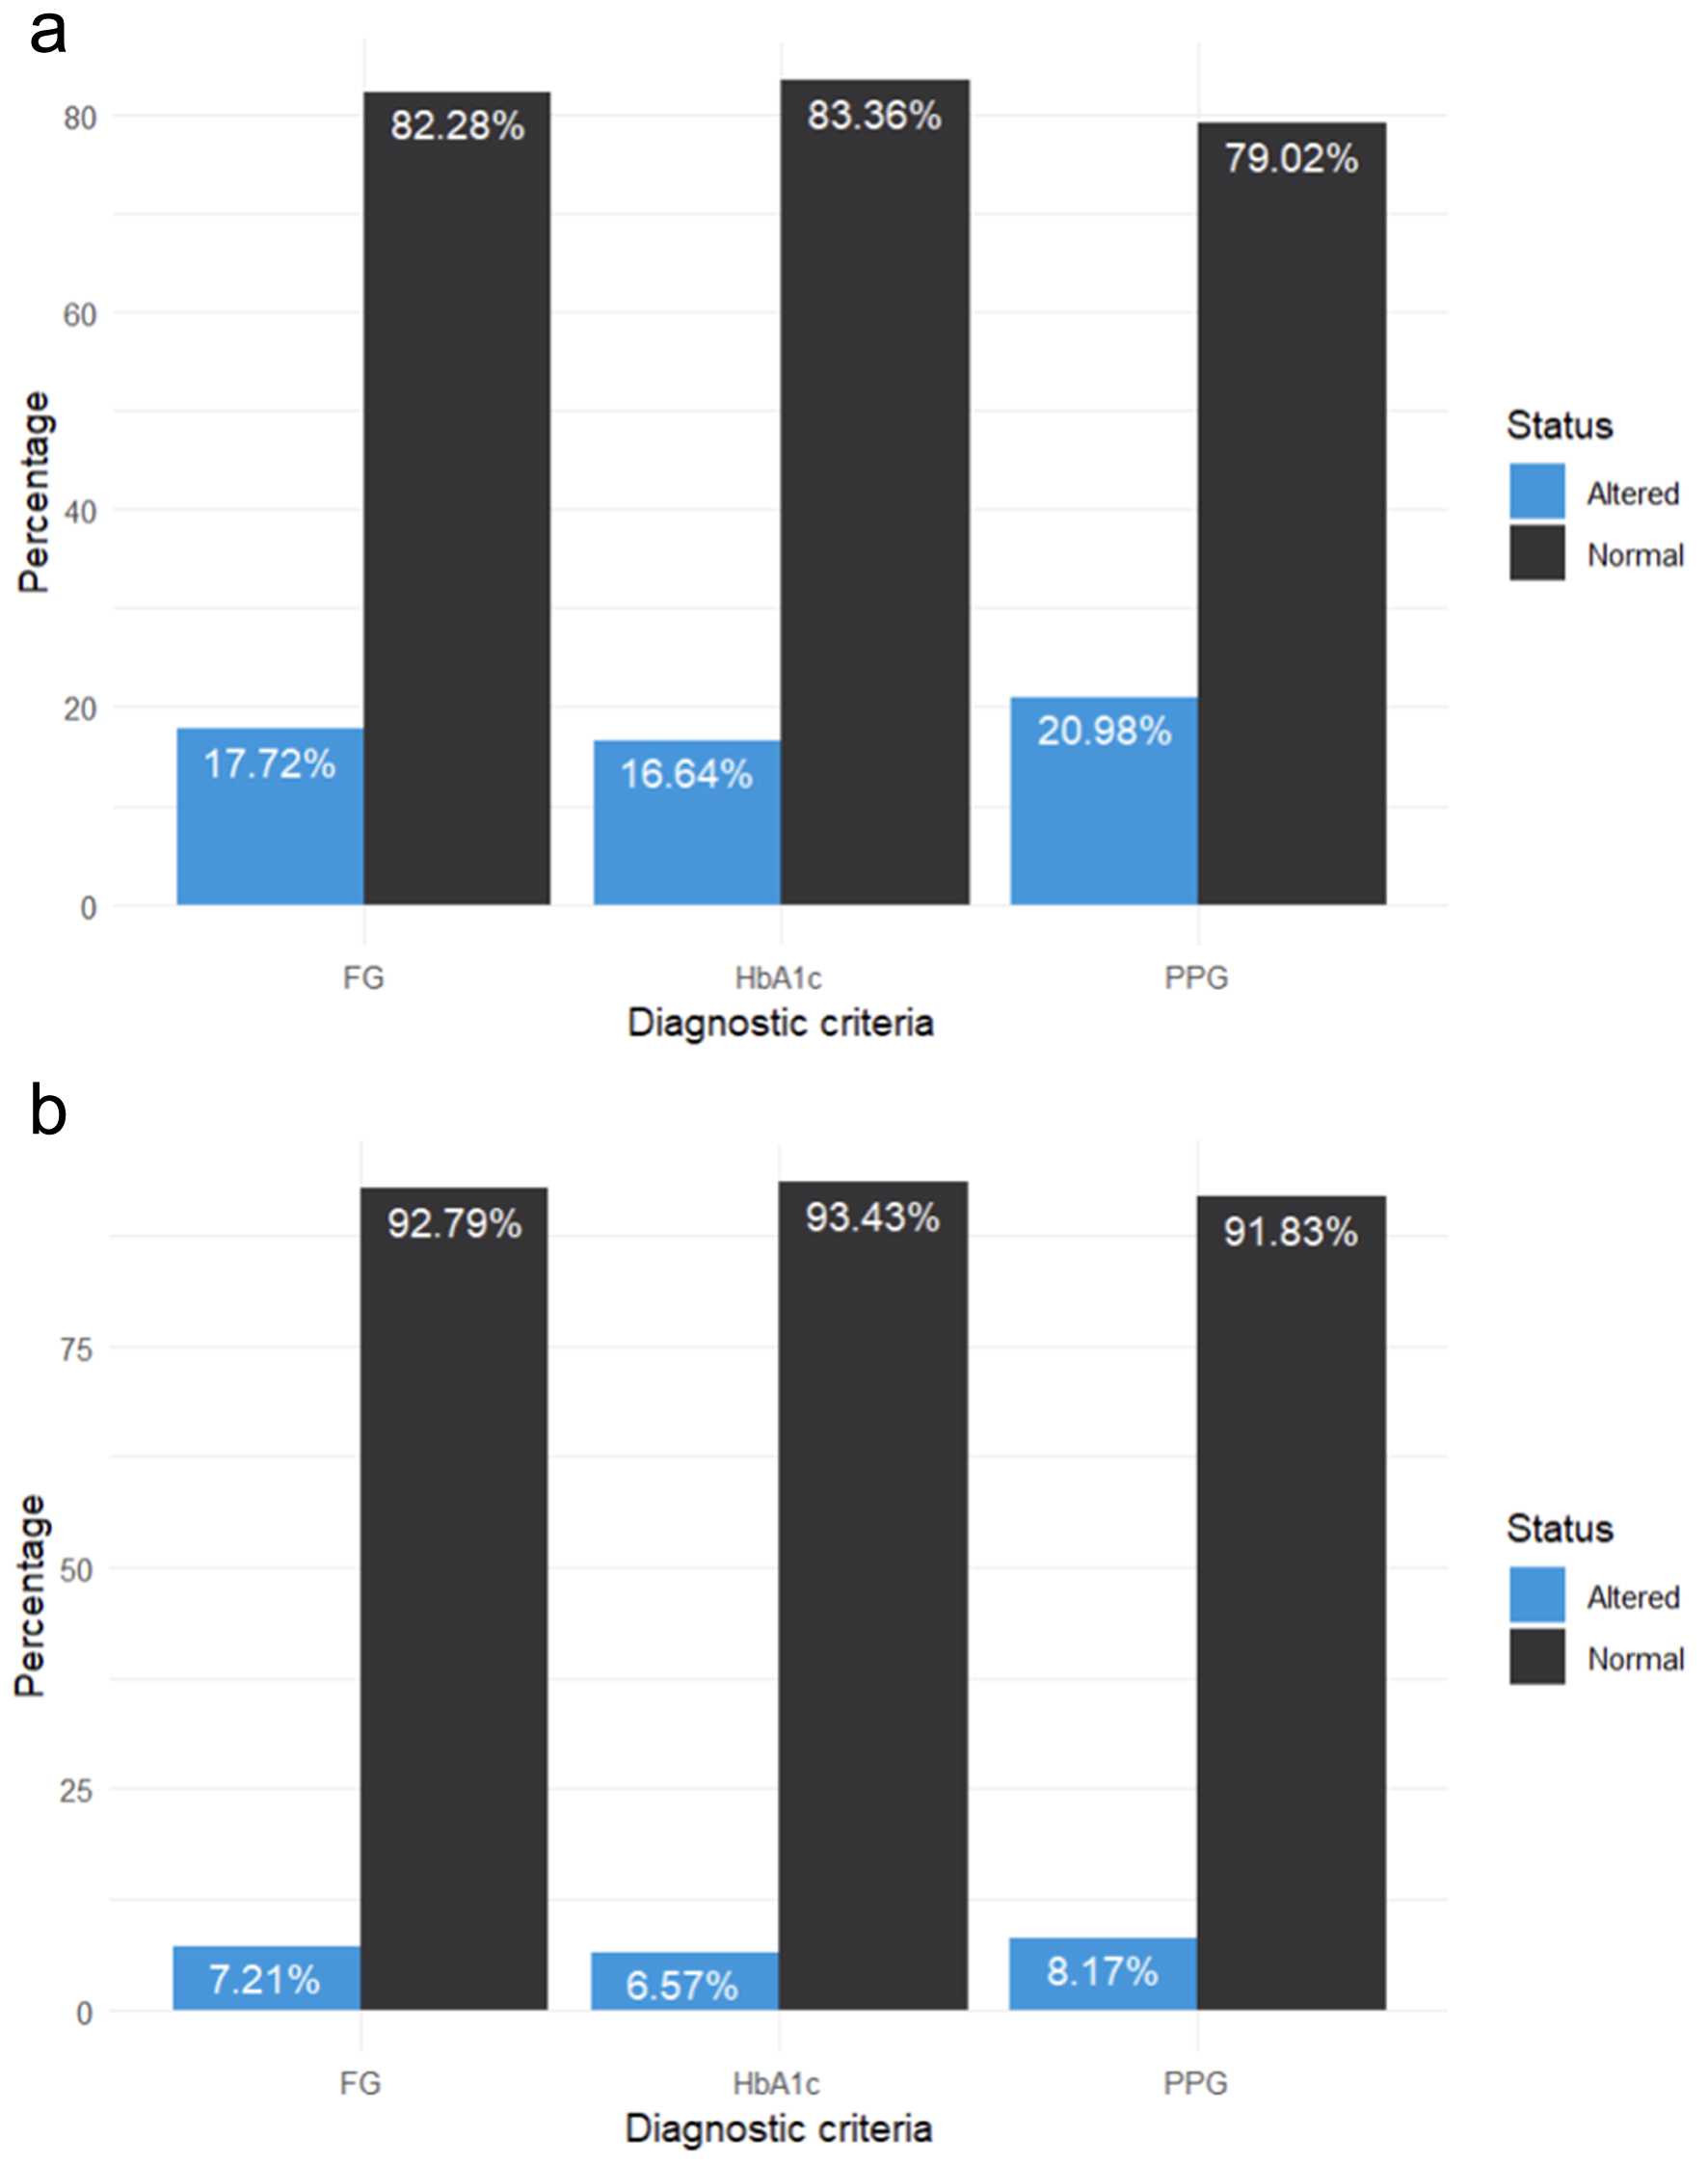 Click for large image | Figure 1. Prevalence of each diagnostic criterion for (a) prediabetes and (b) diabetes. |
Significant associations with prediabetes were found based on the diagnostic criteria used in our study. Men showed a higher prevalence of prediabetes compared to women (aPR: 4.6; 95% CI: 1.27 - 16.7 for FG, aPR: 2.04; 95% CI: 0.83 - 4.99 for PPG, and aPR: 2.57; 95% CI: 0.81 - 8.09 for HbA1c). The age group of 60 years or older showed a higher prevalence compared to the 45 to 59 years group (aPR: 10.9; 95% CI: 1.60 - 74.5 for FG, aPR: 4.61; 95% CI: 1.52 - 14.0 for PPG, and aPR: 1.81; 95% CI: 0.73 - 4.51 for HbA1c). A family history of T2DM was associated with higher prevalence (aPR: 3.78; 95% CI: 1.40 - 10.2 for FG, aPR: 3.95; 95% CI: 1.79 - 8.71 for PPG, and aPR: 6.59; 95% CI: 1.63 - 26.6 for HbA1c). Daily smokers showed a higher prevalence (aPR: 5.31; 95% CI: 1.53 - 18.5 for FG, aPR: 2.48; 95% CI: 1.10 - 5.56 for PPG, and aPR: 1.77; 95% CI: 0.81 - 3.87 for HbA1c). Alcohol consumption was also associated with higher prevalence (aPR: 2.05; 95% CI: 1.04 - 4.05 for FG, aPR: 4.41; 95% CI: 1.81 - 10.8 for PPG, and aPR: 7.36; 95% CI: 2.19 - 24.7 for HbA1c). HTN was associated with higher prevalence across all criteria (aPR: 4.34; 95% CI: 1.36 - 13.9 for FG, aPR: 3.12; 95% CI: 1.34 - 7.25 for PPG, and aPR: 4.38; 95% CI: 1.18 - 16.2 for HbA1c) (Table 2).
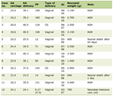
Click to view | Table 2. Bivariate and Multivariate Analysis of the Factors Associated With Prediabetes According to the FG, PPG and HbA1c |
In our study on diabetes, several significant associations were found. Men showed a higher prevalence of diabetes compared to women (aPR: 4.6; 95% CI: 1.27 - 16.7 for FG, aPR: 2.04; 95% CI: 0.83 - 4.99 for PPG, and aPR: 2.57; 95% CI: 0.81 - 8.09 for HbA1c). The age group of 60 years or older showed a higher prevalence compared to the 45 to 59 years group (aPR: 10.9; 95% CI: 1.60 - 74.5 for FG, aPR: 4.61; 95% CI: 1.52 - 14.0 for PPG, and aPR: 1.81; 95% CI: 0.73 - 4.51 for HbA1c). A family history of T2DM was associated with higher prevalence (aPR: 3.78; 95% CI: 1.40 - 10.2 for FG, aPR: 3.95; 95% CI: 1.79 - 8.71 for PPG, and aPR: 6.59; 95% CI: 1.63 - 26.6 for HbA1c). Daily smokers showed a higher prevalence (aPR: 5.31; 95% CI: 1.53 - 18.5 for FG, aPR: 2.48; 95% CI: 1.10 - 5.56 for PPG, and aPR: 1.77; 95% CI: 0.81 - 3.87 for HbA1c). Alcohol consumption was also associated with higher prevalence (aPR: 2.05; 95% CI: 1.04 - 4.05 for FG, aPR: 4.41; 95% CI: 1.81 - 10.8 for PPG, and aPR: 7.36; 95% CI: 2.19 - 24.7 for HbA1c). HTN was associated with higher prevalence across all criteria (aPR: 4.34; 95% CI: 1.36 - 13.9 for FG, aPR: 3.12; 95% CI: 1.34 - 7.25 for PPG, and aPR: 4.38; 95% CI: 1.18 - 16.2 for HbA1c) (Table 3).
Click to view | Table 3. Bivariate and Multivariate Analysis of the Factors Associated With Diabetes According to the FG, PPG and HbA1c |
In the Venn diagram of Figure 2, the values for FG, PPG, and HbA1c for prediabetes were represented in isolation in 7.1%, 10.6%, and 5% of cases, respectively, while the intersection of the three criteria accounted for 39.7% of cases. For T2DM, they were represented in isolation in 14.5%, 23.2%, and 8.7% of cases, respectively. The intersection of the three criteria was 44.9% of the total.
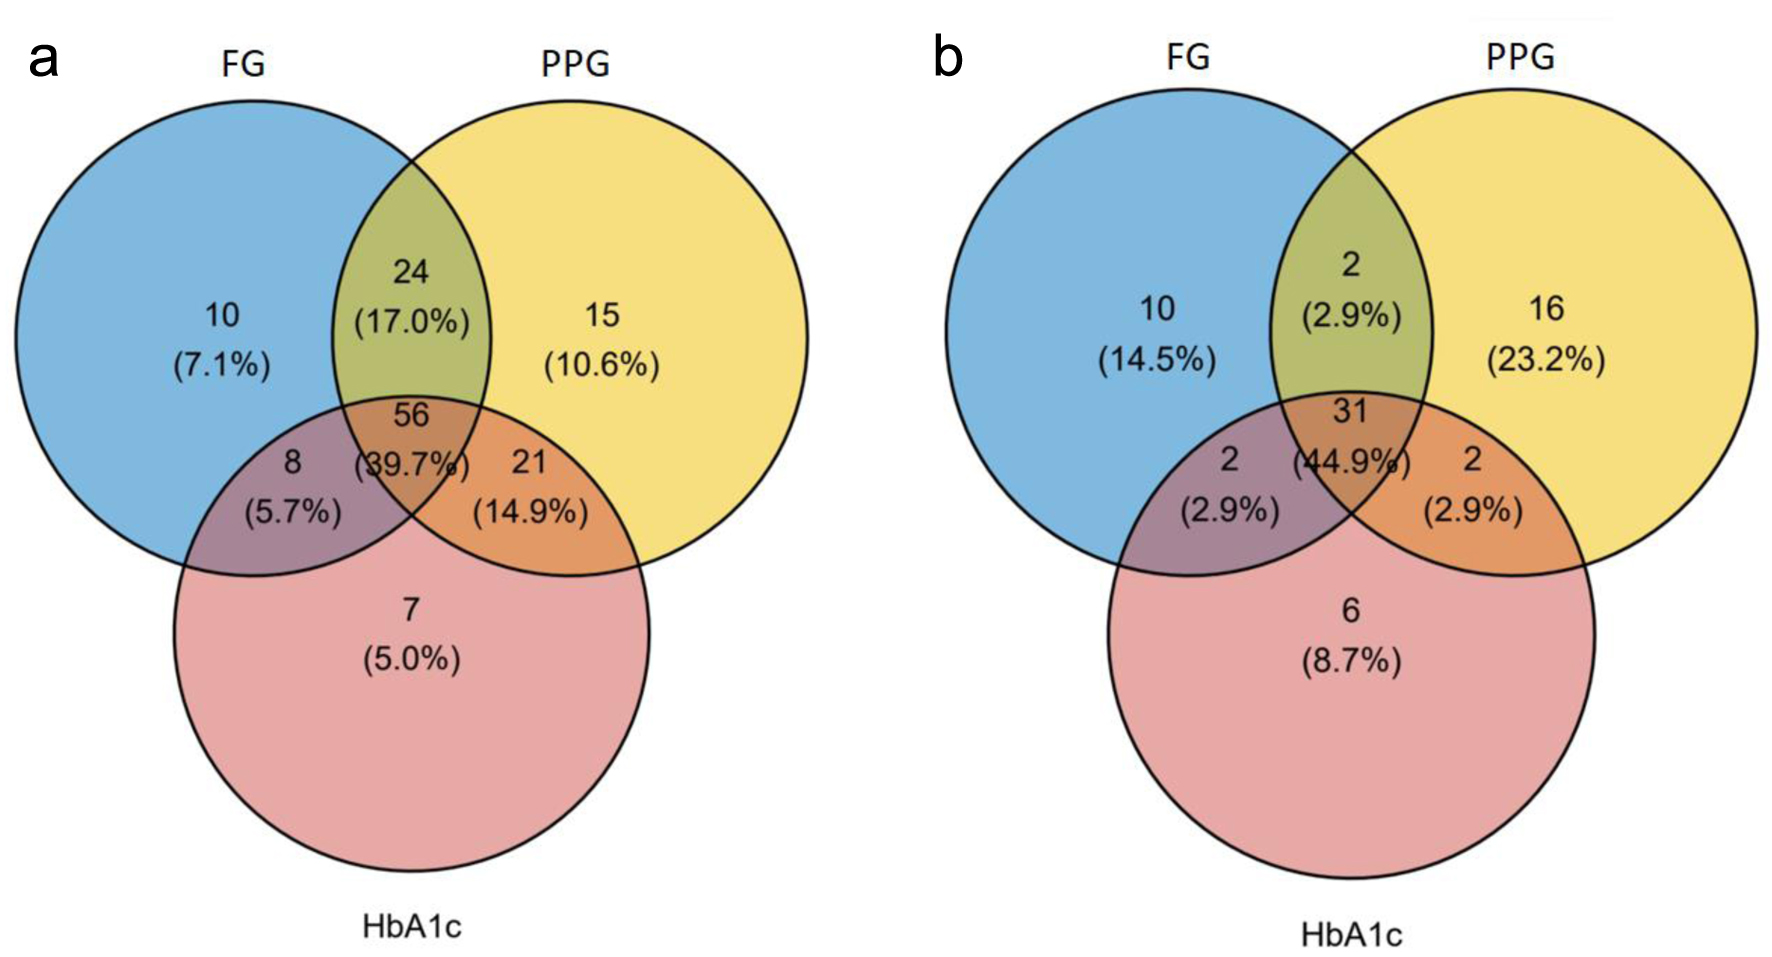 Click for large image | Figure 2. Venn diagram of diagnostic criteria for prediabetes (a) and diabetes (b). |
Concordance among the three criteria was evaluated through the kappa index. The concordance between FG and PPG was 0.6970 (P < 0.001). The concordance between FG and HbA1c was 0.6163 (P < 0.001). Finally, the concordance between PPG and HbA1c was 0.6903 (P < 0.001) (Table 4).
Click to view | Table 4. Concordance of Prediabetes Diagnoses Considering FG, PPG, and HbA1c |
The concordance among the three diagnostic criteria was evaluated using the kappa index. The concordance between FG and PPG was 0.6616 (P < 0.001). The concordance between FG and HbA1c was 0.7503 (P < 0.001). Lastly, the concordance between PPG and HbA1c was 0.6952 (P < 0.001) (Table 5).
Click to view | Table 5. Concordance of Diabetes Diagnoses Considering FG, PPG, and HbA1c |
| Discussion | ▴Top |
Main findings
In this study, we focused on checking how well different tests for the diagnoses of prediabetes and diabetes, like FG, PPG and HbA1c, match. What we found showed big changes in how many have not-quite or all the way diabetes depending on the test, along with ties to things like whether someone was male or female, their age, family history, tobacco and alcohol use, and high blood pressure. These results underline how important it is to use many ways to check and think hard about diagnosis, matching what others found about how twisted the tests can be.
Comparison with other studies
Research in Chinese individuals with non-sudden coronary syndrome contrasted the ADA and WHO diagnostic requirements for diabetes and prediabetes [7]. It was revealed that the ADA benchmarks, which involve HbA1c testing, uncovered more patients with previously unknown diabetes and prediabetes compared to WHO guidelines [7]. This proposes that regular HbA1c screening may be vital for inspecting patients with glucose metabolism irregularities before arranged coronary angiography.
In a group study in China, the ability of early pregnancy HbA1c levels to forecast gestational diabetes was investigated. It was uncovered that HbA1c levels at the beginning of pregnancy could be applied to anticipate gestational diabetes, and the chance of gestational diabetes substantially expanded in expecting ladies with early pregnancy HbA1c levels past 5.9% [13].
An exploration into the divergent attributes and evaluations for diabetes by diverse standards amid numerous eras found that amongst more seasoned persons, the after-dinner glucose test furnished the most precise outcomes. The examination inspected the contrasts in clinical highlights and rates of being analyzed with diabetes mellitus as per shifting principles between age gatherings. It was seen that amongst those further along in years, the blood glucose level after dinner was the most precise sign of whether the individual had the illness. The investigation looked at the distinctions between the clinical attributes and how regularly diabetes was analyzed subject to changing benchmarks separated into various age bunches. It was discovered that for more established patients, when assessing expenses and ease, employing both FG and HbA1c could significantly boost the ability to diagnose relative to exclusively utilizing FG [9].
The research led by Menke along with others in America discovered the FG reading played the most notable role in how common prediabetes was for most people there, followed by the HbA1c level and then the PPG level. Variances also appeared regarding how much each sign added depending on gender, age, ethnicity or race, and weight classifications [14].
In closing, these investigations propose that each diagnostic approach has its own strengths and weaknesses. In some scenarios, combining various methods can boost the correctness of identifying diabetes. In the recent document, it was uncovered that glucose after eating detected more persons solely, accompanied by glucose in the morning and after that glucose after eating. These discoveries assist the notion that the selection of a diagnostic approach may rely on the exact population and medical situation [9].
It was noticed that PPG was most adept at picking up on instances by themselves regarding both conditions, accompanied by FG and HbA1c. This pattern can be credited to PPG’s responsiveness in perceiving shifts in glucose policy that might not be noticeable in FG and HbA1c calculations. Indeed, preceding investigations have realized the capability that PPG possesses. For example, in the work by Cowie et al [15], NCD-RisC [16], and Aekplakorn et al [17], it was found that, for undiagnosed diabetes, PPG identifies quite a more significant group with the disagreement, counting most people who were recognized utilizing HbA1c or PPG. Additionally, classically, PPG has been considered the gold standard for the diagnosis of T2DM in some studies, as it has been shown to be an important indicator of glycemic control in diabetic patients [18]. Physiologically, it more directly reflects the body’s response to glucose intake, which can reveal dysfunctions in glucose regulation that other methods do not detect [18].
Distinctions have emerged between characteristics in certain groups. Several previous analyses had revealed an inequitable finding that HbA1c tended to run higher amidst Black people in comparison to non-Hispanic White individuals inclusive of those both with and without diabetes, even at equivalent levels of FG and PPG [19-21]. Additionally, some studies displayed that FG could be higher in males and PPG higher in females among folks without diabetes [22]. These average variances in glucose markers may indicate a difference in which marker identifies the biggest proportion with prediabetes in diverse subgroups within the population.
Associated factors
Our investigation into the condition of prediabetes uncovered several notable connections that highlight the complexity of this issue. Older age, usage of alcohol and tobacco, obesity, and high blood pressure were linked to a higher occurrence of prediabetes across diverse diagnostic standards. These discoveries align with earlier examinations that pinpointed similar elements as key risks for prediabetes. For example, one study in the nation of Korea found differences between sexes in the factors related to prediabetes, where a family ancestry of T2DM and a lower level of learning in females demonstrated a higher chance [23]. An alternate examination in the country of Malaysia emphasized the importance of early detection and lifestyle changes to stop the development of diabetes [24]. Understanding these components is crucial for developing powerful prevention and remedies in public health.
The diabetes-linked elements differed dependent on the diagnostic standards applied. Those with a family history, daily smokers, drinkers, and individuals facing high blood pressure were more susceptible, as more men had it and so too did groups in their 60s who have advanced in years. These results align with prior knowledge. For instance, one examination in Vietnam detected age, weight index numbers, waist measurement differences, high blood pressure, education levels, and occupations as things straight joined to diabetes [25]. The frequency of diabetes and prediabetes in Bangladesh correlated with age, identifying as male, overweightness/obesity, and high blood pressure [26]. Recognizing these linked factors is essential for early discovery and interference in diabetes, which can have a major influence on public health and avoiding long-term problems.
Public health importance
Our discoveries from analyzing how prediabetes and diabetes are defined have major importance for peoples’ well-being. It is truly vital to correctly and promptly realize these energy troubles for keeping future major issues like heart issues, kidney sickness, and diabetic eye illness from happening or becoming worse.
The outcomes relating to how well any individual standard could singlehandedly identify those impacted emphasize the necessity of employing multiple metrics in diagnostic evaluation, as each possesses its own strengths and constraints. Furthermore, comprehending the alignment between these benchmarks can advise health policies and clinical guidelines, making certain that assets are utilized productively and those suffering receive the proper care initially in the condition’s progression. Ultimately, these discoveries can contribute to improving quality of life for those impacted and decreasing the monetary burden of diabetes on healthcare systems.
Limitations
First, the outcomes may only apply to this group and area, limiting how it could help elsewhere. Second, knowing where each person was in the disease adds complexity since no one knew they had it yet. This affects how we view the results. Third, as it screened for prediabetes and diabetes, it may have drawn folks with suspicions or health worries more, perhaps skewing the high numbers seen for both conditions. These restrictions point to a need for more studies and approaches to fully grasp how well diagnosis matched prediabetes and diabetes and what factors were linked.
Conclusions
In summary, our study provides detailed insights into the concordance and associated factors in the diagnosis of prediabetes and diabetes using different diagnostic criteria. The findings highlight the importance of PPG as a more effective isolated screening method, followed by FG and HbA1c. Early and accurate detection of prediabetes and diabetes is crucial for the prevention and effective management of these conditions, and our study contributes to the understanding of how different criteria can be applied in different public health contexts. The implementation of evidence-based screening strategies, along with the consideration of epidemiological and public health factors, can further enhance the detection and management of these chronic diseases, which are a growing concern in global health.
Acknowledgments
We would like to express our sincere gratitude to the doctors, nurses, and technicians from the polyclinic for their unwavering support and professionalism during the campaign. We are also deeply thankful to the participants of this study for their invaluable contribution and steadfast support.
Financial Disclosure
None to declare.
Conflict of Interest
The authors declare no conflict of interest.
Informed Consent
Informed consents have been obtained from participants.
Author Contributions
Conceptualization: Victor Juan Vera-Ponce, Joan A. Loayza-Castro. Project design: Fiorella E. Zuzunaga-Montoya, Luisa Erika Milagros Vasquez-Romero, Willy Ramos, Mario J. Valladares-Garrido. Data collection: Fiorella E. Zuzunaga-Montoya, Cori Raquel Iturregui Paucar. Formal analysis: Victor Juan Vera-Ponce. Research: Luisa Erika Milagros Vasquez-Romero, Joan A. Loayza-Castro. Methodology: Victor Juan Vera-Ponce. Project administration: Victor Juan Vera-Ponce. Resources: Jhony A. De La Cruz-Vargas. Software: Victor Juan Vera-Ponce. Supervision: Jhony A. De La Cruz-Vargas. Writing - original draft: Victor Juan Vera-Ponce, Luisa Erika Milagros Vasquez-Romero, Cori Raquel Iturregui Paucar, Mario J. Valladares-Garrido, Willy Ramos, Norka Rocio Guillen Ponce, Jhony A. De La Cruz-Vargas. Writing - review and editing: Fiorella E. Zuzunaga-Montoya, Joan A. Loayza-Castro, Cori Raquel Iturregui Paucar, Mario J. Valladares-Garrido, Willy Ramos, Norka Rocio Guillen Ponce, Jhony A. De La Cruz-Vargas.
Data Availability
The data supporting the findings of this study are available from the corresponding author upon reasonable request.
| References | ▴Top |
- Diabetes Canada Clinical Practice Guidelines Expert Committee, Punthakee Z, Goldenberg R, Katz P. Definition, classification and diagnosis of diabetes, prediabetes and metabolic syndrome. Can J Diabetes. 2018;42(Suppl 1):S10-S15.
doi pubmed - Organizacion Mundial de la Salud. Informe mundial sobre la diabetes [Internet]. Ginebra: Organizacion Mundial de la Salud. 2016 [citado el 10 de noviembre de 2021]. p. 86. Disponible en: https://apps.who.int/iris/handle/10665/254649.
- Diabetes - OPS/OMS | Organizacion Panamericana de la Salud [Internet]. [citado el 13 de agosto de 2023]. Disponible en: https://www.paho.org/es/temas/diabetes.
- El Informe Nacional de Estadisticas de la Diabetes, 2020 | Diabetes | CDC [Internet]. 2020 [citado el 13 de agosto de 2023]. Disponible en: https://www.cdc.gov/diabetes/spanish/resources/statistics-report.html.
- Carrillo-Larco RM, Bernabe-Ortiz A. [Type 2 diabetes mellitus in peru: a systematic review of prevalence and incidence in the general population]. Rev Peru Med Exp Salud Publica. 2019;36(1):26-36.
doi pubmed pmc - American Diabetes Association Releases 2023 Standards of Care in Diabetes to Guide Prevention, Diagnosis, and Treatment for People Living with Diabetes | ADA [Internet]. [citado el 5 de agosto de 2023]. Disponible en: https://diabetes.org/newsroom/press-releases/2022/american-diabetes-association-2023-standards-care-diabetes-guide-for-prevention-diagnosis-treatment-people-living-with-diabetes.
- Zhao X, Ye Y, Zhang S. [The values of the new American Diabetes Association Diagnostic Criteria for screening of pre-diabetes and diabetes in patients undergoing elective coronary angiography]. Zhonghua Nei Ke Za Zhi. 2015;54(4):302-306.
pubmed - Sitasuwan T, Lertwattanarak R. Prediction of type 2 diabetes mellitus using fasting plasma glucose and HbA1c levels among individuals with impaired fasting plasma glucose: a cross-sectional study in Thailand. BMJ Open. 2020;10(11):e041269.
doi pubmed pmc - Joung KH, Ju SH, Kim JM, Choung S, Lee JM, Park KS, Kim HJ, et al. Clinical implications of using post-challenge plasma glucose levels for early diagnosis of type 2 diabetes mellitus in older individuals. Diabetes Metab J. 2018;42(2):147-154.
doi pubmed pmc - Albitres-Flores L, Bernabe-Ortiz A. Diagnostic accuracy of ADA 2020 criteria for undiagnosed diabetes in a Peruvian population. Diabetes Res Clin Pract. 2020;169:108475.
doi pubmed - Cohen JF, Korevaar DA, Altman DG, Bruns DE, Gatsonis CA, Hooft L, Irwig L, et al. STARD 2015 guidelines for reporting diagnostic accuracy studies: explanation and elaboration. BMJ Open. 2016;6(11):e012799.
doi pubmed pmc - Seclen SN, Rosas ME, Arias AJ, Huayta E, Medina CA. Prevalence of diabetes and impaired fasting glucose in Peru: report from PERUDIAB, a national urban population-based longitudinal study. BMJ Open Diabetes Res Care. 2015;3(1):e000110.
doi pubmed pmc - Sun J, Chai S, Zhao X, Yuan N, Du J, Liu Y, Li Z, et al. Predictive value of first-trimester glycosylated hemoglobin levels in gestational diabetes mellitus: a Chinese population cohort study. J Diabetes Res. 2021;2021:5537110.
doi pubmed pmc - Menke A, Casagrande S, Cowie CC. Contributions of A1c, fasting plasma glucose, and 2-hour plasma glucose to prediabetes prevalence: NHANES 2011-2014. Ann Epidemiol. 2018;28(10):681-685.e682.
doi pubmed - Cowie CC, Rust KF, Byrd-Holt DD, Gregg EW, Ford ES, Geiss LS, Bainbridge KE, et al. Prevalence of diabetes and high risk for diabetes using A1C criteria in the U.S. population in 1988-2006. Diabetes Care. 2010;33(3):562-568.
doi pubmed pmc - N. C. D. Risk Factor Collaboration. Effects of diabetes definition on global surveillance of diabetes prevalence and diagnosis: a pooled analysis of 96 population-based studies with 331,288 participants. Lancet Diabetes Endocrinol. 2015;3(8):624-637.
doi pubmed pmc - Aekplakorn W, Tantayotai V, Numsangkul S, Sripho W, Tatsato N, Burapasiriwat T, Pipatsart R, et al. Detecting prediabetes and diabetes: agreement between fasting plasma glucose and oral glucose tolerance test in Thai adults. J Diabetes Res. 2015;2015:396505.
doi pubmed pmc - Jagannathan R, Neves JS, Dorcely B, Chung ST, Tamura K, Rhee M, Bergman M. The oral glucose tolerance test: 100 years later. Diabetes Metab Syndr Obes. 2020;13:3787-3805.
doi pubmed pmc - Herman WH, Ma Y, Uwaifo G, Haffner S, Kahn SE, Horton ES, Lachin JM, et al. Differences in A1C by race and ethnicity among patients with impaired glucose tolerance in the Diabetes Prevention Program. Diabetes Care. 2007;30(10):2453-2457.
doi pubmed pmc - Kirk JK, D'Agostino RB, Jr., Bell RA, Passmore LV, Bonds DE, Karter AJ, Narayan KM. Disparities in HbA1c levels between African-American and non-Hispanic white adults with diabetes: a meta-analysis. Diabetes Care. 2006;29(9):2130-2136.
doi pubmed pmc - Ziemer DC, Kolm P, Weintraub WS, Vaccarino V, Rhee MK, Twombly JG, Narayan KM, et al. Glucose-independent, black-white differences in hemoglobin A1c levels: a cross-sectional analysis of 2 studies. Ann Intern Med. 2010;152(12):770-777.
doi pubmed - Menke A, Rust KF, Savage PJ, Cowie CC. Hemoglobin A1c, fasting plasma glucose, and 2-hour plasma glucose distributions in U.S. population subgroups: NHANES 2005-2010. Ann Epidemiol. 2014;24(2):83-89.
doi pubmed pmc - Ra JS. Sex differences in factors associated with prediabetes in Korean adults. Osong Public Health Res Perspect. 2022;13(2):142-152.
doi pubmed pmc - Rahim FF, Abdulrahman SA, Kader Maideen SF, Rashid A. Prevalence and factors associated with prediabetes and diabetes in fishing communities in penang, Malaysia: A cross-sectional study. PLoS One. 2020;15(2):e0228570.
doi pubmed pmc - Phan DH, Vu TT, Doan VT, Le TQ, Nguyen TD, Van Hoang M. Assessment of the risk factors associated with type 2 diabetes and prediabetes mellitus: A national survey in Vietnam. Medicine (Baltimore). 2022;101(41):e31149.
doi pubmed pmc - Hossain MB, Khan MN, Oldroyd JC, Rana J, Magliago DJ, Chowdhury EK, Karim MN, et al. Prevalence of, and risk factors for, diabetes and prediabetes in Bangladesh: Evidence from the national survey using a multilevel Poisson regression model with a robust variance. PLOS Glob Public Health. 2022;2(6):e0000461.
doi pubmed pmc
This article is distributed under the terms of the Creative Commons Attribution Non-Commercial 4.0 International License, which permits unrestricted non-commercial use, distribution, and reproduction in any medium, provided the original work is properly cited.
Journal of Endocrinology and Metabolism is published by Elmer Press Inc.