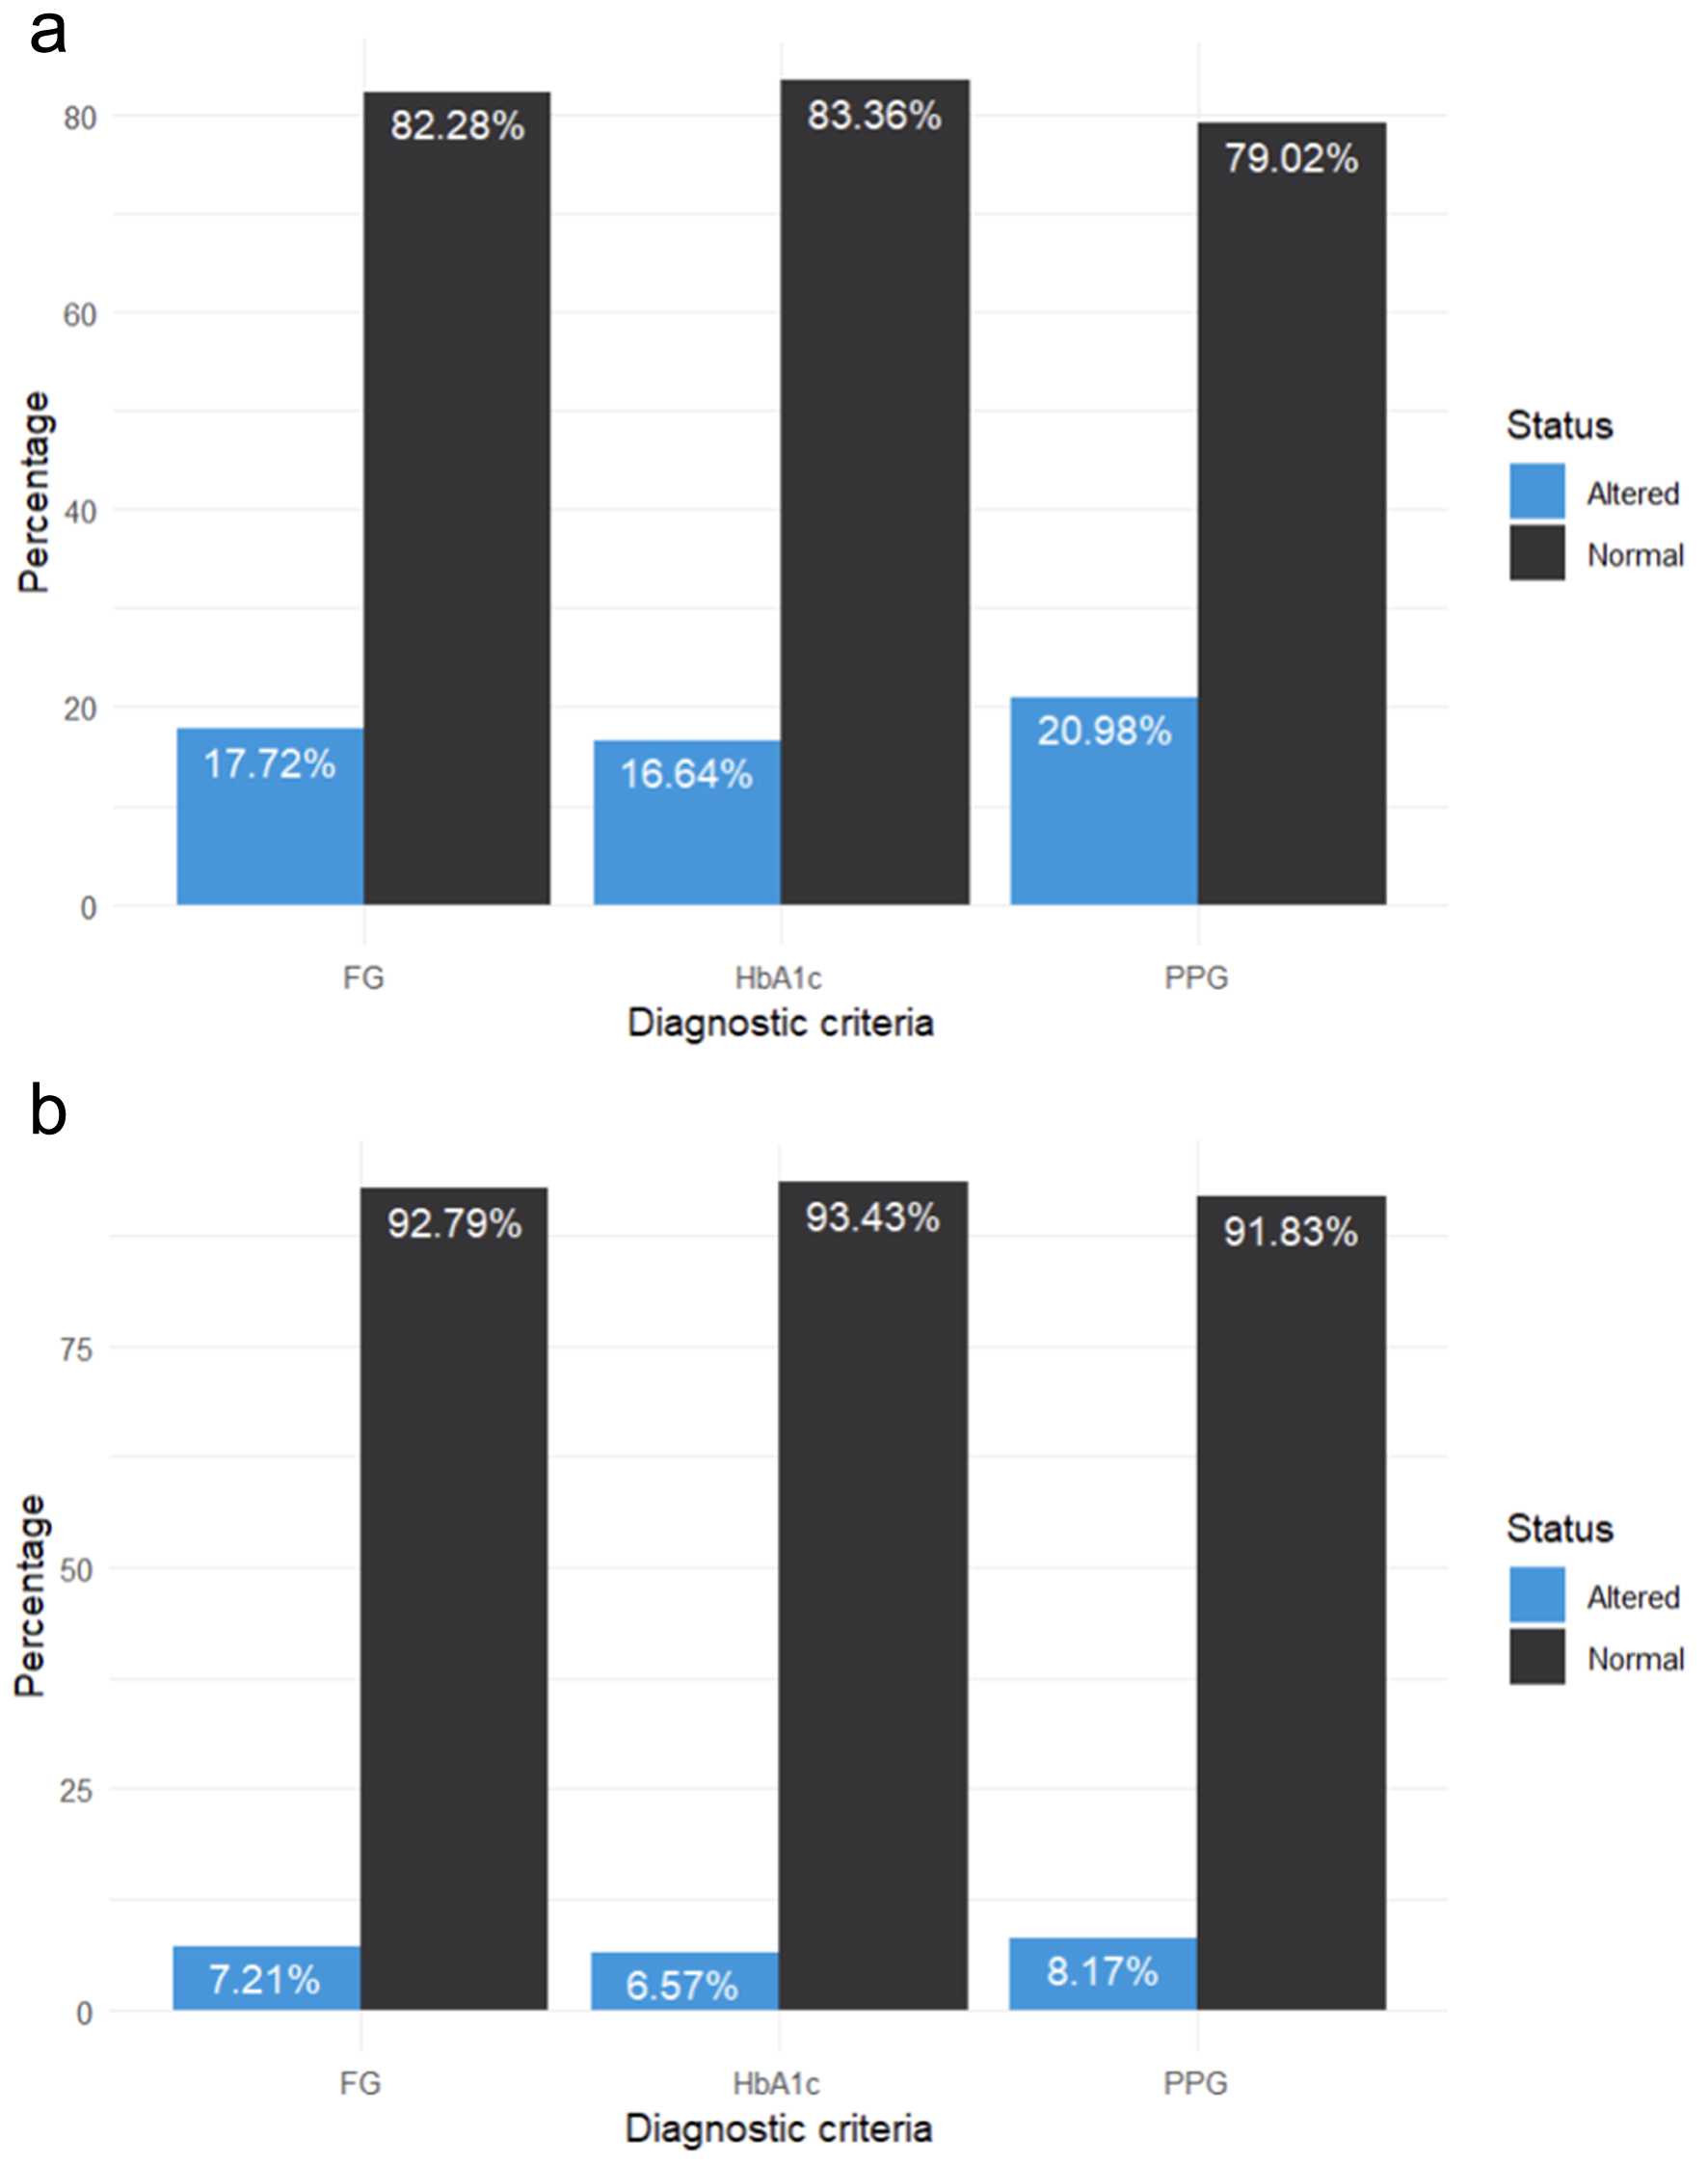
Figure 1. Prevalence of each diagnostic criterion for (a) prediabetes and (b) diabetes.
| Journal of Endocrinology and Metabolism, ISSN 1923-2861 print, 1923-287X online, Open Access |
| Article copyright, the authors; Journal compilation copyright, J Endocrinol Metab and Elmer Press Inc |
| Journal website https://www.jofem.org |
Original Article
Volume 14, Number 1, February 2024, pages 48-58
Concordance and Associated Factors in Diagnostic Criteria for Prediabetes and Diabetes: An Analysis of Fasting Glucose, Postprandial Glucose, and Glycated Hemoglobin
Figures
Tables
| Characteristics | n = 624 |
|---|---|
| Data are expressed as n (%). T2DM: type 2 diabetes mellitus. | |
| Sex | |
| Female | 316 (50.64%) |
| Male | 308 (49.36%) |
| Age group | |
| 45 to 59 years | 301 (48.24%) |
| 60 years and older | 323 (51.76%) |
| History of T2DM | |
| No | 431 (69.07%) |
| Yes | 193 (30.93%) |
| Smoking activity | |
| No | 456 (73.08%) |
| Yes | 168 (26.92%) |
| Alcohol consumption | |
| No | 460 (73.72%) |
| Yes | 164 (26.28%) |
| Physical activity | |
| Low | 502 (80.45%) |
| Moderate/vigorous | 122 (19.55%) |
| Obesity | |
| No | 388 (62.48%) |
| Yes | 233 (37.52%) |
| Consumption ≥ 5 servings of fruits/vegetables | |
| No | 412 (66.03%) |
| Yes | 212 (33.97%) |
| Arterial hypertension | |
| No | 471 (75.48%) |
| Yes | 153.00 (24.52%) |
| Glucose status | |
| Normal | 412 (66.03%) |
| Prediabetes | 141 (22.60%) |
| Diabetes | 71 (11.38%) |
| Characteristics | FG | PPG | HbA1c | |||||||||
|---|---|---|---|---|---|---|---|---|---|---|---|---|
| No, n = 455 | Yes, n = 98 | aPRa | 95% CI | No, n = 437 | Yes, n = 116 | aPRa | 95% CI | No, n = 461 | Yes, n = 92 | aPRa | 95% CI | |
| aEach variable has been independently adjusted for sex, age group, family history of T2DM, smoking activity, alcohol consumption, physical activity, obesity, consumption of ≥ 5 servings of fruits/vegetables, and arterial hypertension. aPR: adjusted prevalence ratio; 95% CI: 95% confidence interval; FG: fasting glucose; HbA1c: glycated hemoglobin; PPG: postprandial glucose; T2DM: type 2 diabetes mellitus. | ||||||||||||
| Sex | ||||||||||||
| Female | 299 (96.45%) | 11 (3.55%) | Ref. | - | 290 (93.55%) | 20 (6.45%) | Ref. | - | 294 (94.84%) | 16 (5.16%) | Ref. | - |
| Male | 156 (64.20%) | 87 (35.80%) | 4.44 | 2.51 - 7.85 | 147 (60.49%) | 96 (39.51%) | 2.53 | 1.62 - 3.95 | 167 (68.72%) | 76 (31.28%) | 2.75 | 1.69 - 4.48 |
| Age group | ||||||||||||
| 45 to 59 years | 280 (95.56%) | 13 (4.44%) | Ref. | - | 266 (90.78%) | 27 (9.22%) | Ref. | - | 279 (95.22%) | 14 (4.78%) | Ref. | - |
| 60 years and older | 175 (67.31%) | 85 (32.69%) | 4.28 | 2.56 - 7.15 | 171 (65.77%) | 89 (34.23%) | 1.98 | 1.38 - 2.85 | 182 (70.00%) | 78 (30.00%) | 3.11 | 1.91 - 5.08 |
| History of T2DM | ||||||||||||
| No | 364 (86.26%) | 58 (13.74%) | Ref. | - | 341 (80.81%) | 81 (19.19%) | Ref. | - | 372 (88.15%) | 50 (11.85%) | Ref. | - |
| Yes | 91 (69.47%) | 40 (30.53%) | 1.55 | 1.11 - 2.14 | 96 (73.28%) | 35 (26.72%) | 0.77 | 0.57 - 1.04 | 89 (67.94%) | 42 (32.06%) | 1.66 | 1.23 - 2.25 |
| Smoking activity | ||||||||||||
| No | 385 (86.13%) | 62 (13.87%) | Ref. | - | 375 (83.89%) | 72 (16.11%) | Ref. | - | 387 (86.58%) | 60 (13.42%) | Ref. | - |
| Yes | 70 (66.04%) | 36 (33.96%) | 1.40 | 1.03 - 1.89 | 62 (58.49%) | 44 (41.51%) | 1.28 | 0.95 - 1.74 | 74 (69.81%) | 32 (30.19%) | 0.99 | 0.66 - 1.48 |
| Alcohol consumption | ||||||||||||
| No | 371 (83.75%) | 72 (16.25%) | Ref. | - | 365 (82.39%) | 78 (17.61%) | Ref. | - | 381 (86.00%) | 62 (14.00%) | Ref. | - |
| Yes | 84 (76.36%) | 26 (23.64%) | 1.00 | 0.69 - 1.44 | 72 (65.45%) | 38 (34.55%) | 1.43 | 1.02 - 2.00 | 80 (72.73%) | 30 (27.27%) | 1.45 | 0.99 - 2.11 |
| Physical activity | ||||||||||||
| Low | 352 (80.55%) | 85 (19.45%) | Ref. | - | 337 (77.12%) | 100 (22.88%) | Ref. | - | 348 (79.63%) | 89 (20.37%) | Ref. | - |
| Moderate/vigorous | 103 (88.79%) | 13 (11.21%) | 1.10 | 0.72 - 1.69 | 100 (86.21%) | 16 (13.79%) | 0.95 | 0.62 - 1.46 | 113 (97.41%) | 3 (2.59%) | 0.23 | 0.08 - 0.67 |
| Obesity | ||||||||||||
| No | 341 (89.74%) | 39 (10.26%) | Ref. | - | 344 (90.53%) | 36 (9.47%) | Ref. | - | 348 (91.58%) | 32 (8.42%) | Ref. | - |
| Yes | 114 (67.06%) | 56 (32.94%) | 1.01 | 0.73 - 1.41 | 93 (54.71%) | 77 (45.29%) | 1.87 | 1.31 - 2.68 | 113 (66.47%) | 57 (33.53%) | 1.15 | 0.80 - 1.65 |
| Consumption ≥ 5 servings of fruits/vegetables | ||||||||||||
| No | 254 (73.41%) | 92 (26.59%) | Ref. | - | 235 (67.92%) | 111 (32.08%) | Ref. | - | 256 (73.99%) | 90 (26.01%) | Ref. | - |
| Yes | 201 (97.10%) | 6 (2.90%) | 0.32 | 0.15 - 0.68 | 202 (97.58%) | 5 (2.42%) | 0.19 | 0.08 - 0.46 | 205 (99.03%) | 2 (0.97%) | 0.09 | 0.02 - 0.37 |
| Hypertension | ||||||||||||
| No | 424 (91.18%) | 41 (8.82%) | Ref. | - | 412 (88.60%) | 53 (11.40%) | Ref. | - | 425 (91.40%) | 40 (8.60%) | Ref. | - |
| Yes | 31 (35.23%) | 57 (64.77%) | 2.27 | 1.53 - 3.38 | 25 (28.41%) | 63 (71.59%) | 2.12 | 1.54 - 2.94 | 36 (40.91%) | 52 (59.09%) | 1.95 | 1.36 - 2.78 |
| Characteristics | FG | PPG | HbA1c | |||||||||
|---|---|---|---|---|---|---|---|---|---|---|---|---|
| No, n = 579 | Yes, n = 45 | aPRa | 95% CI | No, n = 573 | Yes, n = 51 | aPRa | 95% CI | No, n = 583 | Yes, n = 41 | aPRa | 95% CI | |
| aEach variable has been independently adjusted for sex, age group, family history of T2DM, smoking activity, alcohol consumption, physical activity, obesity, consumption of ≥ 5 servings of fruits/vegetables, and arterial hypertension. aPR: adjusted prevalence ratio; 95% CI: 95% confidence interval; FG: fasting glucose; HbA1c: glycated hemoglobin; PPG: postprandial glucose; T2DM: type 2 diabetes mellitus. | ||||||||||||
| Sex | ||||||||||||
| Female | 314 (99.37%) | 2 (0.63%) | Ref. | - | 311 (98.42%) | 5 (1.58%) | Ref. | - | 313 (99.05%) | 3 (0.95%) | Ref. | - |
| Male | 265 (86.04%) | 43 (13.96%) | 4.60 | 1.27 - 16.7 | 262 (85.06%) | 46 (14.94%) | 2.04 | 0.83 - 4.99 | 270 (87.66%) | 38 (12.34%) | 2.57 | 0.81 - 8.09 |
| Age group | ||||||||||||
| 45 to 59 years | 300 (99.67%) | 1 (0.33%) | Ref. | - | 298 (99.00%) | 3. (1.00%) | Ref. | - | 296 (98.34%) | 5 (1.66%) | Ref. | - |
| 60 years and older | 279 (86.38%) | 44 (13.62%) | 10.90 | 1.60 - 74.5 | 275 (85.14%) | 48 (14.86%) | 4.61 | 1.52 - 14.0 | 287 (88.85%) | 36 (11.15%) | 1.81 | 0.73 - 4.51 |
| History of T2DM | ||||||||||||
| No | 427 (99.07%) | 4 (0.93%) | Ref. | - | 426 (98.84%) | 5 (1.16%) | Ref. | - | 429 (99.54%) | 2 (0.46%) | Ref. | - |
| Yes | 152 (78.76%) | 41 (21.24%) | 3.78 | 1.40 - 10.2 | 147 (76.17%) | 46 (23.83%) | 3.95 | 1.79 - 8.71 | 154 (79.79%) | 39 (20.21%) | 6.59 | 1.63 - 26.6 |
| Smoking activity | ||||||||||||
| No | 453 (99.34%) | 3 (0.66%) | Ref. | - | 450 (98.68%) | 6 (1.32%) | Ref. | - | 450 (98.68%) | 6 (1.32%) | Ref. | - |
| Yes | 126 (75.00%) | 42 (25.00%) | 5.31 | 1.53 - 18.5 | 123 (73.21%) | 45 (26.79%) | 2.48 | 1.10 - 5.56 | 133 (79.17%) | 35 (20.83%) | 1.77 | 0.81 - 3.87 |
| Alcohol consumption | ||||||||||||
| No | 452 (98.26%) | 8 (1.74%) | Ref. | - | 454 (98.70%) | 6 (1.30%) | Ref. | - | 457 (99.35%) | 3 (0.65%) | Ref. | - |
| Yes | 127 (77.44%) | 37 (22.56%) | 2.05 | 1.04 - 4.05 | 119 (72.56%) | 45 (27.44%) | 4.41 | 1.81 - 10.8 | 126 (76.83%) | 38 (23.17%) | 7.36 | 2.19 - 24.7 |
| Physical activity | ||||||||||||
| Low | 460 (91.63%) | 42 (8.37%) | Ref. | - | 456 (90.84%) | 46 (9.16%) | Ref. | - | 463 (92.23%) | 39 (7.77%) | Ref. | - |
| Moderate/vigorous | 119 (97.54%) | 3 (2.46%) | 1.28 | 0.69 - 2.38 | 117 (95.90%) | 5 (4.10%) | 1.73 | 0.65 - 4.61 | 120 (98.36%) | 2 (1.64%) | 0.89 | 0.22 - 3.57 |
| Obesity | ||||||||||||
| No | 383 (98.71%) | 5 (1.29%) | Ref. | - | 381 (98.20%) | 7 (1.80%) | Ref. | - | 384 (98.97%) | 4 (1.03%) | Ref. | - |
| Yes | 193 (82.83%) | 40 (17.17%) | 1.54 | 0.82 - 2.87 | 189 (81.12%) | 44 (18.88%) | 1.52 | 0.80 - 2.89 | 196 (84.12%) | 37 (15.88%) | 1.83 | 0.83 - 4.05 |
| Consumption ≥ 5 servings of fruits/vegetables | ||||||||||||
| No | 371 (90.05%) | 41 (9.95%) | Ref. | - | 366 (88.83%) | 46 (11.17%) | Ref. | - | 374 (90.78%) | 38.00 (9.22%) | Ref. | - |
| Yes | 208 (98.11%) | 4 (1.89%) | 0.85 | 0.47 - 1.54 | 207 (97.64%) | 5 (2.36%) | 1.02 | 0.56 - 1.87 | 209 (98.58%) | 3.00 (1.42%) | 0.79 | 0.41 - 1.50 |
| Hypertension | ||||||||||||
| No | 468 (99.36%) | 3 (0.64%) | Ref. | - | 465 (98.73%) | 6 (1.27%) | Ref. | - | 468 (99.36%) | 3.00 (0.64%) | Ref. | - |
| Yes | 111 (72.55%) | 42 (27.45%) | 4.34 | 1.36 - 13.9 | 108 (70.59%) | 45 (29.41%) | 3.12 | 1.34 - 7.25 | 115 (75.16%) | 38.00 (24.84%) | 4.38 | 1.18 - 16.2 |
| Test | Normal | Prediabetes | Total | Concordance (kappa) | Expected agreement | Agreement |
|---|---|---|---|---|---|---|
| FG: fasting glucose; Hb1Ac: glycosylated hemoglobin; PPG: postprandial glucose. | ||||||
| FG and PPG | 419 | 36 | 455 | 0.6877 | 68.74% | 90.24% |
| FG and HbA1c | 427 | 28 | 455 | 0.6061 | 71.54% | 88.79% |
| PPG and HbA1c | 422 | 15 | 437 | 0.6812 | 69.37% | 90.24% |
| Total | 461 | 92 | 553 | |||
| Test | Normal | Diabetes | Total | Concordance (kappa) | Expected agreement | Agreement |
|---|---|---|---|---|---|---|
| FG: fasting glucose; Hb1Ac: glycosylated hemoglobin; PPG: postprandial glucose. | ||||||
| FG and PPG | 561 | 18 | 579 | 0.6616 | 85.79% | 95.19% |
| FG and HbA1c | 571 | 8 | 579 | 0.7503 | 87.17% | 96.79% |
| PPG and HbA1c | 565 | 8 | 573 | 0.6952 | 86.33% | 95.83% |
| Total | 583 | 41 | 624 | |||