

| Journal of Endocrinology and Metabolism, ISSN 1923-2861 print, 1923-287X online, Open Access |
| Article copyright, the authors; Journal compilation copyright, J Endocrinol Metab and Elmer Press Inc |
| Journal website http://www.jofem.org |
Original Article
Volume 2, Number 1, February 2012, pages 32-38
T Wave and QRS Complex Alternans During Stress ECG Testing According to the Presence or Absence of Diabetes Mellitus
Ivaylo Christova, d, Giovanni Bortolanb, Iana Simovac, Tzvetana Katovac
aInstitute of Biophysics and Biomedical Engineering, Bulg. Acad. of Sci, Sofia, Bulgaria
bInstitute of Biomedical Engineering ISIB - CNR, Padova, Italy
cDepartment of Noninvasive Cardiovascular Imaging and Functional Diagnostics, National Cardiology Hospital, Sofia, Bulgaria
dCorresponding author: Ivaylo Christov, Institute of Biophysics and Biomedical Engineering, Bulgarian Academy of Science, Acad.G.Bonchev str., bl. 105, Sofia 1113, Bulgaria
Manuscript accepted for publication January 11, 2012
Short title: T Wave and QRS Complex Alternans
doi: https://doi.org/10.4021/jem69e
| Abstract | ▴Top |
Background: Diabetes mellitus (DM) is a well recognised cardiovascular risk factor, associated with adverse clinical outcomes. Microvolt T wave alternans (TWA) and to some extent alternans of the QRS complex (QRSA) during stress ECG testing have the ability to detect patients at an increased risk for sudden cardiac death (SCD). The results about the influence of DM on TWA during stress testing are controversial, and studies regarding QRSA values during stress ECG testing according to the presence or absence of DM are lacking. The purpose of the present study is to evaluate the influence of DM on TWA and QRSA during stress ECG testing.
Methods: Principal component analysis, combined with wave amplitude computation was used for TWA and QRSA quantification. We studied 107 patients (63 ± 10 years, 42% male). DM was present in 36% and angiographically significant coronary artery disease (AS-CAD) in 45%.
Results: Patients with DM had higher QRSA compared to non-diabetics (P = 0.001); TWA did not differ significantly. Patients with positive stress ECG tests had higher TWA and QRSA compared to those with negative stress tests (P < 0.001), no matter of the presence or absence of DM. In non-diabetics TWA and QRSA values were significantly higher when percutaneous coronary intervention (PCI) was performed (P ≤ 0.001), while in the diabetic subgroup such a difference was attenuated to no significant.
Conclusions: Diabetics had higher QRSA during stress ECG testing, while TWA values were not significantly influenced by the diabetic status. The presence of DM attenuates the observed differences of TWA and QRSA between patients with or without PCI.
Keywords: T wave alternans; QRS complex alternans; Stress ECG testing; Diabetes mellitus
| Introduction | ▴Top |
Microvolt T wave and QRS complex alternans (TWA and QRSA) is an electrophysiological phenomenon associated with change in the shape of T wave and QRS complex, appearing in alternation on every other beat basis, that is not apparent to the naked eye. Microvolt TWA has the ability to identify patients at high risk for sudden cardiac death. In studies in animals [1] and humans [2, 3], TWA is strongly associated with an increased risk of reentrant ventricular tachyarrhythmias and sudden cardiac death.
Previously, TWA was measured mainly during electro-physiologic studies (EPS), where its induction was shown topredict ventricular arrhythmias [4]. Subsequently, techniques were developed to allow assessment of alternans noninvasively with exercise. There is a high concordance between exercise-induced and pacing-induced TWA [5].
Electrical alternans of the QRS complex is an electrocardiographic (ECG) phenomenon seen in different clinical situations, mainly supraventricular and ventricular tachycardias [6, 7]. The clinical significance of QRSA however is less studied. Some authors consider the possible clinical value of this parameter in determining the risk of sudden cardiac death and the need for device therapy in selected patients [8] although other clinical trials do not confirm these results [6]. A recent study has observed increased values of QRSA in patients with positive stress ECG test and in patients with angiographically significant coronary artery disease (AS-CAD) [9].
Diabetes mellitus (DM) is a well recognized cardiovascular risk factor, associated with adverse clinical outcomes. Some studies have found that prevalence of TWA during stress ECG test is higher in diabetic patients compared to controls [10] while others have not found such a relationship [11]. Significative relationships between stress ECG, test-induced QRSA and DM are not reported in literature.
A variety of algorithms for detecting and quantifying TWA have been proposed, employing techniques as spectral analysis, complex demodulation, zero-crossings counting in a series of correlation coefficients, Karhunen-Loeve transform, low-pass Capon filtering, Poincare mapping, periodicity transforms, statistical tests, modified moving average, Laplacian likelihood ratio, etc.
A review by Martínez and Olmos [12] highlights the need for methodological systematization effort in characterization and comparison of the different methods.
PhysioNet and Computers in Cardiology organized a challenge in 2008: Detecting and quantifying T-wave alternans [13]. A set of 100 freely available ECGs with reference rankings of TWA content was specially compiled and posted. Thirty of them contained artificial TWA in calibrated amounts [14]. The artificial TWA was created by modulating the T-wave loop of the synthetic vectorcardiogram (VCG), then projecting the VCG onto 12 scalar ECG leads. In this way, the artificial TWA is distributed across the scalar ECG leads. The TWA amplitudes were defined as the maximum vector difference between the forms of the T-wave loop in the VCG and varied from 2 to 60 microvolts.
The aim of this study is to determine the influence of the presence of DM on wave alternans (TWA and QRSA) during stress ECG test.
| Materials and Methods | ▴Top |
Study group
We studied 107 patients (anamnesis, physical examination, clinical and laboratory data, stress ECG test and ECG analysis). Demographic characteristics, risk factors distribution and other clinical data for this group of patients are presented in Table 1.
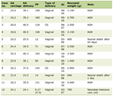 Click to view | Table 1. Demographic Characteristics and Risk Factor Distribution for the Whole Group of Patients |
Ethics: Signing an inform consent was a prerequisite for inclusion in the study. The study protocol was approved by the local ethical committee and complied with the Declaration of Helsinki.
Patients were included regardless of their sex or age. Exclusion criteria were left ventricular systolic dysfunction with ejection fraction < 40%, haemodinamically significant valvular heart disease, history of ventricular tachycardia, patient unable to perform the stress ECG test or unwilling to sign the inform consent
Stress ECG test
All patients performed a stress ECG test using veloergometer (GE Marquette Stress PC ECG Application Version 4.312, Medset Medizintechnik GmbH). The protocol we used consisted of 2-min stages with 25W incremental workload. Digital 12-lead ECG was acquired during the whole study. The test was considered positive in the setting of ≥ 1 mm horizontal or downward-sloping ST depression 80 msec after J-point.
TWA and QRSA detection
The method for TWA detection successfully participated in the Physionet/Computers in Cardiology Challenge, 2008 [15, 16], and it was expanded for QRSA detection and quantification.
The ECG signals were preprocessed to eliminate or suppress the powerline interference, the drift [17] and the electromyographic noise [18]. QRS detection was applied [19], onsets and offsets of the QRS complex and T wave were automatically delineated [20] and their amplitudes were calculated, in a combined lead (CL) simulating the spatial vector [17].
The proposed TWA and QRSA detection algorithm considers three aspects: the parameter selection, the interval selection and the classification.
Multi-lead approach has been followed, in order to extract a single index from the entire ECG record. Two parameters in the temporal domain were chosen: 1) the amplitude and 2) the complexity index. In the first case a combined lead was used, and the amplitude was computed in the QRS or T wave intervals.
The second parameter for TWA and QRSA discrimination considers the use of Principal Component Analysis (PCA) for quantifying the complexity index. PCA has been applied to the intervals of QRS complexes and T waves. The complexity index is characterized by the ratio 2nd/1st eigenvalues.
In interval selection two methods were applied: Global and Local (Fig. 1). In the Global method, the entire ECG recording was processed, producing a unique time series, which feeds the detection block. The Local method considers a set of two variable length windows of 128 and 60 RR intervals, and performs the parameter extraction in each of them.
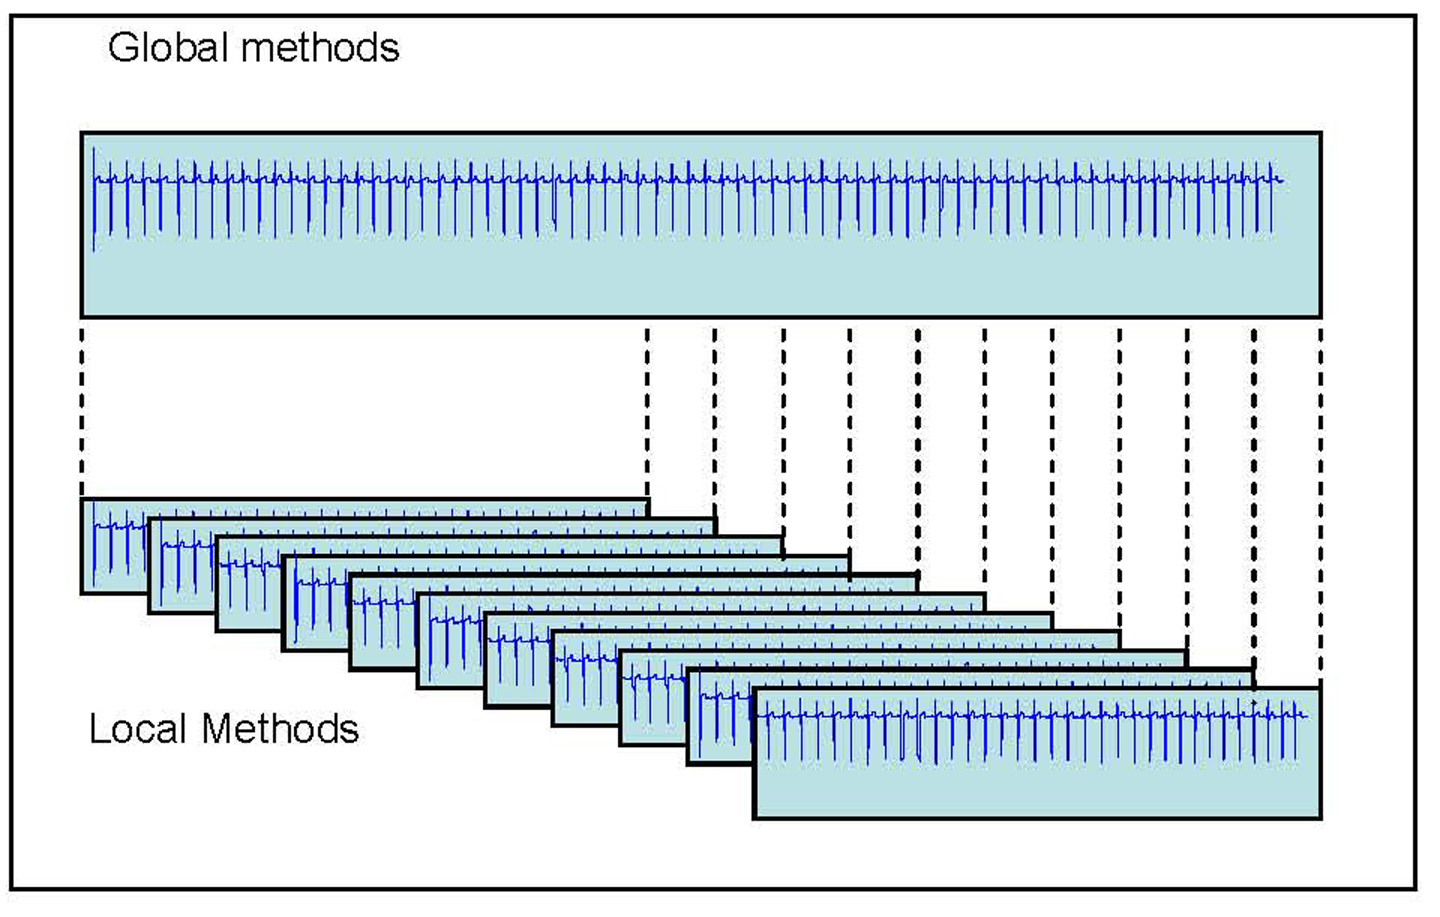 Click for large image | Figure 1. Methods for the interval selection for the detection of TWA: Global (entire record) and Local (a set of windows). |
The detection block performs the separation of the parameters from odd and even RR intervals and the consequent statistical analysis on the two series with the non parametric paired-sampled Wilcoxon signed rank test.
In the case of Global methods, the binary index produced by the statistical test represents the presence or absence of TWA and QRSA.
In the case of Local methods, this process is repeated for every interval, producing a set of binary indices, and in case there is at least one positive index, it signifies the presence of TWA or QRSA.
All the RR intervals were analyzed, independently of the presence of noise or artifact, and the heart rate was not considered.
TWA and QRSA quantification
The four binary terms described in the previous section allow the quantification of QRSA and TWA. For example adding the two Global and the two Local indices based on QRS wave amplitude and PCA indices, a parameter in the range 0÷4 is obtained. Then three classes have been defined: negative (QRSA or TWA < 2), borderline (QRSA or TWA = 2) and positive (QRS or TWA > 2).
Statistics
We tested the distribution of data within groups using the Kolmogorov Smirnov test. Normally distributed data were presented as mean ± standard deviation (SD), whereas non-normally distributed data-as median and inter-quartile range (the difference between the 25th and 75th percentile). We compared the results using an independent samples t test for normally distributed data and the Mann-Whitney U test for non-normally distributed data. Categorical variables, presented in percentage terms, were compared with Chi square test. A two-tailed P value < 0.05 was considered significant. All tests were performed with SPSS 13.0 for Windows.
| Results | ▴Top |
TWA and QRSA measured with 60 RR interval window (TWA-60 and QRSA-60) were significantly higher (i.e. more sensitive) than those measured with 128 RR interval window (TWA-128 and QRSA-128) (Table 2).
Click to view | Table 2. Differences in TWA and QRSA Values Measured With 60 and 128 RR Interval Window |
We divided the whole group of patients into two subgroups-patients with DM (39 patients: 36%) and without DM (68 patients: 64%). Subjects with and without DM had similar baseline characteristics, with the only exception of higher prevalence of dyslipidemy in the diabetic patients compared with non-diabetic ones (90% and 72% respectively, P = 0.03).
Patients with DM had higher QRSA values compared with non-diabetics (for QRSA-60: 1.82 and 1.21 respectively, P < 0.001, for QRSA-128: 1.36 and 1.04 respectively, P = 0.05), with a borderline statistical significance when 128 RR interval window was used for the analysis. TWA values during stress ECG did not differ significantly between the two subgroups of patients regardless of the analytical method used.
Patients with positive stress ECG test had higher TWA and QRSA values compared to patients with negative stress test, regardless of the method used for wave alternans measurement (60 or 128 RR interval window). In both patient subgroups (with or without DM) a positive stress ECG test was associated with significantly higher TWA and QRSA values (regardless of the method used) in comparison with the negative test result subset (Table 3).
Click to view | Table 3. Comparison TWA and QRSA (Measured With 60 and 128 RR Interval Window) Between Patients With Positive or Negative Stress ECG Test in the Whole Group Of Patients and in the Subgroups With or Without DM |
We further divided our study group to patients with or without prior PCI. From this analysis we excluded patients with coronary artery bypass grafts. In the PCI subgroup were included subjects with AS-CAD who have been revascularized. Non-PCI subgroup comprised patients without angiographically significant coronary artery stenoses and those who have not performed a coronary angiogram (low risk patients). TWA and QRSA were significantly higher, regardless of the measurement method, in the PCI compared with the non-PCI subgroup. In the absence of DM the results were quite similar. In the diabetic subgroup, however, the values of TWA and QRSA did not show any statistically significant difference when a comparison between PCI and non-PCI patients was performed (Table 4).
Click to view | Table 4. Comparison TWA and QRSA (Measured With 60 and 128 RR Interval Window) Between Patients With or Without PCI in the Whole Group of Patients and in the Subgroups With or Without DM |
| Discussion | ▴Top |
In the present study we evaluated the influence of DM on TWA and QRSA during stress ECG testing in a group of 107 patients. We used principal component analysis and wave amplitude computation on a combined lead for TWA and QRSA detection during stress ECG test performing the analysis with 60 and 128 RR interval windows.
Our findings could be summarized as follows: 1). TWA and QRSA values measured with 60 RR interval windows were significantly higher than those measured with 128 RR interval windows, suggesting that the former method was more sensitive for wave alternans detection. This, however, does not seem to have a significant influence on our further results - comparison of TWA and QRSA between different subgroups; 2). Diabetics had higher QRSA values during stress ECG testing than non-diabetics; TWA values, however, did not show any significant difference depending on the diabetic status; 3). Patients with a positive stress ECG test had significantly higher TWA and QRSA values compared to patients without such conditions, regardless of the method used for wave alternans measurement, in the whole study group and in the subgroups with or without DM; 4). PCI procedure performed before the current stress ECG testing leads to an increase in TWA and QRSA values. In the subgroup of patients without DM, those who had previous PCI demonstrated higher TWA and QRSA compared to the non-PCI subjects (confirming the result for the whole study group). Diabetics, however, did not show any significant difference in TWA and QRSA, regardless of whether PCI was performed or not performed.
Studies considering the influence of DM on TWA [10, 11] give conflicting results. Information about the interaction of DM on QRSA is lacking. The present study is the 1st to demonstrate that patients with DM have higher QRSA than non-diabetics. The reason for this observed difference between subjects with or without DM in QRSA, but not in TWA values, is not entirely clear to the investigators. It is a well known fact that repolarization is prolonged in the presence of DM, and there is some new evidence that depolarization abnormalities affecting sodium channels and influencing excitation-contraction coupling could also be present in the experimental setting of DM [21].
The observed difference in TWA and QRSA between patients with AS-CAD and PCI performed and those without AS-CAD (and no PCI) is an expected one. The fact that in the diabetic subgroup this difference is attenuated could be explained with the influence of DM itself on the depolarization and repolarization process. This could make further subtle changes, induced by the presence of revascularized AS-CAD, barely detectable.
As a limitation of this study we should consider that patients were not followed-up prospectively in order to estimate the occurrence of major untoward cardiovascular complications, including ventricular arrhythmias and SCD.
Conclusion
Diabetics had higher QRSA during stress ECG testing, while TWA values were not significantly influenced by the diabetic status. The presence of DM attenuates the difference in TWA and QRSA seen between patients with or without PCI.
Acknowledgments
This study was supported by a joint project between the Italian Research Council (Institute of Biomedical Engineering ISIB-CNR) and the Bulgarian Academy of Sciences (Institute of Biophysics and Biomedical Engineering).
Conflicts of Interest
The authors declare that there are no competing interests presented in this article with other people or organizations.
Authors’ Contribution
Ivaylo Christov and Giovanni Bortolan contributed with their own method for T-wave and QRS-complex alternans detection and assessment. All patients’ recordings were processed by their method.
Iana Simova and Tzvetana Katova participated in patient recruitment, stress ECG testing, data recording, statistical analysis, manuscript preparation.
All authors read and approved the final manuscript.
| References | ▴Top |
- Smith JM, Clancy EA, Valeri CR, Ruskin JN, Cohen RJ. Electrical alternans and cardiac electrical instability. Circulation. 1988;77(1):110-121.
pubmed - Klingenheben T, Zabel M, D'Agostino RB, Cohen RJ, Hohnloser SH. Predictive value of T-wave alternans for arrhythmic events in patients with congestive heart failure. Lancet. 2000;356(9230):651-652.
pubmed - Ikeda T, Saito H, Tanno K, Shimizu H, Watanabe J, Ohnishi Y, Kasamaki Y, et al. T-wave alternans as a predictor for sudden cardiac death after myocardial infarction. Am J Cardiol. 2002;89(1):79-82.
pubmed - Rosenbaum DS, Jackson LE, Smith JM, Garan H, Ruskin JN, Cohen RJ. Electrical alternans and vulnerability to ventricular arrhythmias. N Engl J Med. 1994;330(4):235-241.
pubmed - Hohnloser SH, Klingenheben T, Zabel M, Li YG, Albrecht P, Cohen RJ. T wave alternans during exercise and atrial pacing in humans. J Cardiovasc Electrophysiol. 1997;8(9):987-993.
pubmed - Morady F. Significance of QRS alternans during narrow QRS tachycardias. Pacing Clin Electrophysiol. 1991;14(12):2193-2198.
pubmed - Maury P, Metzger J. Alternans in QRS amplitude during ventricular tachycardia. Pacing Clin Electrophysiol. 2002;25(2):142-150.
pubmed - Das MK, El Masry H. Fragmented QRS and other depolarization abnormalities as a predictor of mortality and sudden cardiac death. Curr Opin Cardiol. 2010;25(1):59-64.
pubmed - Christov I, Bortolan G, Simova I, Katova T. T wave and QRS complex alternans during standard diagnostic stress ECG test. Comput in Cardiol 2010;37:1039-1042.
- Molon G, Costa A, Bertolini L, Zenari L, Arcaro G, Barbieri E, Targher G. Relationship between abnormal microvolt T-wave alternans and poor glycemic control in type 2 diabetic patients. Pacing Clin Electrophysiol. 2007;30(10):1267-1272.
pubmed - Martin DT, Shoraki A, Nesto RW, Rutter MK. Influence of diabetes and/or myocardial infarction on prevalence of abnormal T-wave alternans. Ann Noninvasive Electrocardiol. 2009;14(4):355-359.
pubmed - Martinez JP, Olmos S. Methodological principles of T wave alternans analysis: a unified framework. IEEE Trans Biomed Eng. 2005;52(4):599-613.
pubmed - Moody G. The PhysioNet / Computers in Cardiology Challenge 2008: T-Wave Alternans. Comput in Cardiol. 2008:35:505-508.
pubmed - Clifford G, Nemati S, Sameni R. An Artificial Multi-Channel Model for Generating Abnormal Electrocardiographic Rhythms. Comput in Cardiol. 2008;35:773-776.
pubmed - http://www.cinc.org/challenge.shtml.
- Bortolan G, Christov II. Principal component analysis for the detection and assessment of T-wave alternans. Comput in Cardiol 2008;35:521-524.
- Daskalov IK, Dotsinsky IA, Christov II. Developments in ECG acquisition, preprocessing, parameter measurement, and recording. IEEE Eng Med Biol Mag. 1998;17(2):50-58.
pubmed - Christov, II, Daskalov IK. Filtering of electromyogram artifacts from the electrocardiogram. Med Eng Phys. 1999;21(10):731-736.
pubmed - Christov II. Real time electrocardiogram QRS detection using combined adaptive threshold. Biomed Eng Online. 2004;3(1):28.
pubmed - Christov I, Simova I. Q-onset and T-end delineation: assessment of the performance of an automated method with the use of a reference database. Physiol Meas. 2007;28(2):213-221.
pubmed - Pandit SV, Giles WR, Demir SS. A mathematical model of the electrophysiological alterations in rat ventricular myocytes in type-I diabetes. Biophys J. 2003;84(2):832-841.
pubmed
This is an open-access article distributed under the terms of the Creative Commons Attribution License, which permits unrestricted use, distribution, and reproduction in any medium, provided the original work is properly cited.
Journal of Endocrinology and Metabolism is published by Elmer Press Inc.