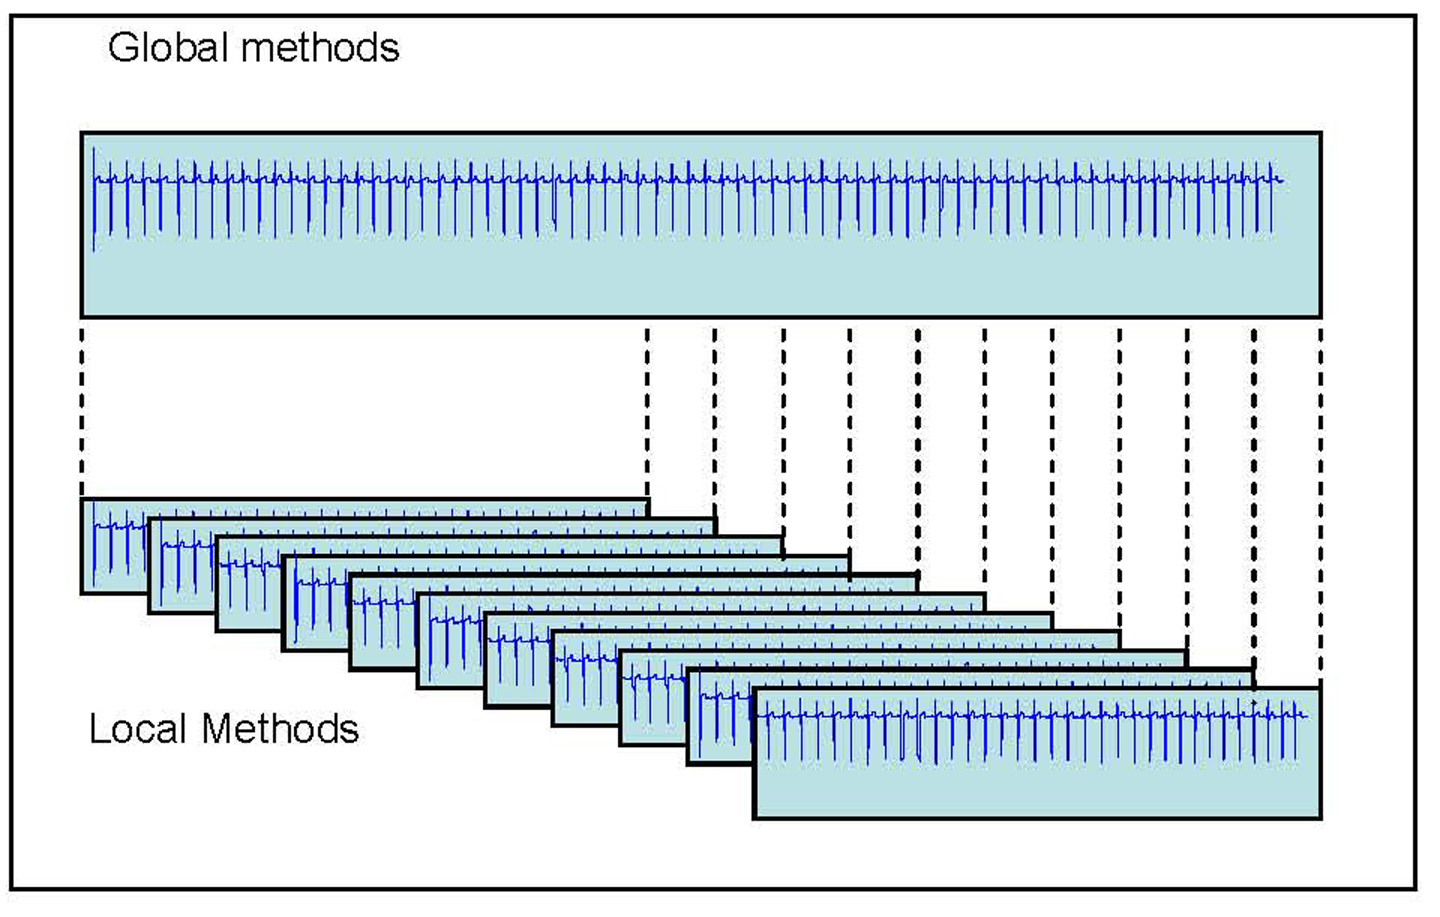
Figure 1. Methods for the interval selection for the detection of TWA: Global (entire record) and Local (a set of windows).
| Journal of Endocrinology and Metabolism, ISSN 1923-2861 print, 1923-287X online, Open Access |
| Article copyright, the authors; Journal compilation copyright, J Endocrinol Metab and Elmer Press Inc |
| Journal website http://www.jofem.org |
Original Article
Volume 2, Number 1, February 2012, pages 32-38
T Wave and QRS Complex Alternans During Stress ECG Testing According to the Presence or Absence of Diabetes Mellitus
Figure
Tables
| Clinical variable | Distribution n = 107 |
|---|---|
| SD: standard deviation; BMI: body mass index; AH: arterial hypertension; MI: myocardial infarction; PCI: percutaneous coronary intervention; n: number. | |
| Age - mean ± SD | 62.8 ± 10.3 |
| Male - n (%) | 45 (42%) |
| BMI - mean ± SD | 27.9 ± 4.4 |
| AH - n (%) | 96 (90%) |
| DM - n (%) | 39 (36%) |
| Dyslipidemia - n (%) | 87 (81%) |
| Family history of CAD - n (%) | 11 (10%) |
| Present smokers - n (%) | 16 (15%) |
| Ex-smokers - n (%) | 25 (23%) |
| Angina pectoris - n (%) | 86 (80%) |
| History of MI - n (%) | 18 (17%) |
| Positive stress ECG test - n (%) | 34 (32%) |
| AS-CAD - n (%) | 48 (45%) |
| PCI - n (%) | 40 (37%) |
| Coronary artery bypass grafting - n (%) | 10 (9%) |
| Parameter | 60 RR | 128 RR | Stat. sign (P) |
|---|---|---|---|
| TWA | 1.8 ± 0.77 | 1.48 ± 0.82 | P < 0.001 |
| QRSA | 1.43 ± 0.74 | 1.16 ± 0.68 | P < 0.001 |
| Whole group n = 107 | Stress pos | Stress neg | Stat. sign (P) |
|---|---|---|---|
| TWA-60 | 2.32 ± 0.68 | 1.22 ± 0.59 | < 0.001 |
| QRSA-60 | 1.79 ± 0.91 | 1.26 ± 0.71 | 0.003 |
| TWA-128 | 2.03 ± 0.58 | 1.22 ± 0.79 | < 0.001 |
| QRSA-128 | 1.62 ± 0.85 | 0.95 ± 0.76 | < 0.001 |
| Subgroup DM n = 39 | |||
| TWA-60 | 2.43 ± 0.65 | 1.24 ± 0.72 | < 0.001 |
| QRSA-60 | 2.29 ± 0.73 | 1.56 ± 0.82 | 0.02 |
| TWA-128 | 2.07 ± 0.27 | 1.04 ± 0.69 | 0.001 |
| QRSA-128 | 1.93 ± 0.88 | 1.04 ± 0.69 | 0.006 |
| Subgroup no DM n =68 | |||
| TWA-60 | 2.25 ± 0.72 | 1.73 ± 0.61 | 0.004 |
| QRSA-60 | 1.45 ± 0.43 | 1.1 ± 0.39 | 0.04 |
| TWA-128 | 2 ± 0.73 | 1.31 ±0.62 | 0.002 |
| QRSA-128 | 1.4 ± 0.55 | 0.9 ± 0.25 | 0.013 |
| Whole group n = 97 | PCI | no PCI | Stat. sign (P) |
|---|---|---|---|
| TWA-60 | 2.18 ± 0.78 | 1.25 ± 0.69 | < 0.001 |
| QRSA-60 | 1.85 ± 0.8 | 1.18 ± 0.81 | < 0.001 |
| TWA-128 | 1.85 ± 0.74 | 1.25 ± 0.74 | < 0.001 |
| QRSA-128 | 1.55 ± 0.75 | 0.93 ± 0.46 | < 0.001 |
| Subgroup DM n = 34 | |||
| TWA-60 | 2 ± 1.04 | 1.48 ± 0.77 | ns |
| QRSA-60 | 2.07 ± 0.92 | 1.68 ± 1.07 | ns |
| TWA-128 | 1.71 ± 0.83 | 1.26 ± 0.9 | ns |
| QRSA-128 | 1.71 ± 0.91 | 1.16 ± 0.94 | ns |
| Subgroup no DM n =63 | |||
| TWA-60 | 2.27 ± 0.6 | 1.64 ± 0.62 | < 0.001 |
| QRSA-60 | 1.73 ± 0.62 | 0.99 ± 0.36 | < 0.001 |
| TWA-128 | 1.92 ± 0.69 | 1.26 ± 0.52 | < 0.001 |
| QRSA-128 | 1.46 ± 0.65 | 0.79 ± 0.21 | < 0.001 |