

| Journal of Endocrinology and Metabolism, ISSN 1923-2861 print, 1923-287X online, Open Access |
| Article copyright, the authors; Journal compilation copyright, J Endocrinol Metab and Elmer Press Inc |
| Journal website https://www.jofem.org |
Original Article
Volume 13, Number 2, June 2023, pages 57-69

Application of Self-Monitoring of Blood Glucose by Intermittently Scanned Continuous Glucose Monitoring to Lifestyle Improvement After Health Checkup
Tetsuya Kakumaa, b, d ![]() , Takashi Tsutsumic, Yoshikuni Kudoc
, Takashi Tsutsumic, Yoshikuni Kudoc
aDepartment of Nursing, Oita University Faculty of Medicine, Yufu City, Oita 879-5593, Japan
bHealth Support Center, Hasama Campus, Oita University, Yufu City, Oita 879-5593, Japan
cHealth Support Center, Dannoharu Campus, Oita University, Oita City, Oita 870-1192, Japan
dCorresponding Author: Tetsuya Kakuma, Department of Nursing, Oita University Faculty of Medicine, 1-1 Idaigaoka, Hasama-machi, Yufu City, Oita 879-5593, Japan
Manuscript submitted March 15, 2023, accepted April 1, 2023, published online June 30, 2023
Short title: Application of isCGM to Health Guidance
doi: https://doi.org/10.14740/jem875
| Abstract | ▴Top |
Background: Although workers are required to undergo annual health examinations in Japan, many issues remain with encouraging examinees to visit medical institutions after the checkup and providing education in lifestyle improvements. We recommended self-monitoring of blood glucose to high-risk staff with impaired glucose tolerance to establish effective and practical health guidance.
Methods: Subjects were staff who underwent regular health examinations in 2017 - 2018 and who showed hemoglobin A1c (HbA1c) ≥ 6.0% or HbA1c 5.6-5.9% and either body mass index (BMI) ≥ 25 kg/m2 or waist circumference ≥ 85 cm for men or ≥ 90 cm for women. Subjects received instruction in, and performed self-monitoring of blood glucose using, intermittently scanned continuous glucose monitoring (isCGM) for 14 days. At that time, we did not provide specific lifestyle improvement guidance, only explaining that blood glucose can be measured repeatedly without finger-pricks. We compared metabolic parameters between isCGM and non-isCGM groups for the previous year, the next year, and 3 years later, and also examined relationships among daily number of measurements, average blood glucose level, and questionnaire responses.
Results: In the isCGM group, positive behavioral changes were observed to improve lifestyle, and the proportion of subjects taking pharmacotherapies for lifestyle-related diseases increased significantly (P = 0.014). In addition, among staff who did not change medications, the isCGM group showed improvements in blood pressure and liver function as well as decreases in body weight and waist circumference, all of which were maintained even after 2 years. The more daily scans for blood glucose measurement, the higher the awareness of improving diet and exercise habits, and the greater the motivation to treat obesity and diabetes. Conversely, no relationships with average daily blood glucose were found.
Conclusions: Blood glucose measurement by isCGM promoted improvements in lifestyle and metabolic parameters. Self-monitoring, but not blood glucose level, was the trigger for behavior changes and frequency of self-monitoring was associated with increased motivation to improve lifestyle. Health guidance that values the desire of subjects to be aware of their own changes should be kept in mind as a useful technique.
Keywords: Regular health examination; Self-monitoring of blood glucose; Intermittently scanned continuous glucose monitoring; Behavior modification; Metabolic improvement
| Introduction | ▴Top |
The purpose of regular health examinations is to detect incipient disease in the earliest stage and prevent the onset of major pathologies. However, many problems are encountered in encouraging hospital visits after health examinations and providing actionable education in lifestyle-related improvement. Some meta-analyses and randomized controlled trials from other countries have found no significant differences in the incidence or mortality of heart disease or stroke between groups that did and did not receive health examinations [1-3]. Such results suggest that first, the individuals most at risk of health problems may already be receiving treatment and the effects of health examinations may be difficult to observe, and second, even if abnormalities are found during health examinations, behavior modifications to improve lifestyle may not be implemented because effective feedback may not be provided to the patients following health examinations. Therefore, in Western countries where scientific data are important, health examinations as used in Japan have not been conducted. Conversely, in Japan, the Industrial Safety and Health Act stipulates that it is the duty of employers to provide health examinations for workers at least once a year [4].
In the Oita University Faculty of Medicine, the number of hypoglycemic drug users increased slightly during the 10 years from 2009 to 2018 among staff over 40 years of age who underwent regular health examinations, and average hemoglobin A1c (HbA1c) levels of all staff have increased significantly over time. On the other hand, no significant differences have been seen in the average age of subjects or hemoglobin (Hb) levels. This result indicates that the proportion of employees with identified or suspected impaired glucose tolerance is increasing. Over the same period, no significant changes in body mass index (BMI) or waist circumference, and no deteriorations in liver function, blood pressure, or serum lipids were observed. Based on such findings, even in the absence of noticeable changes in physique, abnormal glucose metabolism is steadily becoming more apparent year by year. The immediate task of occupational physicians in the Health Support Center at Oita University is thus to determine how we can provide effective and practical health guidance after health examinations to staff at high risk of impaired glucose tolerance. This same task also represents an important academic question.
Recognizing hyperglycemia only after meals as a subjective symptom is difficult, as is identifying how blood glucose levels are changing due to lifestyle improvements. If “continuous” blood glucose measurement were to be performed and the results instantly provided as feedback to the user, behavior changes may be facilitated. However, methods to achieve such feedback have been unavailable until recent years. Even for diabetic patients, obtaining frequent blood glucose measurements over time is not feasible since the method is painful at the time of measurement. Under such circumstances, the FreeStyle Libre continuous glucose monitoring (CGM) system (Abbott Diabetes Care, Alameda, CA, USA) was released and has been commercially available in Japan since January 2017. In addition, the costs of this system have been covered under the national insurance system for diabetic patients using insulin since September 2017 [5]. The FreeStyle Libre personal CGM device intermittently measures glucose data from intercellular fluid. The company that developed this intermittently scanned CGM (isCGM) named the technique “flash glucose monitoring” (FGM) [6]. By holding the reader over the sensor, the current blood glucose level is displayed on the screen of the reader without requiring any finger-pricks. The user therefore has the great advantage of being able to instantly check changes in blood glucose, with each blood glucose measurement providing an opportunity to look back on lifestyle choices. In addition, FGM automatically records the blood glucose level every 15 min and stores the data for 14 days, allowing analysis of fluctuations in blood glucose levels and average daily blood glucose levels [7]. In patients with type 2 diabetes, FGM has been reported to result in significantly improved HbA1c compared to conventional self-monitoring of blood glucose (SMBG) [8]. On the other hand, no significant difference in HbA1c was observed between FGM and conventional SMBG in large-scale randomized clinical trials targeting type 1 and type 2 diabetes treated with insulin [9, 10]. A recent meta-analysis of systematic reviews also found no significant differences in HbA1c between diabetic monitoring systems (including conventional SMBG, FGM, real-time or retrospective CGM, sensor-augmented pump therapy, etc.) [11]. However, many studies on FGM have shown qualitative improvements such as shortening of hyperglycemic time, improvement of various blood glucose fluctuation indices, and increased user satisfaction [8, 12, 13]. In any case, with the advent of FGM as a method that does not involve pain on repeated blood glucose measurements, changes in blood glucose levels corresponding to events during daily life are now easily examined. However, for diabetes patients who have not been treated with injectable preparations such as insulin or glucagon-like peptide 1 receptor agonist, all costs for blood glucose measurement are currently at their own expense. Furthermore, for those who have not been diagnosed with diabetes, FGM is not usually used because it is not covered by insurance, and no reports have described the use of FGM in the provision of health guidance.
FGM is minimally invasive and provides immediate feedback on changes in blood glucose, and so has the same purpose as the “Graphed Daily Weight Chart” that was devised to look back on weight changes and daily life by measuring weight four times a day (immediately after waking up, after breakfast, after dinner, and just before going to bed), immediately recording and graphing body weight [14-16]. We have used the Graphed Daily Weight Chart at our institution with good success in the treatment of obesity. In the present study, we asked staff members who underwent regular health examinations in the Oita University Faculty of Medicine and who were identified as being at high risk of impaired glucose tolerance whether they would like to receive guidance on improving lifestyle behaviors using FGM. For those staff who wished to receive health guidance, FGM was performed for 14 days. We compared changes in physical characteristics, biochemical data, and questionnaire responses among staff who had undergone the next year’s health examination between a group that used FGM (FGM group) and a group that did not (non-FGM group). We also compared data at 3 years after the end of the FGM intervention. Furthermore, in the FGM group, we investigated the relationship between the implementation status of FGM and satisfaction.
| Materials and Methods | ▴Top |
Subjects
Subjects were the staff who underwent a regular health examination in the Oita University Faculty of Medicine in 2017 - 2018, and who showed HbA1c ≥ 6.0% or HbA1c 5.6-5.9% and either BMI ≥ 25 kg/m2 or waist circumference ≥ 85 cm for men or ≥ 90 cm for women. Since “treatment” (lifestyle advice) was not considered to have any adverse effects even for diabetic patients undergoing treatment, subjects were included regardless of whether they had diabetes. On the other hand, pregnant women and staff undergoing dialysis were excluded. This study was conducted in accordance with the Declaration of Helsinki and all study protocols were approved by the ethics committee at Oita University (date of approval: March 9, 2017; approval no. 1181). In 2017, subjects were staff ≥ 40 years of age who underwent routine measurement of waist circumference at the health examination. However, since inquiries were received from applicants < 40 years of age, we applied for a change to include individuals < 40 years of age and obtained additional approval (date of approval: March 16, 2018; approval no. 1181). In 2018, we removed the age limit and announced this change.
Accordingly, the number of subjects meeting the above requirements was 145 in 2017 and 136 in 2018, but the total number of subjects was actually 155 because of overlap. We asked subjects at high risk for impaired glucose tolerance whether they would like to receive health guidance using FGM. Those subjects expressing interest were instructed in FGM and performed SMBG for 14 days after obtaining written informed consent (FGM group, n = 44; non-FGM group, n = 111). Of these, 138 subjects had undergone the next year’s health examination in the Faculty of Medicine without retirement or change in work department and thus had data from before and after FGM available for collection (FGM group, n = 39; non-FGM group, n = 99). In this study, after applying for additional opt-outs and obtaining approval (date of approval: April 28, 2022; approval no. 1181), data from these 138 subjects from before and after the intervention were compared between FGM and the non-FGM groups.
Guidance for improving lifestyle using isCGM for SMBG
In the Oita University Faculty of Medicine, regular health examinations for staff are conducted every June. The target period for lifestyle improvement guidance based on FGM was set to January - March of the following year, corresponding to about half a year after staff learned the results of the health examination. This would result in lifestyle interventions during the winter season when physical activity declines and overeating is more likely to occur. As a result, subjects would be able to look back on their own changes 3 - 5 months after receiving lifestyle guidance at the time of their regular health checkup in the following year. The outline on the guidance letter for health guidance based on FGM is as follows: 1) “The health support center has purchased an instrument for isCGM (Abbott, the manufacturer, calls this FGM) that allows you to easily measure blood glucose levels by yourself without finger-pricks, with results available immediately”; 2) “If you buy the device yourself, the cost is 7,000 yen, but the device can be borrowed for free if desired”; 3) “This device continuously monitors blood glucose levels, so you can easily see changes in blood glucose levels during daily life. Therefore, this offers an effective method to improve your lifestyle”; 4) “In addition, we aim to improve metabolic data based on behavior modification alone as much as possible, rather than recommending medical interventions”.
Applicants were asked to come to the health support center, and after the principal investigator explained the significance and content of the research using explanatory documents, informed consent was obtained from all subjects. A sensor was then attached to the outside of the upper arm on the non-dominant side, and the method of operation was explained. The device is water-resistant and can be immersed for up to 30 min, blood glucose levels can be displayed instantly by holding the reader over the sensor (actual blood glucose measurement procedure), and the blood glucose level can be displayed at any time by operating the reader. Furthermore, the subject can look back not only on blood glucose data at any time, but also on past blood glucose changes. It should be noted that the reader needs to be held over the sensor at least once every 8 h, otherwise a blank entry will be logged in the blood glucose data, so the principal investigator carefully explained to applicants that this operation should not be neglected (operation guidance). Next, by presenting a graph of meal contents and blood glucose changes (Supplementary Material 1, www.jofem.org), applicants were shown that blood glucose levels did not increase much when carbohydrates were eaten after fish and other meats. In addition, the subject was instructed to pay attention to what kinds of meals are likely to result in fluctuations in blood glucose levels (lifestyle guidance). However, we did not provide specific dietary therapy (optimal calories, etc.) or exercise therapy (time, content, etc.), and took care to give subjects the opportunity to notice for themselves the factors that contributed to changes in blood glucose during in daily life. After 14 days, the sensor was removed, the reader was returned, and finally, a post-intervention questionnaire survey of satisfaction was conducted.
Data from health examinations
Applicants with a doctor’s or nurse’s license were defined as medical staff. Sex was self-reported, and age, height, body weight, waist circumference, systolic blood pressure, diastolic blood pressure, aspartate aminotransferase, alanine aminotransferase (ALT), γ-glutamyl transpeptidase, triglycerides, low-density lipoprotein cholesterol, high-density lipoprotein cholesterol, HbA1c, and Hb level were obtained during routine health examinations. Biochemical data were collected at any time. Based on height and weight, BMI was calculated as the weight in kilograms divided by the square of height in meters. In the FGM group, the amounts of change in each value from before the FGM intervention to the following year and to 3 years after the intervention were calculated as follows, respectively: amount of change at 1 year after intervention = value the year after intervention - value the year before intervention; and amount of change at 3 years after intervention = value at 3 years after intervention - value the year before intervention. Similarly, in the non-FGM group, the amount of change was calculated by regarding the year of intervention in the above formula as the year in the option of FGM intervention was given. In addition, a decrease in BMI was defined as a change of -1 kg/m2 or more, and an increase in BMI was defined as +1 kg/m2 or more. Proportions of subjects were calculated as the ratio in each group.
In the regular health examinations conducted by external companies, all examinees are supposed to complete a lifestyle-related questionnaire. Contents of the questionnaire are as follows: “Do you habitually smoke?” (response options: I do not smoke/I smoke/I was smoking, but quit), and those who answer “I smoke” are classified as “current smoking” (in this case, “habitually” refers to a state in which the individual has smoked a total of > 100 cigarettes or for > 6 months, and has also smoked within the last month); “How often do you drink alcohol (sake, shochu, beer, western liquor, etc.)?” (response options: every day/sometimes/almost never (cannot drink)), and those who answer “every day” are classified as “alcohol drinking”; “Do you exercise to at least a light sweat for at least 30 min a day and more than 2 days a week, and have you been doing this for more than 1 year?” (response options: yes/no), and those who answer “yes” are classified as “regular exercise”; “Have you gained more than 10 kg from your weight at 20 years old?” (response options: yes/no), and those who answer “yes” are classified as “history of weight gain”; “Do you eat faster than others?” (response options: fast/normal/slow), and those who answered “fast” are classified as “eating quickly”; “If you have the opportunity to receive health guidance, will you apply for it?” (response options: yes/no), and those who answer “yes” are classified as “applicant for health guidance”; “Do you engage in walking or equivalent physical activity for at least 1 h a day in your daily life?” (response options: yes/no), and those who answer “yes” are classified as “moderate physical activity”; “Do you have dinner within 2 h before bedtime more than 3 days a week?” (response options: yes/no), and those who answer “yes” are classified as “frequently eating dinner late at night”; “Do you skip breakfast more than 3 days a week?” (response options: yes/no), and those who answer “yes” are classified as “skipping breakfast”; “Are you currently taking any medications that lower blood pressure?” (hypertension: yes/no) and “Are you currently using blood glucose-lowering medications or insulin injections?” (diabetes: yes/no) and “Are you currently using any medications that lower cholesterol or triglycerides?” (dyslipidemia: yes/no), and those who answer yes to any of these three questions are classified as “patients with lifestyle-related diseases”; “Do you want to improve your lifestyle such as exercise and eating habits?” (response options: 1. I do not intend to improve; 2. I intend to improve within approximately 6 months; 3. I intend to improve within approximately 1 month, and I am starting little by little; 4. I am already working on improvement (< 6 months); 5. I am already working on improvement (≥ 6 months)), and those who answer 1 are classified as “I have no intention of improving”, those who answer 2 or 3 are classified as “I plan to improve soon”, and those who answer 4 or 5 are classified as “I am positively working on improvement”. In this way, subjects were organized into three categories.
Frequency of daily FGM measurements, average blood glucose, and satisfaction survey
The FreeStyle Libre measures blood glucose levels continuously for a total of 14 days (24 h × 14 days = 336 h). From the analysis data, the number of scans can be obtained along with the average daily blood glucose level for the subject. The number of scans per day indicates the frequency of daily SMBG. The data for the day on which the Libre was attached (first day) and the day the Libre was removed (15th day) were combined as data for a single day, then added to the data for the intermediate 13 days to provide data for 14 days. The average blood glucose level and frequency of daily measurements were then calculated.
The questionnaire shown in Supplementary Material 2 (www.jofem.org) was used to investigate the degree of satisfaction after FGM, self-awareness of blood glucose levels, and motivation for treatment of obesity and diabetes. Each questionnaire item was rated on a seven-point scale ranging from 0 to 6. In the items “pain in blood glucose measurement”, “willingness to improve diet and exercise habits”, “motivation to treat obesity and diabetes”, “desire to use the Libre again”, “recommending the Libre to others”, and “expectation to improve lifestyle with the Libre”, the closer the value is to 6, the higher the degree of satisfaction. On the other hand, in the items “blood glucose higher than expected” and “blood glucose undesirably low”, indicating self-awareness of blood glucose levels, with a closer value to 6, the former indicates that the subject does not feel that blood glucose is high and the latter indicates that the subject does not feel that blood glucose is too low.
Statistical analysis
Quantitative values were not normally distributed in the Shapiro-Wilk test. In particular, aspartate aminotransferase, ALT, triglycerides, and daily number of scans showed differences of more than 10% between mean and median, and outliers were large. As a result, data are expressed as medians and interquartile ranges. Continuous data were non-parametrically compared between groups using the Wilcoxon rank-sum test. Correlations between variables were examined using Spearman’s test. Categorical data are presented as the percentage for the total, and differences in proportions were compared between groups using the χ2 test or Fisher’s exact probability test, and within groups using McNemar’s test. Statistical analyses were performed using JMP software (version 16.0.0 for Macintosh; SAS Institute, Inc., Cary, NC, USA). Values of P < 0.05 (two-sided) were considered significant.
| Results | ▴Top |
Clinical characteristics and lifestyle profiles
The clinical characteristics and lifestyle profiles of participants are shown in Table 1. No significant differences in age, sex ratio, proportion of medical staff, pre-intervention physical characteristics, blood pressure, or blood sampling data were evident between the FGM and non-FGM groups. No significant differences were seen in proportions of current smoking, alcohol drinking, regular exercise, history of weight gain, or eating quickly between groups, but the proportion of applicants for health guidance was significantly greater in the FGM group than in the non-FGM group (P = 0.032) (Table 1).
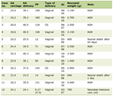 Click to view | Table 1. Clinical Characteristics and Lifestyle Profiles of Study Participants |
Trends in lifestyle improvement and changes in treatment status for lifestyle-related diseases before and after FGM intervention
In the non-FGM group, percentages of subjects who answered “I have no intention of improving”, “I plan to improve soon”, and “I am positively working on improvement” were 5.05%, 62.63%, and 32.32%, respectively, in the previous year, and 6.06%, 60.61%, and 33.33%, respectively, the next year. In each year, more than 60% of subjects answered “I plan to improve soon”, representing the most common response (Fig. 1). Around one-third of subjects answered “I am positively working on improvement”, showing almost no change. On the other hand, in the FGM group, percentages for the same items were 13.16%, 55.26%, and 31.58%, respectively, the previous year, and 7.69%, 46.15%, and 46.15%, respectively, the next year. Percentages of subjects who answered “I am positively working on improvement” increased by about 1.5 times the next year, and the percentage answering “I have no intention of improving” decreased to 58.4%. However, no significant differences were found in comparisons between before and after the intervention period in both the FGM and non-FGM groups.
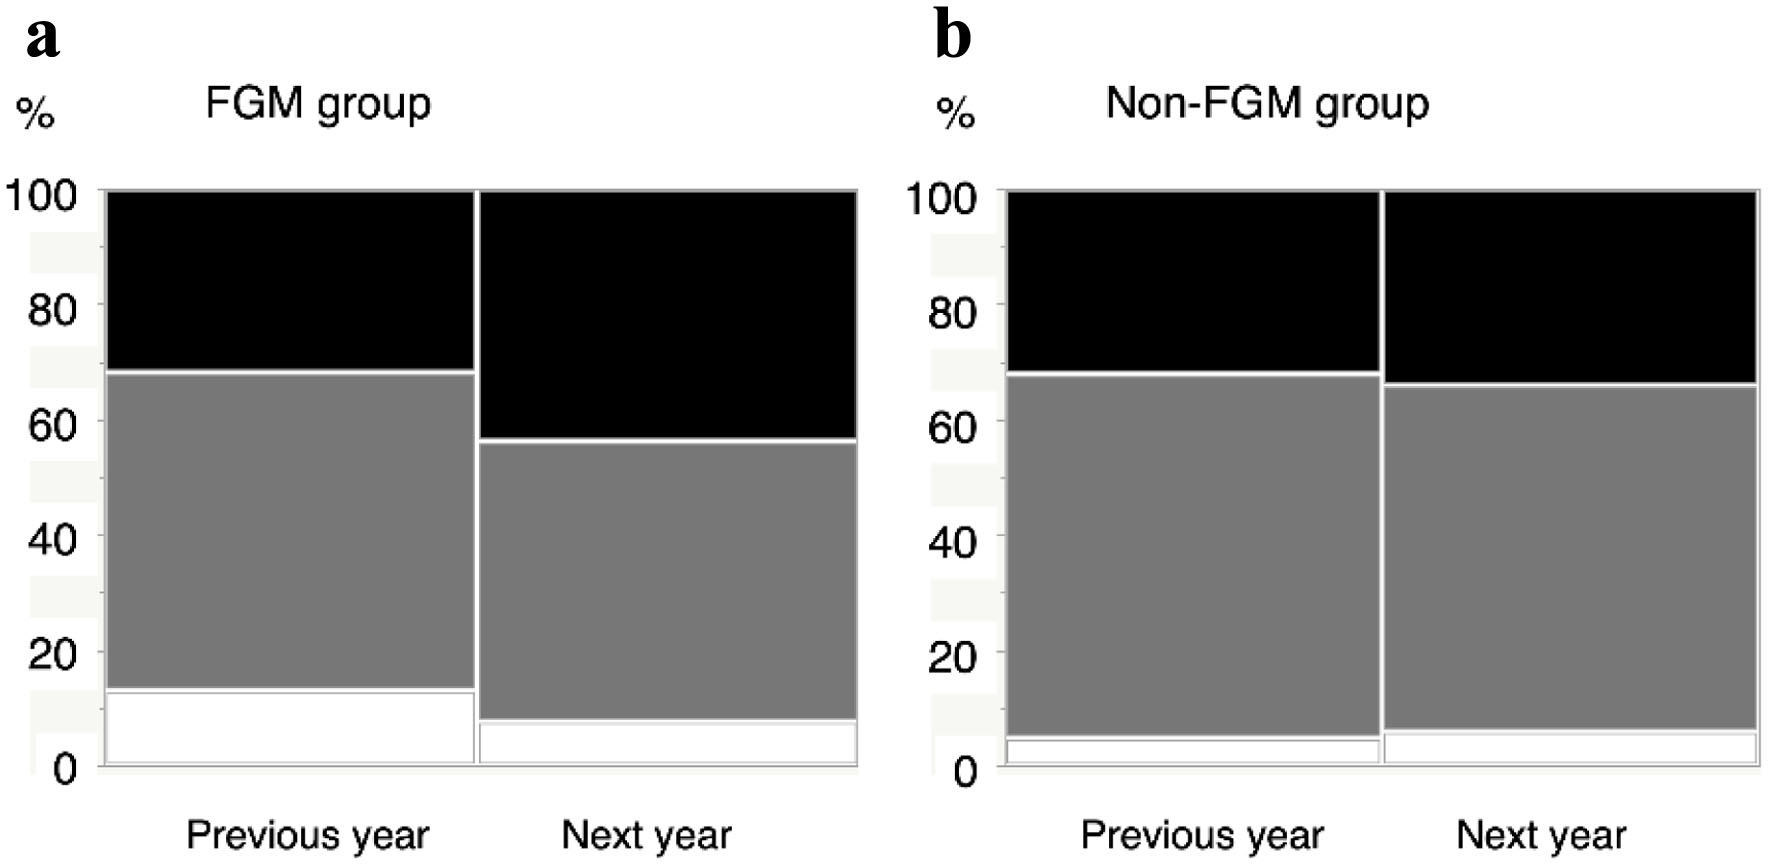 Click for large image | Figure 1. Trends in intention to improve lifestyle from the questionnaire on lifestyle habits at the time of regular health examinations. (a) FGM group (n = 39). (b) Non-FGM group (n = 99). Charts show percentages of subjects with the intention to improve lifestyle from the questionnaire on lifestyle habits at the time of regular health examination. “Previous year” refers to the year before the announcement of health guidance based on FGM, and “next year” refers to the year after the FGM was introduced. The FGM group was given actual guidance based on results from FGM. White, gray, and black squares indicate respondents who answered, “I have no intention of improving”, “I plan to improve soon”, and “I am positively working on improvement”, respectively. FGM: flash glucose monitoring. |
The previous year, the percentage of subjects with moderate physical activity was 26.3% in the FGM group and 44.4% in the non-FGM group, lower than in the FGM group (P = 0.078) (Fig. 2a). However, the next year, proportions were 35.9% in the FGM group and 40.4% in the non-FGM group. An increase in physical activity was observed in the FGM group and the difference in ratio was clearly smaller. The percentage of subjects who frequently ate dinner late at night was similar between groups, at 39.5% in the FGM group and 35.4% in the non-FGM group the previous year, while proportions were 25.6% in the FGM group and 39.4% in the non-FGM group the next year, representing a decrease in ratio by about 35% in the FGM group (Fig. 2b). The percentage of subjects who skipped breakfast was 18.4% in the FGM group and 25.3% in the non-FGM group the previous year, but proportions were 12.8% in the FGM group and 25.3% in the non-FGM group the next year. In the non-FGM group, that proportion that skipped breakfast did not change at all, whereas the FGM group showed a slight decrease (Fig. 2c). The percentage of subjects receiving treatment for lifestyle-related disease was 36.8% in the FGM group and 43.4% in the non-FGM group the previous year, but 53.9% in the FGM group and 48.5% in the non-FGM group the next year, showing increased proportions in both groups (Fig. 2d). Comparing ratios between the previous and next years using the McNemar test, P-values were 0.014 in the FGM group and 0.059 in the non-FGM group, representing a significant difference for the FGM group.
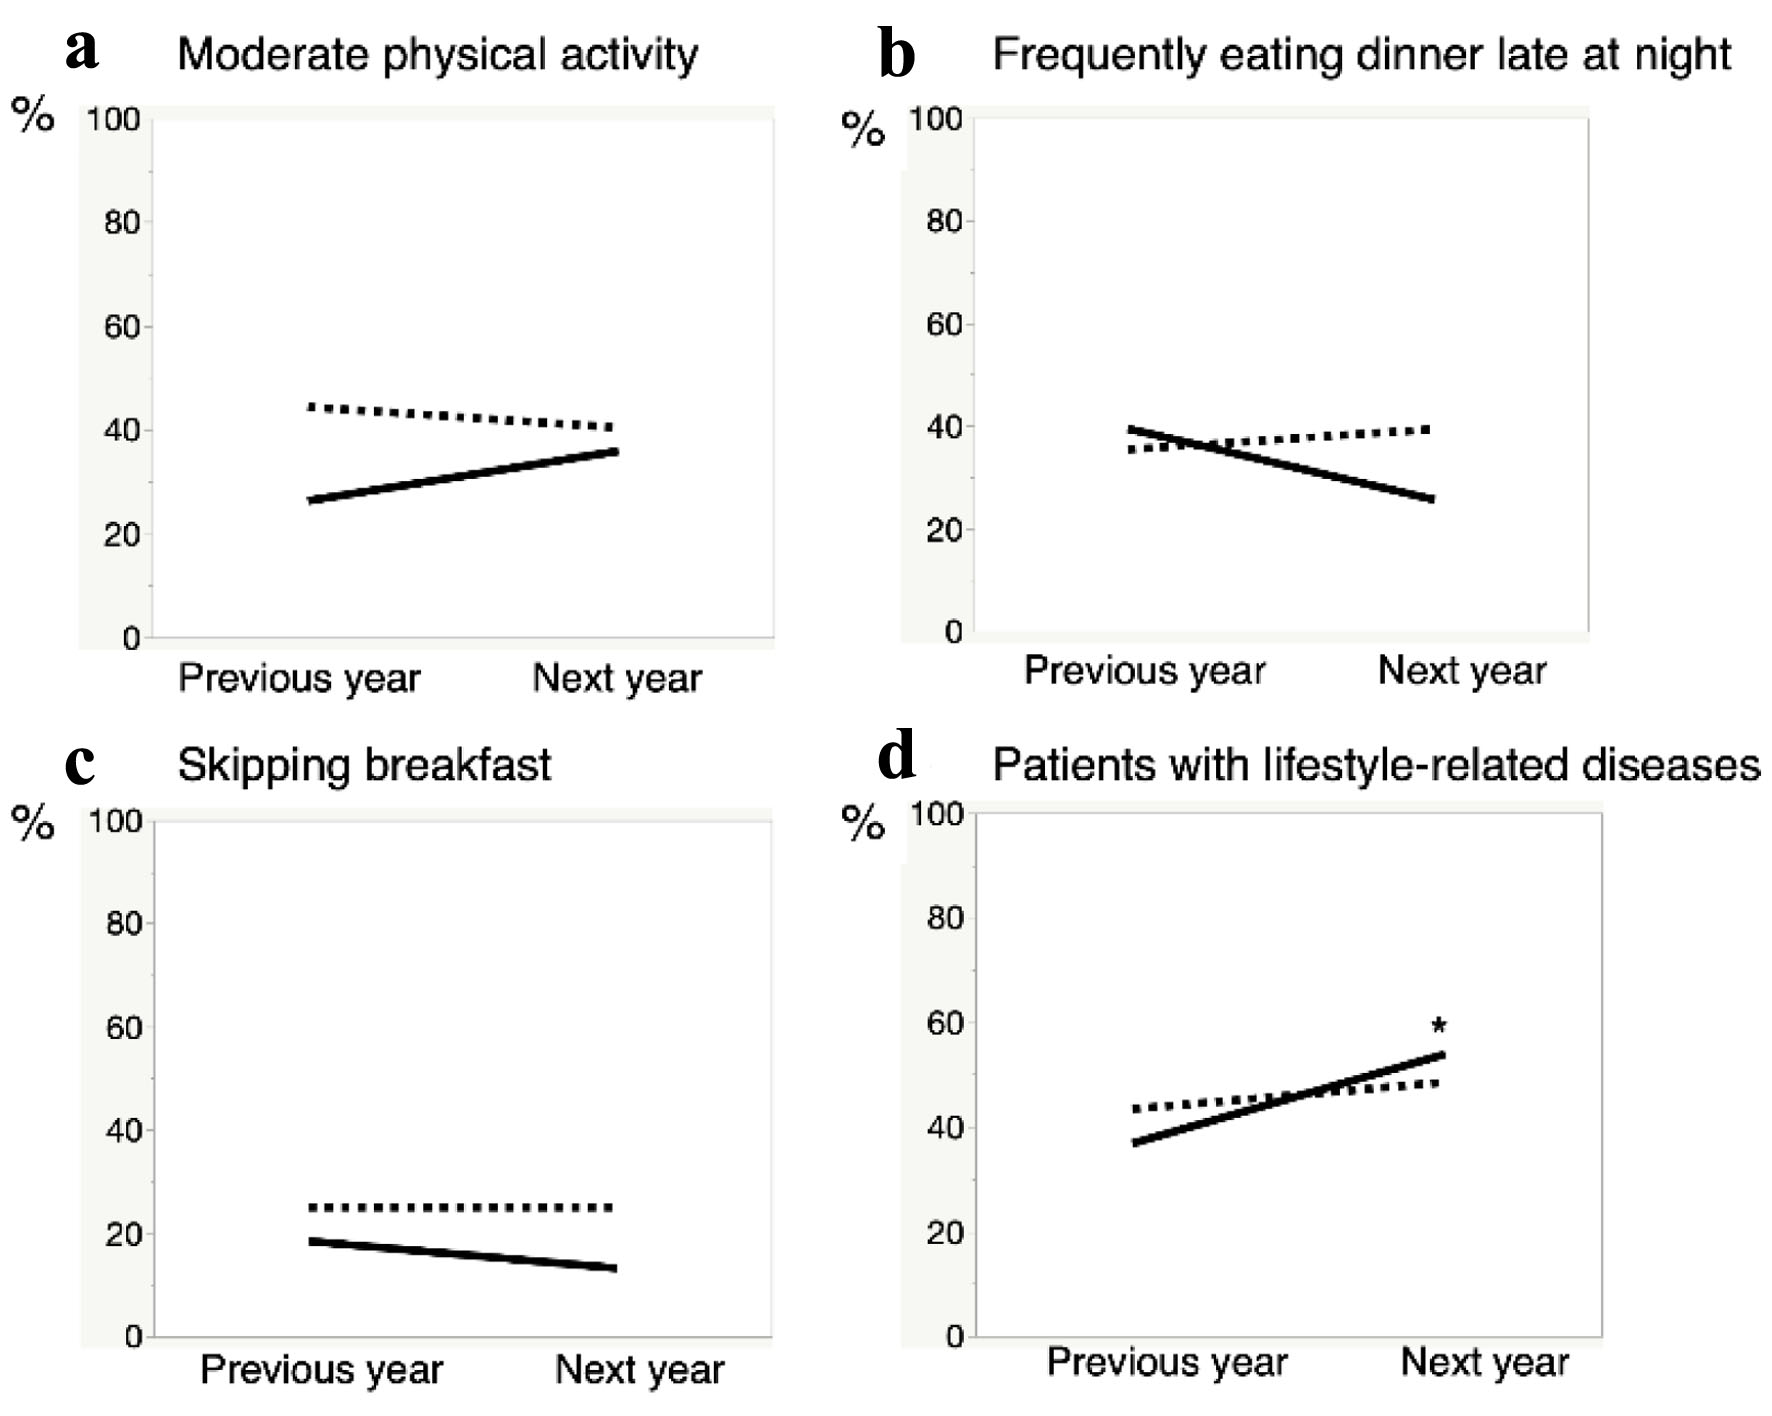 Click for large image | Figure 2. Changes in lifestyle between FGM and non-FGM groups. (a) Moderate physical activity. (b) Frequently eating dinner late at night. (c) Skipping breakfast. (d) Patients with lifestyle-related diseases. Graphs show percentages of subjects with moderate physical activity, frequently eating dinner late at night, skipping breakfast, and using drugs to treat lifestyle-related diseases in the previous and next years, respectively. “Previous year” refers to the year before the announcement of health guidance based on FGM, and “next year” refers to the year after the FGM was introduced. Solid line: FGM group (n = 39); dotted line: non-FGM group (n = 99). *P < 0.05 vs. previous year in the FGM group. FGM: flash glucose monitoring. |
Changes in metabolic parameters and percentage change in BMI between before and after FGM intervention
The number of subjects from whom data were able to be collected for the year after introducing FGM and who showed no change in medication was 120 (FGM group, n = 31; non-FGM group, n = 89). Similarly, data were able to be collected 3 years after introducing FGM for 79 subjects (FGM group, n = 19; non-FGM group, n = 60). Figure 3 shows box plots of actual measured values (including outliers) for each metabolic parameter, and Table 2 shows changes in metabolic parameters and proportions of subjects with decreases and increases in BMI. No significant differences in any parameters were seen between FGM and non-FGM groups for the year before FGM implementation, but in the year after FGM implementation, the FGM group showed significantly lower levels of both ALT (P = 0.029) and γ-glutamyl transpeptidase (P = 0.014), and significantly higher levels of high-density lipoprotein cholesterol (P = 0.014) (Fig. 3). The FGM group also showed significantly lower diastolic blood pressure (P = 0.009) and HbA1c (P = 0.035) the next year compared to the previous year. On the other hand, the amount of change in each parameter at 1 year after intervention was minimal and non-significant in the non-FGM group, while many parameters were decreased in the FGM group. In particular, waist circumference, diastolic blood pressure, and ALT were significantly lower in the FGM group than in the non-FGM group (P = 0.041, P = 0.025, and P = 0.015, respectively) (Table 2). The proportion showing increased BMI was similar in both groups, but the proportion showing decreased BMI was about three times higher in the FGM group than in the non-FGM group (P = 0.008).
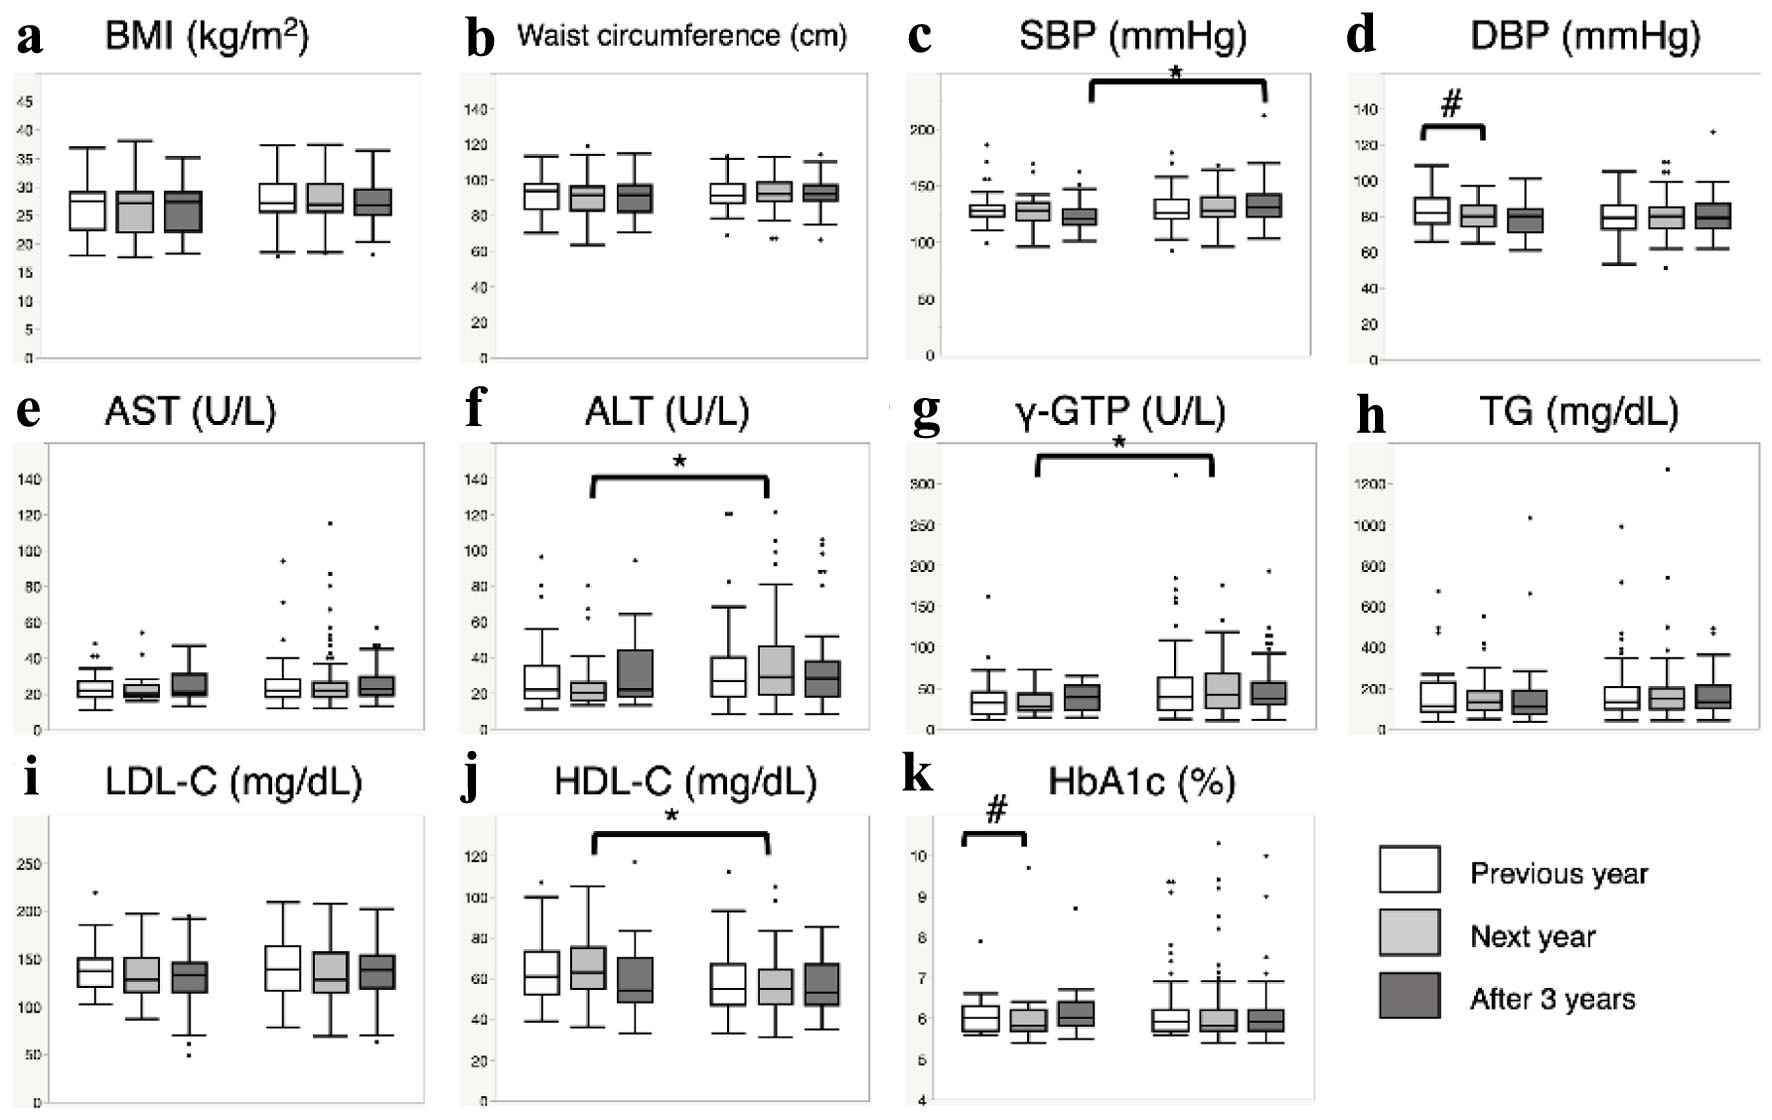 Click for large image | Figure 3. Changes in metabolic parameters before and after intervention with FGM. (a) Body mass index (BMI). (b) Waist circumference. (c) Systolic blood pressure (SBP). (d) Diastolic blood pressure (DBP). (e) Aspartate aminotransferase (AST). (f) Alanine aminotransferase (ALT). (g) γ-glutamyl transpeptidase (γ-GTP). (h) Triglycerides (TG). (i) Low-density lipoprotein cholesterol (LDL-C). (j) High-density lipoprotein cholesterol (HDL-C). (k) Hemoglobin A1c (HbA1c). Box plots show actual measured values (including outliers) for each metabolic parameter. White, light-gray, and dark-gray squares indicate previous year, next year, and 3 years after FGM was announced, respectively. Data on the left in each figure are for the FGM group (previous year (n = 31; except for waist circumference, n = 30), next year (n = 31; except for waist circumference, n = 30), and after 3 years (n = 19)), and data on the right side are for the non-FGM group (previous year (n = 89; except for waist circumference, n = 82), next year (n = 89; except for waist circumference, n = 82), and after 3 years (n = 60; except for waist circumference, n = 57)). Even in the FGM group, data after 3 years indicate that intervention had been completed and more than 2 years had passed since full completion of the intervention. *P < 0.05 for comparison between groups, #P < 0.05 for comparison within groups. FGM: flash glucose monitoring. |
Click to view | Table 2. Comparison of Changes in Metabolic Parameters With or Without FGM Intervention |
In addition, after 3 years, systolic blood pressure was significantly lower in the FGM group than in the non-FGM group (P = 0.034) (Fig. 3). Furthermore, in terms of the amount of parameter change, many parameters remained decreased in the FGM group. In particular, waist circumference and systolic and diastolic blood pressures were significantly lower in the FGM group than in the non-FGM group (P = 0.026, P = 0.018, and P = 0.023, respectively) (Table 2). Conversely, the proportion showing a decrease in BMI no longer differed significantly between FGM and non-FGM groups, although the proportion showing an increase in BMI in the non-FGM group was about double that in the FGM group.
Frequency of daily FGM, average blood glucose, and satisfaction survey
The average daily number of scans in the FGM group (n = 39) was 23.3 (median 18.3; interquartile range 9.4 - 30.5), with a maximum of 67.6 and a minimum of 2.1. During the 14-day implementation period, 10 subjects had no missing data in blood glucose monitoring. Although missing data were observed in three-quarters of the FGM group, a significant and strong correlation was found between the calculated average blood glucose level and HbA1c at the health examination the next year (Supplementary Material 3, www.jofem.org).
Next, we investigated relationships between responses to the questionnaire survey after FGM and age, average blood glucose level, and daily number of scans (Table 3). In the items “pain in blood glucose measurement”, “willingness to improve diet and exercise habits”, “motivation to treat obesity and diabetes”, “desire to use the Libre again”, “recommending the Libre to others”, and “expectation to improve lifestyle with the Libre”, median values were 6 and average values were all ≥ 5.3, representing extremely high results (Table 3). In the item of “pain in blood glucose measurement”, a negative correlation was found with age (P = 0.025), and in the item “motivation to treat obesity and diabetes”, a positive correlation was found with daily number of scans (P = 0.045). In addition, in the items “blood glucose higher than expected” and “blood glucose undesirably low”, negative and positive correlations, respectively, were observed with average daily blood glucose level (P = 0.007 and P = 0.006, respectively).
Click to view | Table 3. Correlation Between Contents of the Questionnaire Survey After FGM and Age, Mean Blood Glucose Level, and Daily Number of Measurements |
| Discussion | ▴Top |
In Japan, regular health examinations are a requirement for workers [4], and the number of workers undergoing examinations in the Oita University Faculty of Medicine has been increasing over the years. In general, examinations are outsourced to an external medical examination company and the results are individually mailed to staff, then staff with abnormal examination data are encouraged to attend a medical institution. However, many do not promptly consult a medical institution. In addition, those answering “I intend to improve my lifestyle” in the questionnaire at regular health examinations often repeat the same answer every year. It is preferable that subjects look back on their own experiences and actually implement change in behavior by themselves. In addition, even if a subject attends a medical institution, we would like them to visit the hospital on their own initiative rather than being forced to by others. Based on such concepts, we provided health guidance using FGM for staff at high risk of impaired glucose tolerance.
According to the 2019 National Health and Nutrition Survey [17], about 35-40% of both men and women are uninterested in improving their eating and exercise habits, and even if they are interested, they do not intend to implement improvements. Further, 15% of obese individuals think that their eating and exercise habits are not a problem and do not need to be improved [17]. Such findings indicate that although opportunities exist for regular health examinations every year, expecting self-motivated improvements in the lives of employees may not be reasonable, and bringing about changes in lifestyle factors is not easy in the first place. In the present study, among those staff who were informed of FGM, all subsequently performed it and were motivated to seek changes in health behaviors based on the results (FGM group), the percentage of subjects who answered “I am positively working on improvement” increased the next year, and the percentage who answered “I have no intention of improving” decreased (Fig. 1a). While significant differences were not observed, the FGM group tended to display positive behavior modifications (Fig. 2a-c). However, no significant difference in the proportion of medical staff was seen between the FGM and non-FGM groups, nor were significant differences seen in the proportions engaging in “regular exercise” (Table 1). In other words, the FGM group was not originally a group that had a high interest in health or was physically active. In any case, the amount of physical activity increased in the FGM group, mainly in the form of walking during daily life. Furthermore, in the FGM group, the percentage of subjects taking pharmacotherapies for lifestyle-related diseases was significantly increased after intervention (Fig. 2d). This indicates that the implementation of FGM triggered staff to visit medical institutions and encouraged them to do so after the health examination. On the other hand, even in the non-FGM group, the percentage of subjects taking drugs for lifestyle-related diseases the next year showed a clear, but non-significant, tendency to increase (P = 0.059; Fig. 2d). Regardless of whether FGM is implemented, regular health examinations provide opportunities for employees with metabolic disorders to start medication, and these examinations thus seem to represent a significant opportunity for workplace health measures. However, since metabolic data are affected by medications, we decided to compare metabolic parameters only between staff not receiving additional therapeutic agents.
Actual measured values of HbA1c showed no change in the non-FGM group before and after intervention (5.9% vs. 5.8%; P = 0.122), whereas the FGM group showed a slight but significant decrease (6.0% vs. 5.8%, P = 0.035) (Fig. 3). Originally, this study was not aimed at diabetic patients, and since HbA1c was about 6.0% in both groups, changes were unlikely to be detected. However, the significant decrease in HbA1c after intervention may be due to behavioral modifications through lifestyle changes in diet and exercise (Fig. 2a-c). No difference in the rate of increase in BMI was seen between groups, and approximately 13% of subjects showed an increase in BMI > 1 kg/m2 from the previous year, with or without intervention (Table 2). This indicates how difficult maintaining the current weight is in the first place. On the other hand, in the FGM group, the percentage of subjects in whom BMI decreased > 1 kg/m2 from the previous year was three times that in the non-FGM group, indicating that FGM was also effective in reducing body weight. Similar to previous reports in type 2 diabetic patients using conventional SMBG [18-20], this study found that implementation of isCGM with FGM also results in behavior modification and better weight control as well as improvements in various metabolic parameters. Furthermore, even 3 years after completing the health guidance using FGM, the FGM group showed significantly greater amounts of change in waist circumference and blood pressure than the non-FGM group (Table 2). In addition, in the non-FGM group, the proportion with increased BMI was clearly increased, while this rate was kept low at 10.5% in the FGM group (Table 2). Thus, although FGM was conducted for only 14 days, the metabolic benefits were surprisingly high even at 3 years after completing the intervention. FGM is quite widespread worldwide, but at present, most data are on blood glucose-related parameters in type 1 diabetes, and few reports have mentioned improvements in other metabolic parameters. Further, no reports have described changes in metabolic parameters after completing FGM. Despite short-term temporal interventions, the experience of SMBG contributes to weight loss and improved metabolism, which in turn may help prevent metabolic syndrome in high-risk groups with impaired glucose tolerance.
The question is then whether recognition of blood glucose level or blood glucose change contributes to behavior changes in the subject? The blood glucose level of the FGM user is automatically collected every 15 min by the Libre sensor attached to the upper arm. However, blood glucose data would be lost if collected data are not transferred to the reader by holding the reader over the sensor at least once every 8 h (measurements need to be made at least 3 times a day). In this study, the minimum average daily number of measurements was 2.1, and 29 of the 39 subjects in the FGM group had missing blood glucose data. We therefore did not calculate coefficients of variation for blood glucose such as mean amplitude of glycemic excursions, because such values would be inherently inaccurate. However, since average daily blood glucose in this study correlated firmly with HbA1c the next year (Supplementary Material 3, www.jofem.org), we thought this value could be used as a marker reflecting the perceptions of the subject regarding his/her own blood glucose level. First, the average blood glucose showed significant correlations with awareness of high and low blood glucose levels in subjects, and in the questionnaire item for blood glucose levels being higher than expected, both mean and median values were 3, in the middle (Table 3). This is an extremely reasonable result for a group with HbA1c around 6.0%, and no discrepancy in the self-awareness of blood glucose levels was considered present. For the item “pain in blood glucose measurement”, the median value was 6, the highest value (corresponding to “no pain at all”), and even the mean value was 5.5, so clearly many subjects did not feel pain during blood glucose measurement by FGM. However, this item showed a significant negative correlation with age (Table 3). This indicates that the older subjects were, the more painful blood glucose measurement was, even for blood glucose measurement that does not require finger-pricks. In questionnaire responses from diabetic patients, there were clearly fewer people who found blood glucose measurements in FGM painful compared to conventional SMBG by finger-prick [8, 21], but elderly individuals still seemed to feel that blood glucose measurements were painful in this study. This may indicate the limits of SMBG. On the other hand, in items showing positive behavioral changes and satisfaction in use, median values were 6 (the highest value in each item), the level of satisfaction with FGM was extremely high, and many felt that FGM would improve their lifestyle (Table 3). Meanwhile, the daily number of scans correlated significantly with “motivation to treat obesity and diabetes” (P = 0.045), and tended to correlate with “willingness to improve diet and exercise habits” (P = 0.065). In other words, the more frequently FGM was performed, the higher the awareness of the need for implementing improvements in lifestyle, and the greater the motivation to treat obesity and diabetes. Recently, large-scale FGM data have been reported from Poland [22]. The mean number of daily measurements was 21.2 scans per day (median 18; interquartile range 12 - 26), close to our FGM measurement data. Subjects were divided into 10 equal groups by the daily number of scans (n = 1,068 for each scan group, except for the highest group, with n = 1,067: 53.2 scans/day in the highest decile, 6.5 scans/day in the lowest decile), and the relationship between measurement frequency and HbA1c was examined. In that Polish study, HbA1c decreased according to scan rate, whereas in the present study, no significant correlations were seen between number of scans and any of HbA1c, metabolic markers, or changes the next year. In the Polish paper, subjects were patients with type 1 diabetes and an average HbA1c of 7.0±1.2%, differing markedly from participants in our study. The relationship between frequency of FGM measurements and metabolic changes may be difficult to observe in subjects without the marked blood glucose fluctuations seen in patients with diabetes.
Of particular note in this study was that mean daily blood glucose level did not correlate with “willingness to improve diet and exercise habits” or “motivation to treat obesity and diabetes”, whereas correlations were identified between the daily number of scans and these items (Table 3). In other words, just looking at and knowing the blood glucose level does not itself lead directly to motivation to implement improvements in lifestyle factors. Instead, the behavior of actually measuring the blood glucose level promotes lifestyle improvements according to the frequency. This ties in nicely with a report that found the more days an individual performed self-weighing each week, the greater the proportion of individuals showing each of exercise habits, higher intake of vegetables, and lower transition to diabetes [23]. In our previous cross-sectional study of 306 outpatients with type 2 diabetes, HbA1c decreased significantly with increasing frequency of weight measurements in patients with a habit of daily self-weighing [24]. Further, in a questionnaire survey of practitioners using the Graphed Daily Weight Chart, which measures weight four times a day and graphs the changes, despite not giving specific guidance on diet or exercise, approximately 25% of subjects answered that they participated in more exercise, and that intakes of high-calorie “carbohydrates, fruits, fatty meats, sweets” were significantly reduced, while intakes of low-calorie “fish, vegetables, seaweeds and mushrooms” were significantly increased [16]. In this manner, knowing blood glucose levels and body weight is of course important, but the actual act of paying attention to these data (self-monitoring) may represent the key starting point for behavior modification. This can only be clarified by examining correlations among daily number of measurements, average blood glucose levels, and questionnaire survey items. A recent study of patients with type 1 diabetes compared real-time CGM (rtCGM), which always displays the automatically measured blood glucose level, and isCGM (equivalent to FGM), which displays the blood glucose level only when specifically initiated by the user [25, 26]. Patients on rtCGM showed significantly greater “time-in-range” and significantly lower “time-below-range”. In addition, HbA1c at 6 months after intervention was significantly lower in the rtCGM group than in the isCGM group [25]. However, it remains unclear why the difference in models of CGM led to improved glycemic control in patients with type 1 diabetes. The alert function in rtCGM, particularly in the form of alerts during periods of hypoglycemia, may have had an effect. Currently, the development of equipment is progressing from the perspectives of simplifying measurements, reducing troublesome operations for patients, and efficiently and accurately communicating results to users [27, 28]. Alarm functions during hypo- and hyperglycemic periods seem very important for users of hypoglycemic drugs such as insulin. On the other hand, these functions are not necessary in health guidance for subjects with obesity and metabolic syndrome but not diabetes. A model that automatically transfers data to a smartphone is convenient, but also seems to impede the individual from gaining self-motivation to be aware of changes (self-monitoring) linked to behavioral changes. In the future, the importance of self-monitoring behaviors will be clarified by comparing rtCGM devices with isCGM devices equipped with alert functions. Considering the current situation in which behaviors are not easily changed just by receiving results from health examinations, self-motivation to perform a specific action to determine blood glucose levels may be crucial.
The key limitations of this study were as follows. First, the number of cases was limited. This was an investigation attempting to identify effective health guidance after regular health examinations, and was not solicited to secure a specific number of cases, with data obtained on a purely voluntary basis. In addition, since the purpose was to improve the health of staff members, data on those being treated for diabetes were also included. Second, we performed analyses as a retrospective cohort study, because informing subjects in the first year that they would be followed up for 3 years would bias the data. Also, because some employees retired or transferred, the number of subjects from whom final follow-up data were available was limited. Third, regarding improvements in lifestyle factors, no specific instructions were given, and improvements were implemented on a voluntary and self-directed basis. On the other hand, since the FGM group was confirmed to include many staff members interested in receiving health guidance (Table 1), this intervention may well have been desired by individuals more motivated to improve their lifestyles. Fourth, because three-quarters of the FGM group had missing blood glucose data, we were unable to incorporate analysis of blood glucose fluctuation indices such as mean amplitude of glycemic excursions.
In conclusion, SMBG offers definite advantages for improving lifestyle and metabolic factors. However, and quite importantly, subjects did not change behaviors based only on recognition of high and low blood glucose levels. That may be one reason why simply knowing the results of health checkups does not lead to health-promoting behavior changes (e.g., improvement in lifestyle factors or consultations with medical institutions). The act of being interested in blood glucose levels represented a starting point for behavioral modification. Pain-free SMBG appears highly useful in promoting health guidance after health examinations. As the responsibility of the health support center attached to a university, for the purpose of achieving effective health guidance after regular health examinations, we intend to focus on health guidance that values the feelings and actions of individuals for becoming more self-aware of changes in blood glucose and weight.
| Supplementary Material | ▴Top |
Suppl 1. Representative data for blood glucose obtained by FGM. Changes in blood glucose level for the corresponding author as analyzed by FreeStyle Libre are shown. Light-gray, dark-gray, and black arrows indicate breakfast, lunch, and dinner (with meal summaries), respectively. The white circle corresponds to the time at which the subject measured (scanned) blood glucose. The gray horizontal bars indicate the ideal glycemic range (80 - 140 mg/dL). FGM: flash glucose monitoring.
Suppl 2. Questionnaire on satisfaction after FGM. A satisfaction survey was conducted using this questionnaire once the FGM had been removed. Each questionnaire item is rated on a seven-point scale from 0 to 6. Considering the psychology of the subject, the instructor was not present while the subject was completing the questionnaire. FGM: flash glucose monitoring.
Suppl 3. Correlation between mean blood glucose obtained by FGM and HbA1c at health examination in the next year. Spearman’s rank correlation coefficient was 0.8022 (P < 0.001), showing a strong correlation between average blood glucose level and HbA1c at the health examination performed the next year. FGM: flash glucose monitoring; HbA1c: hemoglobin A1c.
Acknowledgments
We wish to thank Miwa Eguchi and Yoshika Kido for their assistance with data collection.
Financial Disclosure
This study was supported by JSPS KAKENHI grant number JP21K11625.
Conflict of Interest
The authors declare no conflict of interest.
Informed Consent
Informed consent for SMBG using FGM was obtained from all subjects who wished to obtain health guidance regarding FGM. For comparative analyses of data before and after the intervention between the FGM and non-FGM groups, we announced that the opportunity to opt out was always available by providing relevant information on the departmental website. To date, no such inquiries have been made.
Author Contributions
Tetsuya Kakuma: conceptualization, methodology, software, formal analysis, investigation, data curation, writing - original draft, and visualization. Takashi Tsutsumi and Yoshikuni Kudo: supervision, project administration, writing - review and editing. All authors read and approved the final manuscript.
Data Availability
The authors declare that data supporting the findings of this study are available within the article.
Abbreviations
ALT: alanine aminotransferase; BMI: body mass index; CGM: continuous glucose monitoring; FGM: flash glucose monitoring; Hb: hemoglobin; HbA1c: hemoglobin A1c; isCGM: intermittently scanned CGM; rtCGM: real-time CGM; SMBG: self-monitoring of blood glucose
| References | ▴Top |
- Krogsboll LT, Jorgensen KJ, Gronhoj Larsen C, Gotzsche PC. General health checks in adults for reducing morbidity and mortality from disease: Cochrane systematic review and meta-analysis. BMJ. 2012;345:e7191.
doi pubmed pmc - Jorgensen T, Jacobsen RK, Toft U, Aadahl M, Glumer C, Pisinger C. Effect of screening and lifestyle counselling on incidence of ischaemic heart disease in general population: Inter99 randomised trial. BMJ. 2014;348:g3617.
doi pubmed pmc - Bernstorff M, Deichgraeber P, Bruun NH, Dalsgaard EM, Fenger-Gron M, Lauritzen T. A Randomised trial examining cardiovascular morbidity and all-cause mortality 24 years following general health checks: the Ebeltoft Health Promotion Project (EHPP). BMJ Open. 2019;9(10):e030400.
doi pubmed pmc - Medical Checkups; Industrial Safety and Health Act. https://www.japaneselawtranslation.go.jp/ja/laws/view/3440#jech7at6. Accessed March 1, 2023.
- Murata T, Sakane N, Kato K, Tone A, Toyoda M. The current intermittent-scanning CGM device situation in Japan: only adjunctive use to SMBG is approved and the latest health insurance coverage details. J Diabetes Sci Technol. 2018;12(3):729-730.
doi pubmed pmc - Bailey T, Bode BW, Christiansen MP, Klaff LJ, Alva S. The performance and usability of a factory-calibrated flash glucose monitoring system. Diabetes Technol Ther. 2015;17(11):787-794.
doi pubmed pmc - Abbott Japan Co, Ltd. Freestyle Libre user’s manual. 2016. Japanese.
- Wada E, Onoue T, Kobayashi T, Handa T, Hayase A, Ito M, Furukawa M, et al. Flash glucose monitoring helps achieve better glycemic control than conventional self-monitoring of blood glucose in non-insulin-treated type 2 diabetes: a randomized controlled trial. BMJ Open Diabetes Res Care. 2020;8(1):e001115.
doi pubmed pmc - Bolinder J, Antuna R, Geelhoed-Duijvestijn P, Kroger J, Weitgasser R. Novel glucose-sensing technology and hypoglycaemia in type 1 diabetes: a multicentre, non-masked, randomised controlled trial. Lancet. 2016;388(10057):2254-2263.
doi pubmed - Haak T, Hanaire H, Ajjan R, Hermanns N, Riveline JP, Rayman G. Flash glucose-sensing technology as a replacement for blood glucose monitoring for the management of insulin-treated type 2 diabetes: a multicenter, open-label randomized controlled trial. Diabetes Ther. 2017;8(1):55-73.
doi pubmed pmc - Kamusheva M, Tachkov K, Dimitrova M, Mitkova Z, Garcia-Saez G, Hernando ME, Goettsch W, et al. A systematic review of collective evidences investigating the effect of diabetes monitoring systems and their application in health care. Front Endocrinol (Lausanne). 2021;12:636959.
doi pubmed pmc - Krakauer M, Botero JF, Lavalle-Gonzalez FJ, Proietti A, Barbieri DE. A review of flash glucose monitoring in type 2 diabetes. Diabetol Metab Syndr. 2021;13(1):42.
doi pubmed pmc - Mitsuishi S, Nishimura R, Harashima SI, Kawamura T, Tsujino D, Koide K, Nishimura A, et al. The effect of novel glucose monitoring system (Flash Glucose Monitoring) on mental well-being and treatment satisfaction in Japanese people with diabetes. Adv Ther. 2018;35(1):72-80.
doi pubmed - Fujimoto K, Sakata T, Etou H, Fukagawa K, Ookuma K, Terada K, Kurata K. Charting of daily weight pattern reinforces maintenance of weight reduction in moderately obese patients. Am J Med Sci. 1992;303(3):145-150.
doi pubmed - Tanaka M, Itoh K, Abe S, Imai K, Masuda T, Koga R, Itoh H, et al. Irregular patterns in the daily weight chart at night predict body weight regain. Exp Biol Med (Maywood). 2004;229(9):940-945.
doi pubmed - Kakuma T, Chiba S, Yoshimatsu H. Behavioral therapy: the importance of body weight measurement habits in the treatment of obesity disease. Journal of Japan Society for the Study of Obesity. 2011;17(1):21-26. Japanese.
- 2019 National Health and Nutrition Survey report; Ministry of Health, Labour and Welfare. https://www.mhlw.go.jp/stf/seisakunitsuite/bunya/kenkouiryou/kenkou/eiyou/r1-houkoku_00002.html.Japanese. Accessed March 1, 2023.
- Kempf K, Kruse J, Martin S. ROSSO-in-praxi: a self-monitoring of blood glucose-structured 12-week lifestyle intervention significantly improves glucometabolic control of patients with type 2 diabetes mellitus. Diabetes Technol Ther. 2010;12(7):547-553.
doi pubmed - Duran A, Martin P, Runkle I, Perez N, Abad R, Fernandez M, Del Valle L, et al. Benefits of self-monitoring blood glucose in the management of new-onset Type 2 diabetes mellitus: the St Carlos Study, a prospective randomized clinic-based interventional study with parallel groups. J Diabetes. 2010;2(3):203-211.
doi pubmed - McAndrew LM, Napolitano MA, Pogach LM, Quigley KS, Shantz KL, Vander Veur SS, Foster GD. The impact of self-monitoring of blood glucose on a behavioral weight loss intervention for patients with type 2 diabetes. Diabetes Educ. 2013;39(3):397-405.
doi pubmed - Hermanns N, Ehrmann D, Schipfer M, Kroger J, Haak T, Kulzer B. The impact of a structured education and treatment programme (FLASH) for people with diabetes using a flash sensor-based glucose monitoring system: Results of a randomized controlled trial. Diabetes Res Clin Pract. 2019;150:111-121.
doi pubmed - Hohendorff J, Gumprecht J, Mysliwiec M, Zozulinska-Ziolkiewicz D, Malecki MT. Intermittently scanned continuous glucose monitoring data of polish patients from real-life conditions: more scanning and better glycemic control compared to worldwide data. Diabetes Technol Ther. 2021;23(8):577-585.
doi pubmed pmc - Sakane N, Oshima Y, Kotani K, Suganuma A, Nirengi S, Takahashi K, Sato J, et al. Self-weighing frequency and the incidence of type 2 diabetes: post hoc analysis of a cluster-randomized controlled trial. BMC Res Notes. 2020;13(1):375.
doi pubmed pmc - Kakuma T, Chiba S, Takahashi Y, Kai K, Tsubone T, Yoshimatsu H. Self-weighing contributes to glycemic control: importance of measuring body weight. Diabetol int. 2013;4:40-44.
- Visser MM, Charleer S, Fieuws S, De Block C, Hilbrands R, Van Huffel L, Maes T, et al. Comparing real-time and intermittently scanned continuous glucose monitoring in adults with type 1 diabetes (ALERTT1): a 6-month, prospective, multicentre, randomised controlled trial. Lancet. 2021;397(10291):2275-2283.
doi pubmed - Urakami T, Terada H, Yoshida K, Kuwabara R, Mine Y, Aoki M, Shoji Y, et al. Comparison of the clinical effects of intermittently scanned and real-time continuous glucose monitoring in children and adolescents with type 1 diabetes: A retrospective cohort study. J Diabetes Investig. 2022;13(10):1745-1752.
doi pubmed pmc - Vaddiraju S, Burgess DJ, Tomazos I, Jain FC, Papadimitrakopoulos F. Technologies for continuous glucose monitoring: current problems and future promises. J Diabetes Sci Technol. 2010;4(6):1540-1562.
doi pubmed pmc - Feuerstein-Simon C, Bzdick S, Padmanabhuni A, Bains P, Roe C, Weinstock RS. Use of a smartphone application to reduce hypoglycemia in type 1 diabetes: a pilot study. J Diabetes Sci Technol. 2018;12(6):1192-1199.
doi pubmed pmc
This article is distributed under the terms of the Creative Commons Attribution Non-Commercial 4.0 International License, which permits unrestricted non-commercial use, distribution, and reproduction in any medium, provided the original work is properly cited.
Journal of Endocrinology and Metabolism is published by Elmer Press Inc.