Journal of Endocrinology and Metabolism, ISSN 1923-2861 print, 1923-287X online, Open Access
Article copyright, the authors; Journal compilation copyright, J Endocrinol Metab and Elmer Press Inc
Journal website https://www.jofem.org

Original Article

Volume 13, Number 2, June 2023, pages 57-69


Application of Self-Monitoring of Blood Glucose by Intermittently Scanned Continuous Glucose Monitoring to Lifestyle Improvement After Health Checkup

Figures

Figure 1.
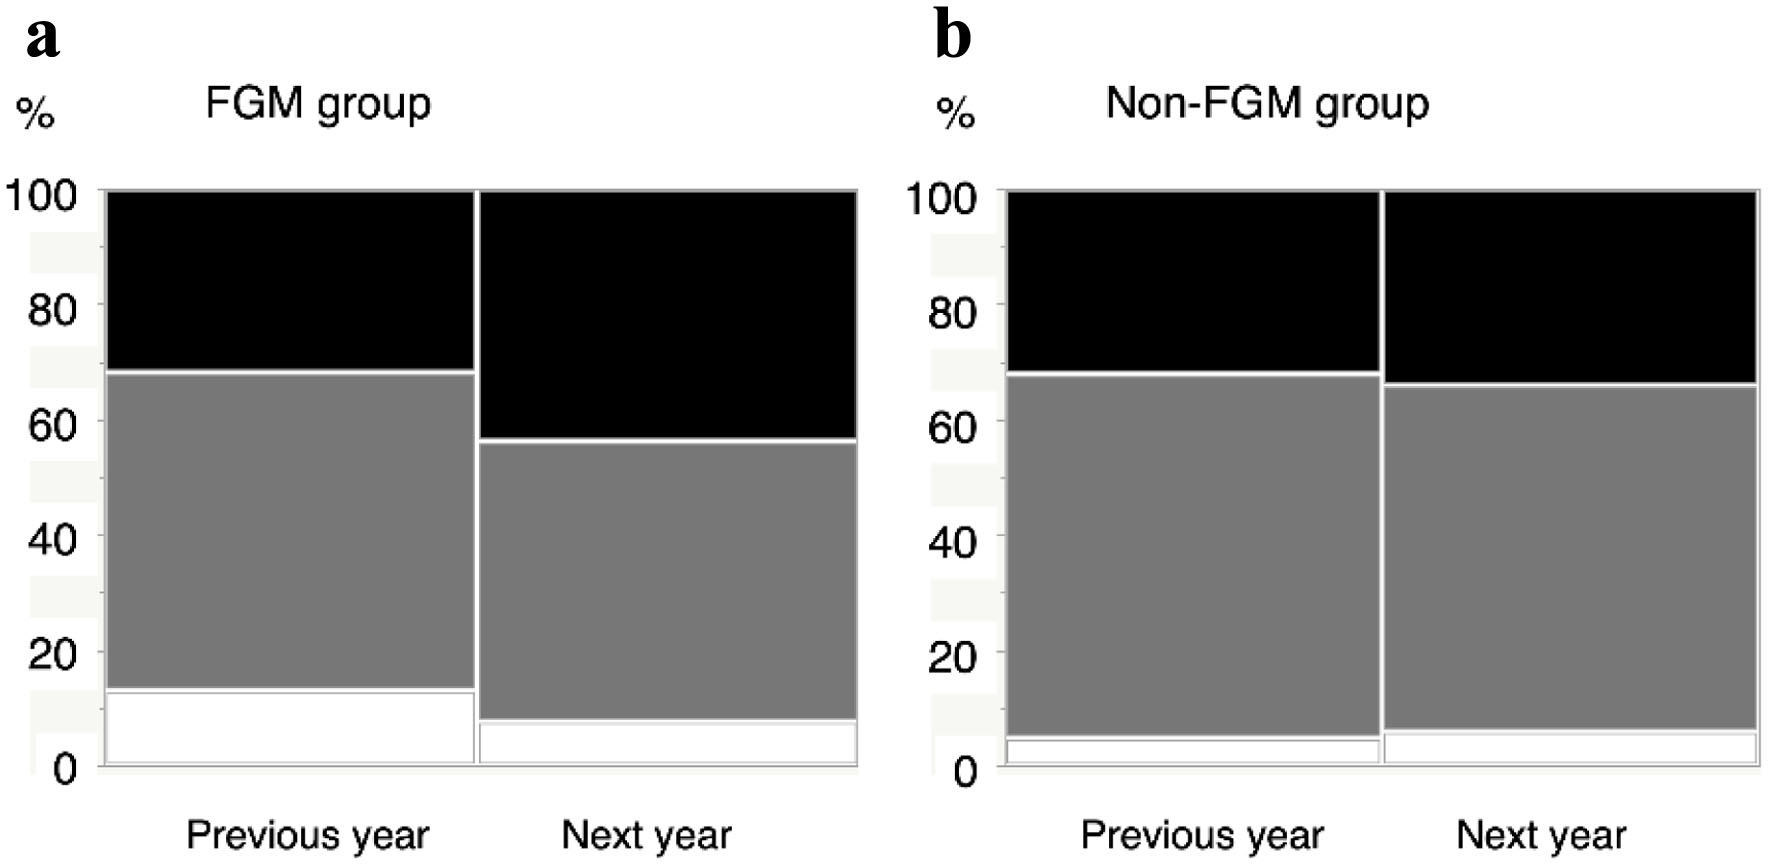
Figure 1. Trends in intention to improve lifestyle from the questionnaire on lifestyle habits at the time of regular health examinations. (a) FGM group (n = 39). (b) Non-FGM group (n = 99). Charts show percentages of subjects with the intention to improve lifestyle from the questionnaire on lifestyle habits at the time of regular health examination. “Previous year” refers to the year before the announcement of health guidance based on FGM, and “next year” refers to the year after the FGM was introduced. The FGM group was given actual guidance based on results from FGM. White, gray, and black squares indicate respondents who answered, “I have no intention of improving”, “I plan to improve soon”, and “I am positively working on improvement”, respectively. FGM: flash glucose monitoring.
Figure 2.
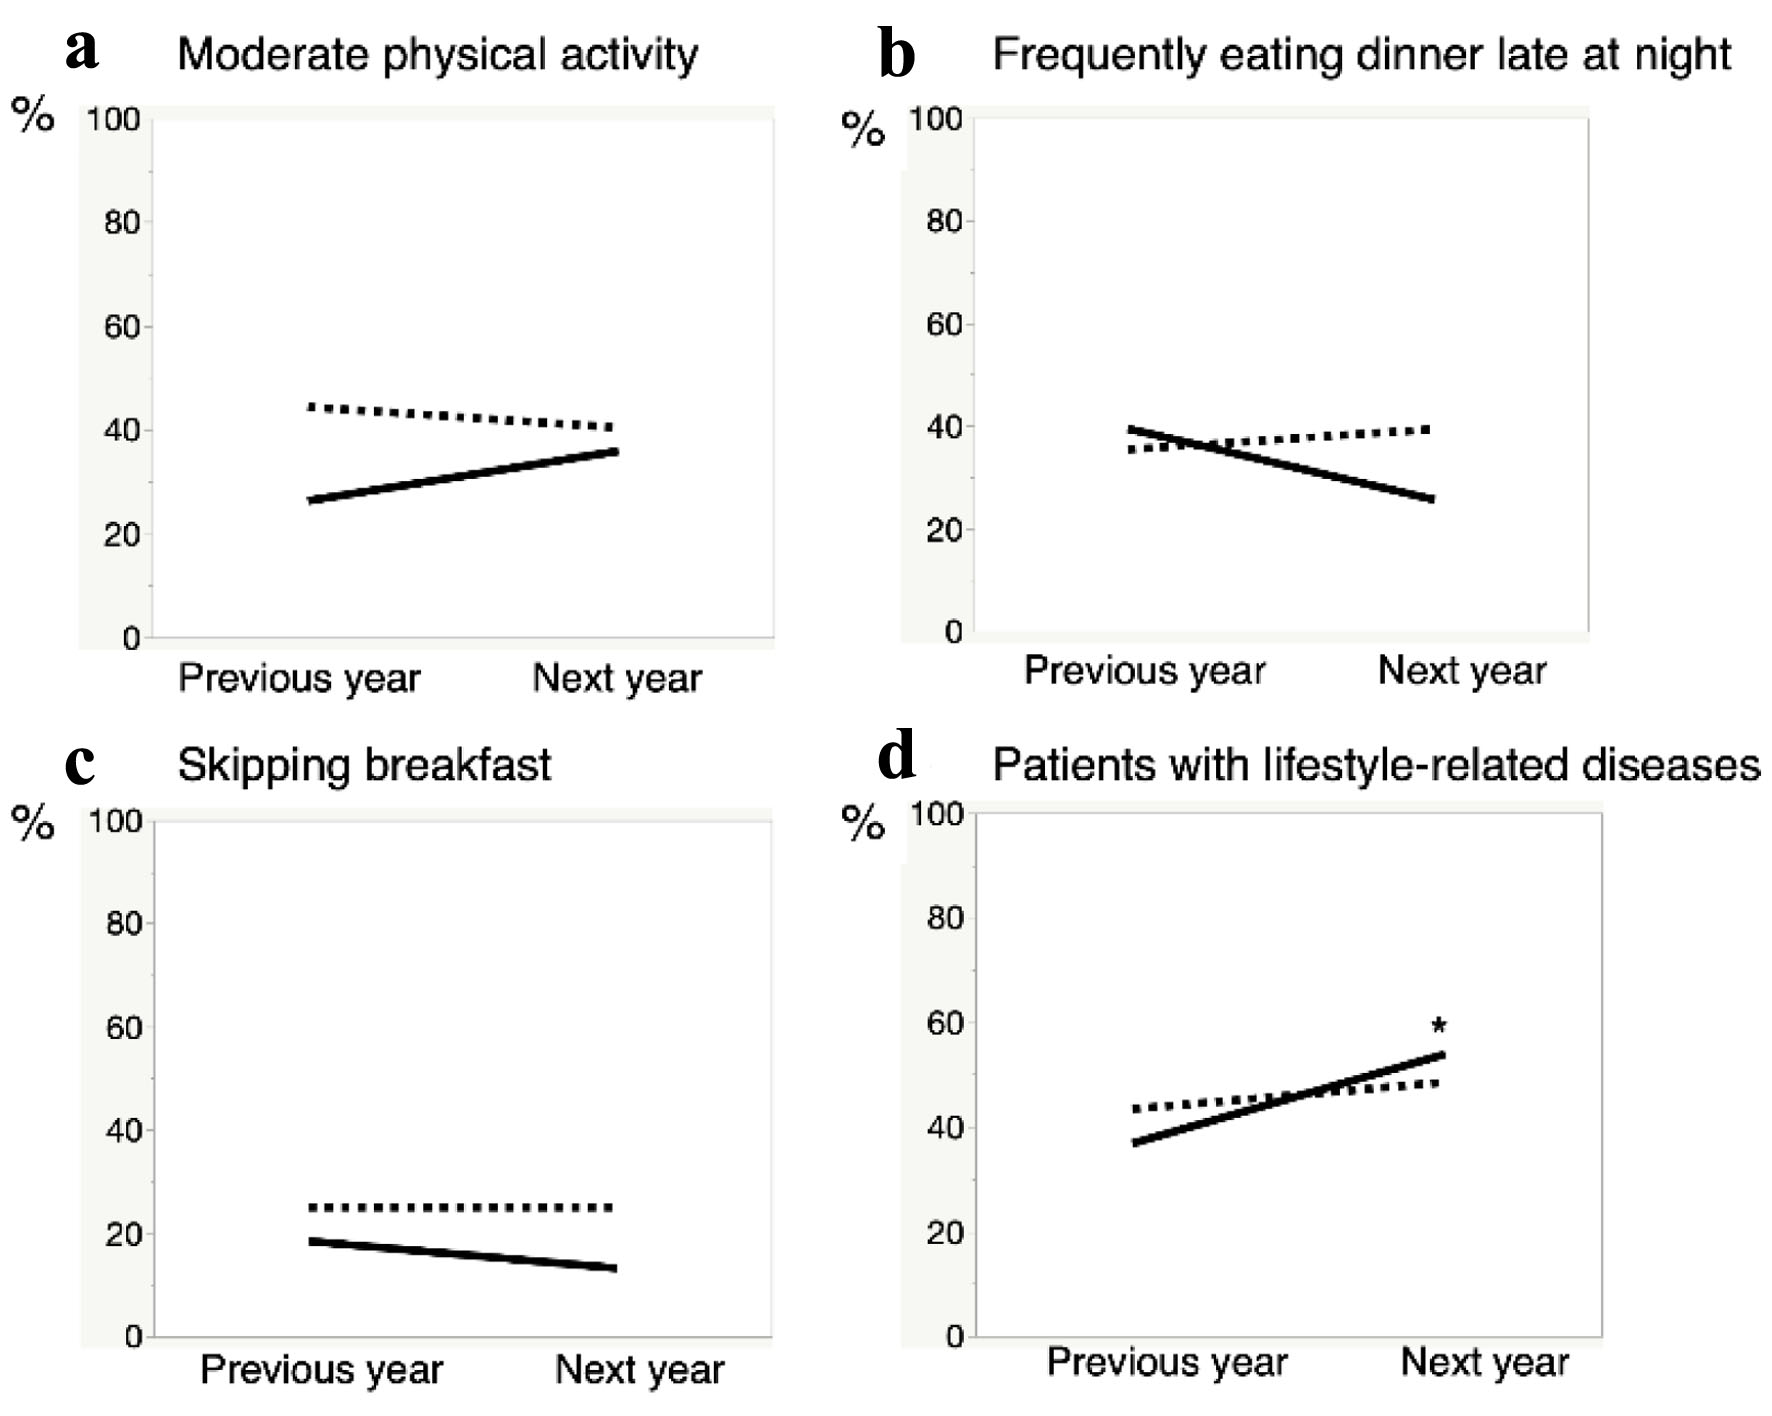
Figure 2. Changes in lifestyle between FGM and non-FGM groups. (a) Moderate physical activity. (b) Frequently eating dinner late at night. (c) Skipping breakfast. (d) Patients with lifestyle-related diseases. Graphs show percentages of subjects with moderate physical activity, frequently eating dinner late at night, skipping breakfast, and using drugs to treat lifestyle-related diseases in the previous and next years, respectively. “Previous year” refers to the year before the announcement of health guidance based on FGM, and “next year” refers to the year after the FGM was introduced. Solid line: FGM group (n = 39); dotted line: non-FGM group (n = 99). *P < 0.05 vs. previous year in the FGM group. FGM: flash glucose monitoring.
Figure 3.
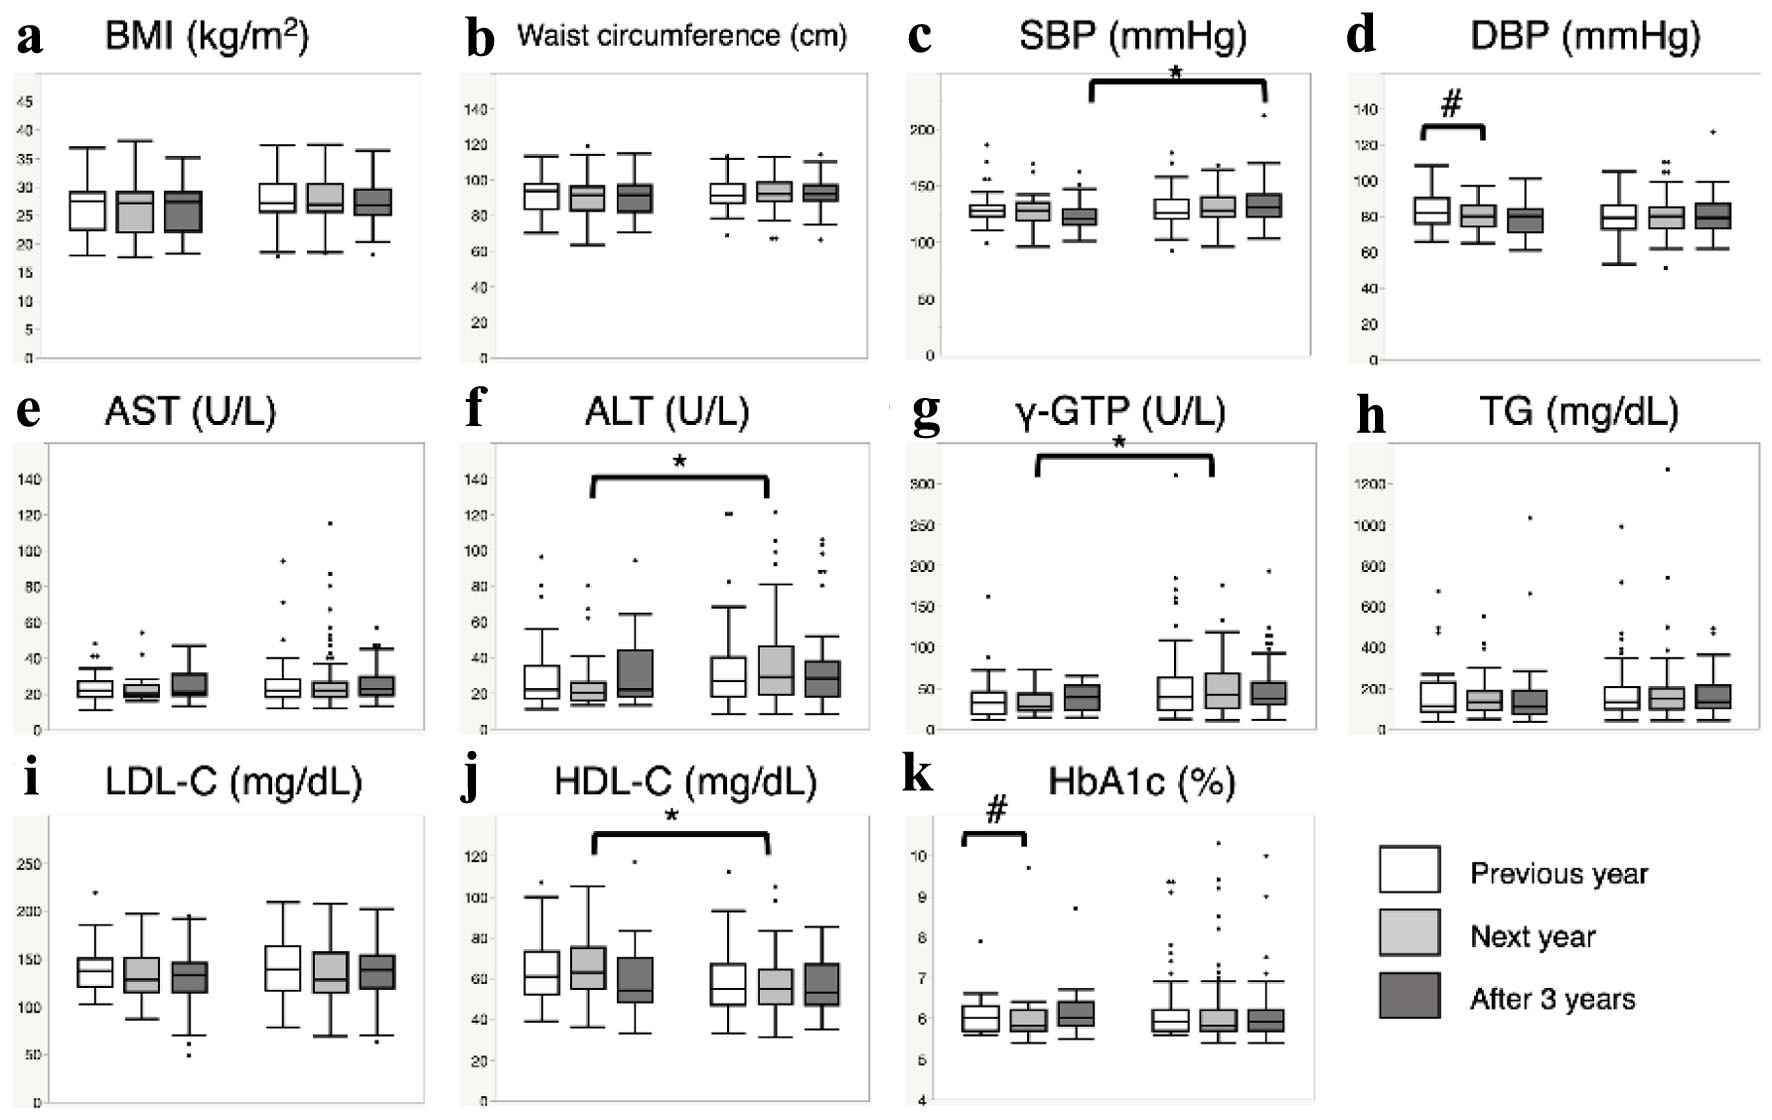
Figure 3. Changes in metabolic parameters before and after intervention with FGM. (a) Body mass index (BMI). (b) Waist circumference. (c) Systolic blood pressure (SBP). (d) Diastolic blood pressure (DBP). (e) Aspartate aminotransferase (AST). (f) Alanine aminotransferase (ALT). (g) γ-glutamyl transpeptidase (γ-GTP). (h) Triglycerides (TG). (i) Low-density lipoprotein cholesterol (LDL-C). (j) High-density lipoprotein cholesterol (HDL-C). (k) Hemoglobin A1c (HbA1c). Box plots show actual measured values (including outliers) for each metabolic parameter. White, light-gray, and dark-gray squares indicate previous year, next year, and 3 years after FGM was announced, respectively. Data on the left in each figure are for the FGM group (previous year (n = 31; except for waist circumference, n = 30), next year (n = 31; except for waist circumference, n = 30), and after 3 years (n = 19)), and data on the right side are for the non-FGM group (previous year (n = 89; except for waist circumference, n = 82), next year (n = 89; except for waist circumference, n = 82), and after 3 years (n = 60; except for waist circumference, n = 57)). Even in the FGM group, data after 3 years indicate that intervention had been completed and more than 2 years had passed since full completion of the intervention. *P < 0.05 for comparison between groups, #P < 0.05 for comparison within groups. FGM: flash glucose monitoring.

Tables

Table 1. Clinical Characteristics and Lifestyle Profiles of Study Participants
 
FGM groupNon-FGM groupP
Data are expressed as median (interquartile range) unless otherwise indicated. *Statistically significant data. ALT: alanine aminotransferase; AST: aspartate aminotransferase; BMI: body mass index; DBP: diastolic blood pressure; FGM: flash glucose monitoring; γ-GTP: γ-glutamyl transpeptidase; Hb: hemoglobin; HbA1c: hemoglobin A1c; HDL-C: high-density lipoprotein cholesterol; LDL-C: low-density lipoprotein cholesterol; SBP: systolic blood pressure; TG: triglycerides.
Number of staff3999
Proportion of medical staff (%)56.452.50.709
Sex, male (%)46.254.70.450
Age (years)52.0 (46.0 - 56.0)52.0 (44.0 - 57.0)0.878
Height (cm)162.4 (158.8 - 169.9)165.5 (157.9 - 171.1)0.499
Weight (kg)71.1 (62.0 - 80.4)75.7 (66.7 - 83.1)0.116
BMI (kg/m2)27.3 (22.6 - 29.0)27.2 (25.5 - 30.6)0.165
Waist circumference (cm)92.0 (83.0 - 96.9) (n = 38)91.3 (87.0 - 97.9) (n = 92)0.466
SBP (mm Hg)128.0 (124.0 - 138.0)128.0 (121.0 - 141.0)0.732
DBP (mm Hg)82.0 (76.0 - 90.0)80.0 (73.0 - 87.0)0.140
AST (U/L)24.0 (19.0 - 28.0)22.0 (18.0 - 29.0)0.551
ALT (U/L)22.0 (17.0 - 37.0)28.0 (18.0 - 40.0)0.526
γ-GTP (U/L)34.0 (19.0 - 61.0)40.0 (23.0 - 67.0)0.248
TG (mg/dL)115.0 (92.0 - 221.0)132.0 (93.0 - 202.0)0.553
LDL-C (mg/dL)138.0 (123.0 - 158.0)139.0 (114.0 - 162.0)0.623
HDL-C (mg/dL)61.0 (48.0 - 71.0)55.0 (47.0 - 66.0)0.247
HbA1c (%)6.0 (5.7 - 6.4)5.9 (5.7 - 6.2)0.323
Hb (%)14.3 (13.7 - 15.3)14.8 (13.9 - 15.5)0.493
Current smoking (%)5.3 (n = 38)10.10.510
Alcohol consumption (%)18.2 (n = 38)14.10.579
Regular exercise (%)21.1 (n = 38)23.21.000
History of weight gain (%)57.9 (n = 38)68.70.237
Eating quickly (%)47.4 (n = 38)49.50.771
Requested health guidance (%)55.3 (n = 38)*34.3*0.032*


Table 2. Comparison of Changes in Metabolic Parameters With or Without FGM Intervention
 
Next yearAfter 3 years
FGMNon-FGMPFGMNon-FGMP
Amounts of change at 1 and 3 years after intervention are described. A decrease in BMI is defined as a change of -1 kg/m2 or more, and an increase as defined as +1 kg/m2 or more. Data are expressed as median (interquartile range) unless otherwise indicated. *Statistically significant data. ALT: alanine aminotransferase; AST: aspartate aminotransferase; BMI: body mass index; DBP: diastolic blood pressure; FGM: flash glucose monitoring; γ-GTP: γ-glutamyl transpeptidase; HbA1c: hemoglobin A1c; HDL-C: high-density lipoprotein cholesterol; LDL-C: low-density lipoprotein cholesterol; SBP: systolic blood pressure.
Number of staff31891960
Sex, male (%)45.253.90.41347.456.70.599
BMI (kg/m2)-0.2 (-1.4 - 0.6)0.2 (-0.4 - 0.6)0.076-0.7 (-1.1 - 0.2)-0.1 (-0.6 - 0.8)0.053
Waist circumference (cm)-1.0 (-2.6 - 1.1) (n = 30)*0.3 (-1.0 - 1.6) (n = 82)*0.041*-1.9 (-4.2 - 1.8)*1.0 (-1.7 - 3.2) (n = 57)*0.026*
SBP (mm Hg)-1.0 (-10.0 - 5.0)2.0 (-5.5 - 9.0)0.102-6.0 (-12.0 - 5.0)*1.0 (-5.0 - 12.8)*0.018*
DBP (mm Hg)-3.5 (-9.0 - 2.0)*0.0 (-5.0 - 6.0)*0.025*-2.0 (-10.0 - 2.0)*3.0 (-4.0 - 6.0)*0.023*
AST (U/L)-1.0 (-5.0 - 1.0)0.0 (-2.0 - 4.5)0.0840.0 (-4.0 - 3.0)0.5 (-3.8 - 6.8)0.748
ALT (U/L)-2.0 (-9.0 - 2.0)*0.0 (-2.0 - 7.5)*0.015*-1.0 (-7.0 - 7.0)-0.5 (-6.0 - 10.8)0.796
γ-GTP (U/L)-1.0 (-12.0 - 4.0)1.0 (-2.5 - 8.0)0.0770.0 (-12.0 - 4.0)0.5 (-13.5 - 5.0)0.757
TG (mg/dL)6.0 (-43.0 - 24.0)3.0 (-29.0 - 36.0)0.594-13.0 (-63.0 - 9.0)3.5 (-28.3 - 43.0)0.150
LDL-C (mg/dL)-3.0 (-14.0 - 6.0)-2.0 (-16.0 - 11.5)0.450-6.0 (-18.0 - 16.0)-1.0 (-11.8 - 18.0)0.181
HDL-C (mg/dL)3.0 (-3.0 - 5.0)0.0 (-4.0 - 4.0)0.0861.0 (-6.0 - 8.0)-1.0 (-5.8 - 3.0)0.516
HbA1c (%)0.0 (-0.2 - 0.0)0.0 (-0.1 - 0.1)0.1940.0 (-0.2 - 0.3)0.0 (-0.1 - 0.1)0.940
Decrease in BMI (%)32.3*10.1*0.008*26.311.70.148
Increase in BMI (%)12.913.51.00010.521.70.502


Table 3. Correlation Between Contents of the Questionnaire Survey After FGM and Age, Mean Blood Glucose Level, and Daily Number of Measurements
 
AgeNumber of daily scansAverage daily blood glucose levelMedian (mean)
ρPρPρP
Relationships between questionnaire contents after FGM and age, number of daily FGM scans, and resulting mean daily blood glucose level were examined by Spearman’s correlation analysis. Each questionnaire item was rated on a seven-point scale from 0 to 6. Median and mean values are shown in the rightmost column. *Statistically significant data. FGM: flash glucose monitoring.
Pain in blood glucose measurement-0.35760.0254*0.01280.9384-0.07560.64746 (5.5)
Blood glucose higher than expected-0.08500.6070-0.07160.6647-0.43380.0073*3 (3.1)
Blood glucose undesirably low0.01250.9397-0.08100.62400.42980.0063*5 (4.7)
Willingness to improve diet and exercise habits-0.06110.71160.29810.0653-0.11120.50036 (5.4)
Motivation to treat obesity and diabetes-0.23180.15570.32300.0449*-0.20510.21056 (5.4)
Desire to use the Libre again-0.22870.16140.20930.2010-0.24060.14016 (5.3)
Recommending the Libre to others-0.07050.6699-0.04850.7694-0.12200.45926 (5.3)
Expectation to improve lifestyle with the Libre-0.04270.7964-0.07880.63330.06610.68926 (5.6)