

| Journal of Endocrinology and Metabolism, ISSN 1923-2861 print, 1923-287X online, Open Access |
| Article copyright, the authors; Journal compilation copyright, J Endocrinol Metab and Elmer Press Inc |
| Journal website https://www.jofem.org |
Original Article
Volume 12, Number 1, February 2022, pages 19-31

Implication of Leptin and Leptin Receptor Gene Variations in Type 2 Diabetes Mellitus: A Case-Control Study
Roohi Ashrafa, c ![]() , Mosin Saleem Khana, Suhail Shafi Lonea, Mohammad Hayat Bhatb, Samia Rashidb, Sabhiya Majida, Haamid Bashira
, Mosin Saleem Khana, Suhail Shafi Lonea, Mohammad Hayat Bhatb, Samia Rashidb, Sabhiya Majida, Haamid Bashira
aDepartment of Biochemistry, Government Medical College Srinagar and Associated SMHS & Super Speciality Hospital, Karan Nagar – 190010, Srinagar, J&K, India
bDepartment of Medicine, Government Medical College Srinagar and Associated SMHS & Super Speciality Hospital, Karan Nagar – 190010, Srinagar, J&K, India
cCorresponding Author: Roohi Ashraf, Department of Biochemistry, Government Medical College Srinagar and Associated Hospitals, Karan Nagar - 190010, Srinagar, J&K, India
Manuscript submitted October 29, 2021, accepted November 23, 2021, published online February 15, 2022
Short title: Leptin Gene Variations in T2DM
doi: https://doi.org/10.14740/jem785
| Abstract | ▴Top |
Background: Global increase in the prevalence of type 2 diabetes mellitus (T2DM) has affected about 6% of the population and is one of the major healthcare challenges worldwide. Apart from other factors, genetics play a pivotal role in the development of diabetes. Recent studies have drawn attention to the role of leptin (LEP) and leptin receptor (LEPR) gene polymorphisms in the pathogenesis of T2DM, that being the reason for the uptake of this study.
Methods: A total of 390 T2DM cases and 408 controls matched with respect to age and gender were taken for the study. Biochemical analysis was performed on all study subjects. Polymerase chain reaction (PCR) amplification of the genomic regions encompassing the single nucleotide polymorphisms (SNPs) under study was followed by digestion using specific restriction enzymes to analyze the SNP genotype through restriction fragment length polymorphism (RFLP).
Results: Serum leptin levels were elevated in 57.9% (226 of 390) of cases as compared to 11.8% (48 of 408) of controls (P < 0.0001). Cases had significant homeostatic model assessment-insulin resistance (HOMA-IR) as compared to controls (5.3 ± 5.9 vs. 1.4 ± 0.4; P < 0.0001). In case of LEP G2548A SNP, the frequency of a variant genotype (GA + AA) was found to be higher for cases than controls (69.7% vs. 29.4%; P < 0.0001). For LEPR Q223R SNP, the frequency of a variant genotype (AG + GG) was found to be higher for cases than controls (69.2% vs. 23.6%; P < 0.0001).
Conclusion: We observed a significant association between the LEP/LEPR polymorphisms and T2DM in the ethnic population of Kashmir indicating that genetic susceptibility may play an important role in the pathogenesis of T2DM.
Keywords: Leptin; Leptin receptor; Polymorphism; T2DM; Restriction fragment length polymorphism
| Introduction | ▴Top |
Type 2 diabetes mellitus (T2DM) is a multifactorial disease that results from a genetic predisposition and various behavioral and environmental risk factors [1]. Its increasing trend around the world has led researchers as well as healthcare professionals to carry out studies in various ethnic populations for the identification of biomarkers so as to understand the etiology of T2DM more clearly.
The satiety hormone, leptin (LEP, also called OB for obese) is an adipokine primarily produced in adipocytes that regulate the energy expenditure and the intake of food. It plays a vital role in the regulation of glucose homeostasis and insulin sensitivity [2, 3]. Besides, it has also been suggested that leptin could affect the serum insulin levels and the development of T2DM [4] and is involved in the pathophysiology of obesity [5]. The LEP gene, located at chromosome 7q31.3, encodes a 16 kDa protein that has been consistently shown to be associated with endocrine metabolism [6]. Leptin exerts its physiological action through its receptor (LEPR, also called CD295). LEPR gene is located at chromosome 1p31, and encodes for 1165 amino acid long single transmembrane protein distributed in many tissue types [7]. The LEPR gene is also called the T2DM gene [8], which is the reason that LEP and its receptor, LEPR, may be among the interesting and relevant genes responsible for the etiopathogenesis of T2DM.
LEP and LEPR genes are highly polymorphic and a number of SNPs have been identified in these two genes [4, 9, 10] that are potentially related to the pathophysiology of obesity, diabetes, and their associated complications [8]. As per the majority of studies, LEP G2548A SNP has been associated with T2DM and its related metabolic traits [11]. Accordingly, LEPR Q223R SNP has been associated with an increased risk of T2DM [12]. In addition, the relationship between the LEP G2548A and LEPR Q223R variant and increased body mass index (BMI) was reported in different ethnic populations [13, 14]. Moreover, the combination between LEP G2548A and LEPR Q223R polymorphisms has been related to increase in obesity [15]. It has been reported that obesity is a major risk factor for the development of T2DM; therefore, genetic variations of leptin signalling mediators might play a role in the pathogenesis of this disease.
Although relationship between LEP/LEPR gene polymorphisms and T2DM has been shown in a racial-dependent fashion by majority of studies [13, 14], very few studies report the association of LEP/LEPR gene variations with T2DM individuals from Kashmir valley. Subsequently, the present study was conceived to determine the possible association between the LEP/LEPR SNPs and T2DM and its related metabolic quantitative traits in a group of Kashmiri individuals.
| Materials and Methods | ▴Top |
Study design
This was a case-control study carried out by the Department of Biochemistry and Internal Medicine, Government Medical College Srinagar and Associated Shri Maharaja Hari Singh (SMHS) hospital. Details of the participants were recorded and maintained in password-protected electronic excel sheets.
The study was carried out from May 2019 to Aug 2021 after being approved by the Institutional Review Board of Government Medical College Srinagar (vide Ref No. 140/ETH/GMC/ICM Dated: 22-05-2019). This study was conducted in compliance with the ethical standards of the responsible institution on human subjects as well as with the 1964 Helsinki Declaration and its later amendments, or comparable ethical standards.
Study subjects and sample collection
A total of 390 cases diagnosed with T2DM, attending the Endocrinology Outpatient Department (OPD) of SMHS Hospital were taken for the study. Individuals with chronic infectious diseases, cancer, and genetic abnormalities were excluded from the study. In addition, 408 apparently age- and gender-matched healthy controls were also included in the study. A 10 - 12 h fasting venous blood sample (5 mL) was collected from all the study subjects. Three milliliters of collected blood were transferred in EDTA containing vials for genetic analysis. Rest 2 mL of blood was transferred in clot activator vials and centrifuged for separation of serum. Serum was quickly transferred in a microfuge tube which was stored at -80 °C along with EDTA vials containing whole blood, till further analysis.
Anthropometric measurements and BMI calculation
All the T2DM patients and healthy controls underwent anthropometric assessment that included measurement of weight and height. Weight was measured without shoes using digital scales in an upright position and recorded to the nearest of 0.1 kg. Height was measured again without shoes in a standing position using a stadiometer to the nearest 0.1 cm [16]. BMI was calculated as per the formula: BMI (kg/m2) = Weight (kg)/Height (m2). BMI is an index of adiposity and was calculated as per the international classification given by WHO [17]. Individual with BMI of < 18.5 kg/m2 was considered underweight; 18.5 - 24.99 kg/m2 as normal; 25 - 29.99 kg/m2 as preobese; 30 - 34.99 kg/m2 as obese class I; and 35 - 39.99 kg/m2 as obese class II [18].
Biochemical analysis
Collected samples of cases and controls were processed and analyzed on ARCHITECT c-4000 fully automated biochemistry analyzer (Abbott, USA) in the Biochemistry Diagnostic Laboratory, SMHS Hospital Srinagar within 1 - 2 h after collection. Following lab investigations were done: fasting blood glucose/glycosylated hemoglobin (HbA1c)/cholesterol/triglycerides (TG)/high-density lipoprotein cholesterol (HDL-C)/low-density lipoprotein cholesterol (LDL-C). All estimations done were kit-based using the manufacturer’s instructions (Abbott, USA). The normal values of included parameters were as follows: fasting blood glucose, 100 - 126 mg/dL; HbA1c < 6.5%; total cholesterol ≤ 200 mg/dL; TG ≤ 200 mg/dL; LDL-C ≤ 120 mg/dL; HDL-C ≥ 40 mg/dL (M) and ≥ 50 mg/dL (F).
Estimation of fasting serum insulin levels and calculation of insulin resistance (IR)
Fasting serum insulin levels (µIU/mL) were measured using chemiluminescent microparticle immunoassay (CMIA) technology with flexible assay protocols, referred to as Chemiflex. Samples were quantitatively analyzed on ARCHITECT i2000 fully automatic immunoassay analyzer (Abbott, USA) within few hours from sample collection following the package-insert instructions (Abbott, USA). Insulin levels of > 5 µIU/mL are considered to be normal [17].
Homeostatic model assessment-insulin resistance (HOMA-IR) was used to evaluate IR, using the formula [17]:
Following HOMA score was used as reference for classification of IR: < 1.9 for insulin sensitive, 1.9 - 2.9 for low IR and > 2.9 for significant IR [17].
Estimation of serum leptin levels
Serum leptin levels were estimated by sandwich enzyme-linked immunosorbent assay (ELISA) using commercially available kit (DBC Diagnostics Biochem, Canada Inc.) according to the manufacturer’s instructions and previously described protocol [16]. For reference normal range, 3.7 - 11.1 ng/mL was taken for female gender and 2.0 - 5.6 ng/mL for males of all age groups. The sensitivity of the leptin assay was < 0.1 ng/mL [17].
DNA isolation and genotyping
Genomic DNA was isolated by GenElute Blood Genomic DNA Kit (Sigma Life Science USA) following the kit instructions and manufacturer’s protocol. The integrity of the genomic DNA was examined by gel electrophoresis using 1% agarose gel and visualized on Gel Imaging System (Omega Lum GCW, Aplegen). The DNA samples showing bright and intact bands with no apparent shearing and contamination were selected for further analysis. The purity of extracted genomic DNA samples was carried out by absorbance measurements at 260 and 280 nm using NanoDrop 2000/2000c (Thermo Fisher Scientific, USA). DNA samples with an A260/A280 ratio of 1.7 - 1.9 were considered for further analysis. DNA was aliquoted into three to four tubes so as to protect damage from freeze-thawing and stored in -80 °C deep freezer for a longer duration of time.
Polymerase chain reaction (PCR)-RFLP
The polymorphisms LEP G2548A and LEPR Q223R were detected by PCR-based RFLP methods using a previously described protocol with appropriate modifications [19]. Primers used were: LEP gene: forward: 5′-TCCCATGAGAACTATTCTTCTTTTG-3′; reverse: 5′-ATATGGCTCCCTTTGCCCGACC-3′, LEPR gene: forward: 5′-ACCTCTGGTTCCCCAAAAAG-3′, reverse: 5′-TCATCATTTTAGTGCATAACTTACCC-3′. The PCR procedure was performed in a 25 µL reaction mixture containing 3 - 4 µL of genomic DNA, 0.56 µM of each primer, 0.28 mM deoxynucleotide triphosphate (dNTP) mix (ThermoScientific, USA), 2.1 mM of MgCl2, 0.7 - 1 U Taq polymerase, and 1× PCR buffer (3B Biotools, France). Nuclease-protease free water was added to make up the final volume to 25 µL. The PCR was carried out in the thermal cycler (Eppendorf Master cycler PRO S, USA) with pre-set thermocycling conditions consisting of: an initial denaturation step of 6 min at 95 °C, followed by 35 cycles of 30 s at 95 °C, 45 s at 60 °C (for LEP), 45 s at 58 °C (for LEPR), and 45 s at 72 °C, and a final elongation step of 10 min at 72 °C.
Ten microliters of PCR product were digested with restriction enzymes (Thermo Fisher Scientific, USA), HhaI for LEP, and MspI for LEPR, for 16 h at 37 °C according to the manufacturers’ instructions [20]. The LEP G2548A homozygous variant genotype (AA) that lacks HhaI restriction site was defined by a 451 bp fragment, while as homozygous wild genotype (GG), which contains this restriction site, was characterized by two digested bands of 402 and 49 bp. The heterozygous (GA) genotype was characterized by 451, 402 and 49 bp bands, respectively. On the other hand, LEPR Q223R wild genotype (AA), which is deficient in MspI restriction site, was represented by a 212 bp fragment, whereas variant genotype (GG), containing the restriction site, was represented by two bands of 151 and 61 bp while as heterozygous (AG) showed the presence of 212, 151 and 61 bp bands, respectively. Thirty percent of samples were repeated at random to verify the reproducibility. The digestion products were separated on 3% agarose gels stained with 0.01 µg ethidium bromide and visualized on Gel Imaging System (Omega Lum GCW, Aplegen). The accuracy of genotyping was evaluated by performing duplicate analysis of 30% of the randomly selected samples.
Statistical analysis
Categorical variables were set for presenting and calculating numbers and percentages for different genotypes of LEP and LEPR polymorphisms. Statistical significance for the departure of a genotype frequency from its expected frequency under the Hardy-Weinberg equilibrium (HWE) model was set at P value ≤ 0.05. Conditional logistic regression models using univariate and multivariate analysis were used to calculate odds ratios (ORs) and corresponding 95% confidence intervals (95% CIs) to assess the association of the genotypes with T2DM. Data were analyzed using SPSS v 23.0 software (Chicago, IL). Two-sided P values ≤ 0.05 were considered statistically significant.
| Results | ▴Top |
Characteristics of study subjects
A total of 390 T2DM cases were taken for the elucidation of serum leptin levels along with the polymorphic analysis of LEP and LEPR genes. The cases and controls were matched with respect to mean age, gender, total cholesterol, LDL-C and HDL-C levels (P > 0.05). The number of cases in the age group of < 50 years (206/390; 52.8%) exceeded those ≥ 50 years (184/390; 47.1%) with a mean age of 47.39 ± 12.61 years. In this study, 42.5% (166 of 390) of the cases were males and 57.4% (224 of 390) were females with a male/female ratio of 0.7:1. Based on the dwelling, 178 (45.6%) patients were rural and 212 (54.3%) were urban dwellers. The socio-demographic, anthropometric, and biochemical characteristics of T2DM cases are shown in Table 1.
 Click to view | Table 1. Demographic and Biochemical Characteristics of T2DM Cases and Controls Included in the Study |
A total of 408 consecutive healthy controls (non-diabetic) were included for the elucidation of leptin levels and polymorphic analysis of LEP and LEPR genes, wherein 41.2% (168/408) were males and 58.8% (240/408) were females, with a mean age of 46.94 ± 6.81 years. The number of controls was greater in the age group of < 50 years as compared to ≥ 50 years (52.9% vs. 47.1%). Based on the dwelling, 144 (35.3%) controls were rural and 264 (64.7%) were urban dwellers. The socio-demographic, anthropometric, and biochemical characteristics of controls are listed in Table 1.
Serum leptin and other biochemical parameters
The serum leptin levels were elevated in 57.9% (226 of 390) of T2DM cases as compared to only 11.8% (48 of 408) controls, having elevated serum leptin levels, the difference of which was statistically significant (P < 0.0001) (Table 1). Cases had significant IR (HOMA-IR; 5.3 ± 5.9) as compared to controls (HOMA-IR; 1.4 ± 0.4). As far as BMI (kg/m2) is concerned, cases had a significantly higher mean BMI of 27.34 ± 5.05 compared to 26.82 ± 5.05 in controls (P = 0.014). The levels of other biochemical parameters in T2DM cases and controls are given in Table 2.
Click to view | Table 2. Levels of Various Biochemical Parameters of T2DM Cases and Controls |
Analysis of LEP G2548A (rs7799039) polymorphism
The genotype and allele distributions of LEP G2548A polymorphism in the cases and controls are shown in Table 3. In the present study, we analyzed the frequency of LEP G2548A SNP in T2DM patients and matched controls in order to evaluate their association with the risk of T2DM in the Kashmiri population. The representative gel pictures showing amplified products of LEP gene fragment -2548 nucleotide upstream of ATG start site and PCR-RFLP pattern of LEP G2548A polymorphism are shown in Figure 1. The frequency of a variant allele (GA + AA) was found to be higher for cases (272 of 390; 69.7%) than controls (120 of 480; 29.4%), a difference which is statistically significant (odds ratio (OR) = 5.5; P < 0.0001) suggesting that the presence of variant genotype predisposes a person to T2DM (Table 3). Also, on multivariate analysis exploiting various models, the LEP G2548A polymorphism has significant difference in the distributions of genotypes and alleles between cases and controls (P < 0.0001; Table 3).
Click to view | Table 3. Association Between Genotypic and Allelic Frequencies of the Leptin and Leptin Receptor Polymorphisms in T2DM Cases and Controls |
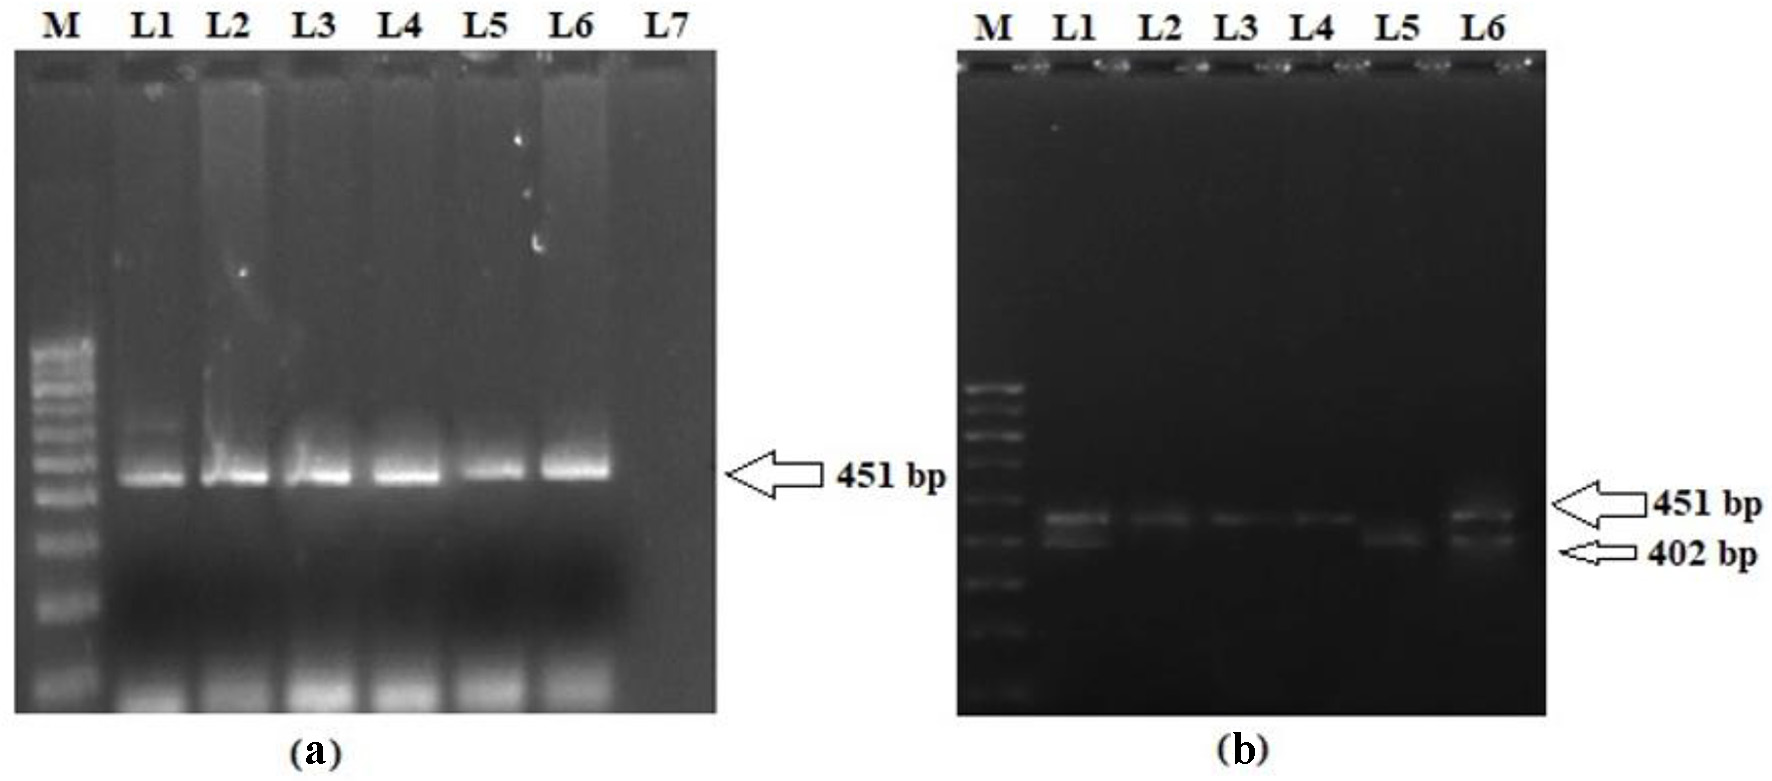 Click for large image | Figure 1. (a) Representative picture showing 451 bp PCR amplification product of 5′ end of the promoter region of LEP gene. (b) PCR-RFLP pattern of LEP G2548A polymorphism. L2, L3 and L4 represent homozygous variant genotype (AA; 451 bp); L5 represents homozygous wild genotype (GG; 402 and 49 bp); L1 and L6 represent heterozygous genotype (GA; 451, 402 and 49 bp); M: 100 bp molecular marker. PCR: polymerase chain reaction; LEP: leptin; RFLP: restriction fragment length polymorphism. |
On stratification, it was found that there was a statistically significant (P < 0.0001) difference in the frequency of LEP G2548A wild (GG) and variant genotypes (GA + AA) between cases and controls in different strata of age, gender, dwelling, family history, BMI, lipid profile, HbA1c, insulin, and HOMA-IR (Table 4). However, the frequency of variant genotype (GA + AA) was significantly higher in cases with no history of hypertension as compared to controls having no history of hypertension (69.1% vs. 9.1%; P < 0.0001). Contrary to this, statistical significance was not noted between the frequency of variant genotype (GA + AA) in hypertensive cases and controls (70.3% vs. 66.7%; P = 0.4). Interestingly, the variant genotype (GA + AA) was significantly higher in T2DM patients with normal leptin levels (P = 0.001) as compared to their control counterparts (76.8% vs. 26.7%; P < 0.0001). On the other hand, no such significant difference was found between the frequency of variant genotype (GA + AA) in T2DM cases and controls as far as groups with high leptin levels are concerned (64.6% vs. 50.0%; P = 0.07). Association of LEP G2548A genotypes with demographic/clinicopathological characteristics of cases and controls is shown in Table 4.
Click to view | Table 4. Association Between LEP G2548A Genotypes and Various Socio-Demographic and Clinicopathological Characteristics of T2DM Cases and Controls |
Analysis of LEPR Q223R (rs1137101) polymorphism
Analyzing the frequency of LEPR Q223R SNP in T2DM patients and matched controls in order to evaluate their association with the risk of T2DM in the Kashmiri population was also part of the study. The representative gel pictures showing amplified products of LEPR exon 6 and PCR-RFLP pattern of LEPR Q223R are shown in Figure 2. The genotype and allele distributions of LEPR Q223R polymorphism in the cases and controls are shown in Table 3. The frequency of a variant allele (AG + GG) was found to be higher for cases (270 of 390; 69.2%) than controls (96 of 408; 23.6%), a difference which is statistically significant (OR = 7.3; P = 0.0001) suggesting that presence of variant allele predisposes a person to T2DM (Table 3). In fact, on multivariate analysis using various models, the LEPR Q223R polymorphism has significant difference in the genotype and allele distributions between cases and controls (P < 0.0001; Table 3).
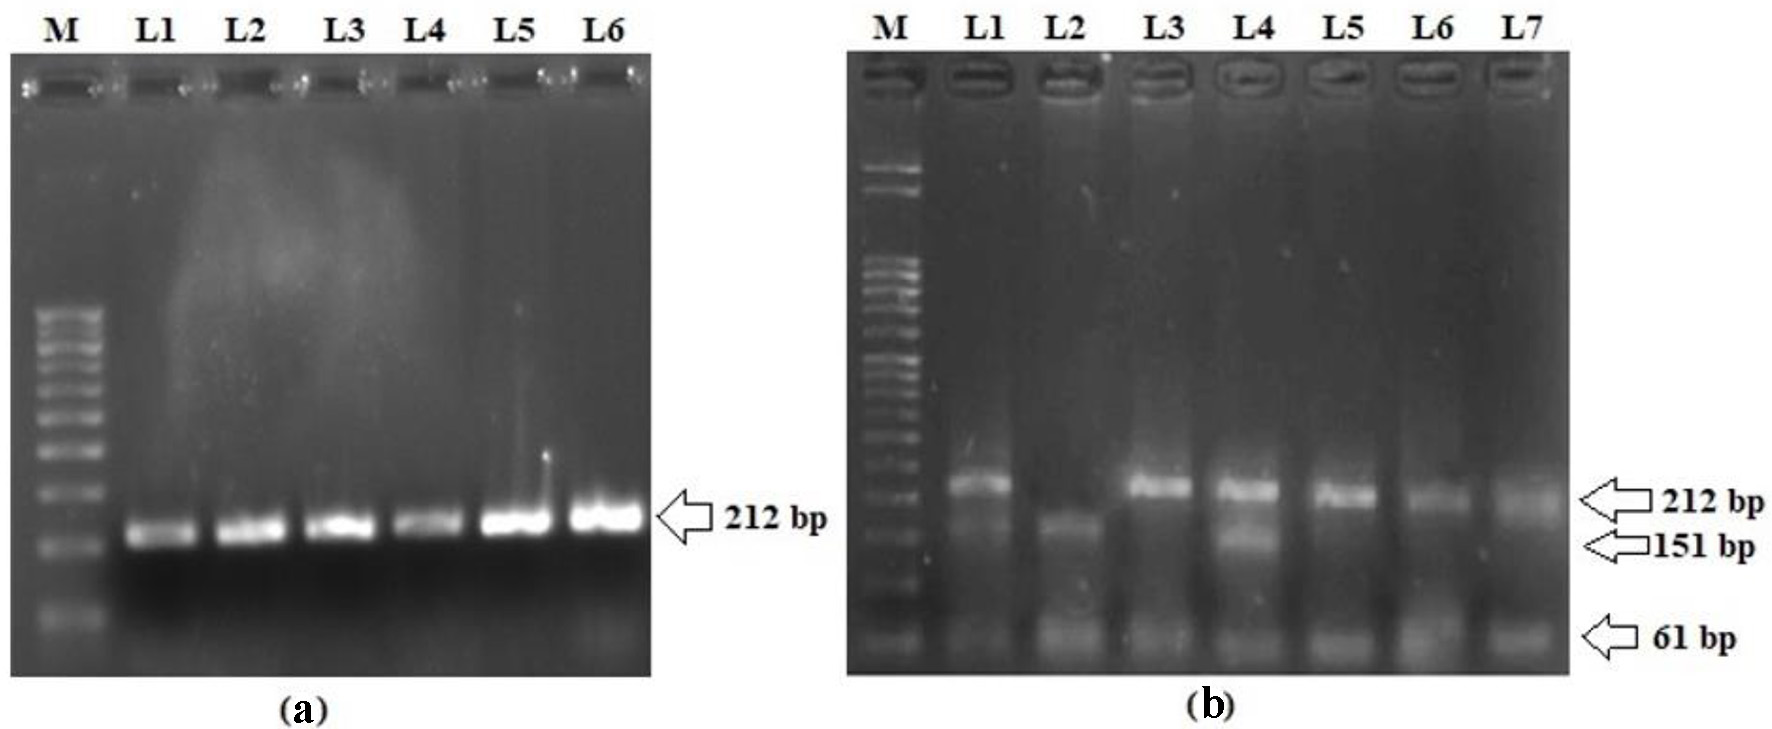 Click for large image | Figure 2. (a) Representative picture showing 212 bp PCR amplification product of exon 6 in LEPR gene. (b) PCR-RFLP pattern of LEPR Q223R polymorphism. L3, L5, L6 and L7 represent homozygous wild genotype (AA; 212 bp); L2 represents homozygous variant genotype (GG; 151 and 61 bp); L1 and L4 represent heterozygous genotype (GA; 221, 151 and 61 bp); M: 50 bp molecular marker. PCR: polymerase chain reaction; LEPR: leptin receptor; RFLP: restriction fragment length polymorphism. |
The associations of LEPR Q223R genotypes and the risk of T2DM were further stratified with respect to different subgroups of the study population in terms of different clinicopathological variables (Table 5). Statistically significant differences in the frequency of wild (AA) and variant genotypes (AG + GG) between cases and controls in different strata of age, gender, dwelling, family history, BMI, hypertension, lipid profile, HbA1c, insulin, HOMA-IR, and leptin levels were observed (P < 0.0001) (Table 5).
Click to view | Table 5. Association Between LEPR A668G (Q223R) Genotypes and Various Socio-Demographic and Clinicopathological Characteristics of T2DM Cases and Controls |
| Discussion | ▴Top |
The ethnic population of Kashmir exhibits an increased prevalence of T2DM and impaired fasting glycemia in young adults with a high frequency of undiagnosed diabetes [21], hence studying the impact of genes and genetic variations has thus become necessary in the validation of their association with various disorders. T2DM is described as a polygenic disease, often clinically called IR syndrome; the disease is closely related to hypothyroidism, hypertension, obesity, and lipid disorders [8]. Various research studies have attempted to discover the polymorphisms of important genes which are potentially involved in major human diseases and such studies provide valuable information about their genetic role in the progression of diseases [22], but the studies exploring the genetic variations or molecular mechanisms involved in the etiopathogenesis of T2DM in this population have been very meagre [23].
Leptin, a fat-derived hormone, could play a role in the regulation of energy metabolism and body lipid homeostasis after it is combined with the LEPR located in the hypothalamus and adipose tissue [7]. The present case-control study was carried out in order to investigate and also to address the discordant observations in studies related to leptin, the possible role of the LEP gene, and its receptor LEPR on the obesity traits and T2DM in the ethnic population of Kashmir. Our study showed statistically significant elevated levels of serum leptin in 57.9% of T2DM cases as compared to 11.8% of the controls. This is in accordance with various studies that have also reported elevated levels of leptin in T2DM patients apart from its involvement in microvascular complications and cardiac autonomic dysfunction [24-26]. In our study, significant IR was observed in T2DM cases as compared to controls. IR is now recognized as a component of several disorders, including T2DM [27]. There was a significantly higher percentage of T2DM case having preobesity and obesity class II as compared to control group, which is in line with majority of studies [20].
The LEP G2548A SNP is located at the 5′ end of the promoter region of LEP, and it has been suggested that this remote region may contain inhibitory elements from transcription in adipocytes [28]. In the present study, frequency of LEP G2548A SNP in T2DM was also analyzed to evaluate their association with the risk of T2DM in the Kashmiri population. The frequency of a variant genotype (GA + AA) was significantly higher in cases (69.7%) than controls (29.4%) (P < 00001). A previous study has reported a significantly higher frequency of the variant (AA) genotype in T2DM patients of China compared to the healthy subjects [29]. Roszkow et al found that the wild genotype (GG) of LEP G2548A polymorphism was significantly more common in controls than the diabetic group [30]. Taken together, these results suggest that variant genotype of LEP G2548A SNP significantly increases the risk of T2DM in different populations. The LEP G2548A variant may influence the LEP gene expression and the leptin secretion by adipose tissue [31]. Even though LEP G2548A polymorphism is close to a specificity protein 1 (SP-1) transcription factor binding site, as well as two repetitive sequences MER11 and Alu that may regulate LEP transcription, its effect on LEP expression remains to be elucidated [31].
In this study, we reported a significant association of non-synonymous LEPR Q223R polymorphism with T2DM which is suggested by the higher frequency of variant allele (AG + GG) in T2DM cases (69.2%) compared to controls (23.6%). The same association has been reported in a meta-analysis in the Chinese population [8]. Similar to our study, Fang et al and Shi et al observed the variant (G) allele of LEPR Q223R SNP to be a risk factor for T2DM [32, 33]. Salopuro et al reported that the LEPR Q223R SNP was associated with impaired glucose tolerance and conversion to T2DM [34]. Wauters et al also demonstrated an association of the LEPR Q223R SNP with glucose and insulin levels in women with impaired glucose tolerance (IGT) [35]. In another study, Chiu et al found LEPR Q223R SNP to be associated with IR in healthy Caucasian subjects [36]. It has been suggested that presence of Q223R SNP might affect the isoforms of the receptor thereby altering LEPR expression on the plasma membrane [28]. Hence, LEPR Q223R SNP may impair signal transduction through the receptor thereby increasing the risk of T2DM by influencing the neurological function of the vagus nerve, leading to IR, which in turn disrupts not only glucose metabolism but also fat metabolism [12]. Although these mechanisms are yet to be demonstrated physiologically, they provide a plausible rationale for the results from this study.
In contrast to our study, Ying et al reported wild allele (A) of LEPR Q223R SNP to be associated with an increased risk of T2DM [12]. However, numerous studies have failed to demonstrate an association between LEPR Q223R SNP and increased BMI or metabolic syndrome parameters [37, 38]. Majority of studies have shown that the LEPR Q223R SNP was not associated with T2DM and no difference in the frequency of genotypes between cases and controls was reported [30, 39, 40]. Also, no significant association was reported between the Q223R variant and glucose levels in Brazilian population [41]. These discrepancies in associations may arise due to interactions of the LEPR Q223R polymorphism with environmental factors or other polymorphisms in LEP or LEPR genes, and differences in the genetic pool of studied populations.
Limitation of the study
The limitations of the study include relatively modest sample size, ethnicity, various environmental factors, changes in dietary patterns, and other genetic factors. In spite of the association of these SNPs with T2DM, future studies are needed to investigate the association between a high number of SNPs per gene and genetic susceptibility to T2DM in massive cohorts from North India.
Conclusion
The study revealed a significant association between the LEP/LEPR polymorphisms and the development of T2DM in the ethnic population of Kashmir, indicating that genetic susceptibility plays an important role in the pathogenesis of T2DM. Identification of such precise genetic polymorphisms that impact the progression of T2DM is essential in understanding its mechanism, which can, in turn, contribute to its early diagnosis and proper management. Prospective, large-scale investigations that include assessment of the physiological effects of LEP/LEPR gene polymorphisms are needed to better understand the role of these variations in the etiopathogenesis of T2DM and related metabolic syndrome.
Acknowledgments
The authors would like to thank the Lab Technicians of the Block F, Department of Biochemistry, Government Medical College Srinagar and Associated SMHS Hospital for their technical assistance.
Financial Disclosure
The project was funded under the Multidisciplinary Research Unit (MRU) of Government Medical College Srinagar, J&K.
Conflict of Interest
There is no conflict of interest.
Informed Consent
A pre-informed consent was sort from every patient before participating in the study.
Author Contributions
Conceptualization: RA, MSK; data curation: RA, MSK, HB; formal analysis: MSK; funding acquisition: RA; investigation: RA, SSL; methodology: RA, SSL, MSK; project administration: SM, SR; resources: RA, MHB; software: MSK; supervision: RA; validation: SSL, MSK, MHB, HB; visualization: SSL; writing original draft: RA, MSK; writing review and editing: MSK; approval of final manuscript: all authors.
Data Availability
Data will be made available on request to host institute.
Abbreviations
T2DM: type 2 diabetes mellitus; LEP: leptin; LEPR: leptin receptor; SNPs: single nucleotide polymorphisms; RFLP: restriction fragment length polymorphism; SMHS: Shri Maharaja Hari Singh; OPD: outpatient department; BMI: body mass index; HbA1c: glycosylated hemoglobin; TG: triglycerides; LDL-C: low-density lipoprotein cholesterol; HDL-C: high-density lipoprotein cholesterol; CMIA: chemiluminescent microparticle immunoassay; IR: insulin resistance; HOMA-IR: homeostatic model assessment-insulin resistance; ELISA: enzyme-linked immunosorbent assay; PCR: polymerase chain reaction; dNTP: deoxynucleotide triphosphate; HWE: Hardy-Weinberg equilibrium
| References | ▴Top |
- Expert Committee on the Diagnosis. Classification of diabetes mellitus. Report of the expert committee on the diagnosis and classification of diabetes mellitus. Diabetes Care. 2000;23(Suppl 1):S4-19.
- Pan H, Guo J, Su Z. Advances in understanding the interrelations between leptin resistance and obesity. Physiol Behav. 2014;130:157-169.
doi pubmed - Friedman JM, Halaas JL. Leptin and the regulation of body weight in mammals. Nature. 1998;395(6704):763-770.
doi pubmed - Lakka HM, Oksanen L, Tuomainen TP, Kontula K, Salonen JT. The common pentanucleotide polymorphism of the 3'-untranslated region of the leptin receptor gene is associated with serum insulin levels and the risk of type 2 diabetes in non-diabetic men: a prospective case-control study. J Intern Med. 2000;248(1):77-83.
doi pubmed - Lonnqvist F, Arner P, Nordfors L, Schalling M. Overexpression of the obese (ob) gene in adipose tissue of human obese subjects. Nat Med. 1995;1(9):950-953.
doi pubmed - Unger RH, Zhou YT, Orci L. Regulation of fatty acid homeostasis in cells: novel role of leptin. Proc Natl Acad Sci U S A. 1999;96(5):2327-2332.
doi pubmed - Mantzoros CS, Moschos SJ. Leptin: in search of role(s) in human physiology and pathophysiology. Clin Endocrinol (Oxf). 1998;49(5):551-567.
doi pubmed - Li YY, Wang H, Yang XX, Wu JJ, Geng HY, Kim HJ, Yang ZJ, et al. LEPR gene Gln223Arg polymorphism and type 2 diabetes mellitus: a meta-analysis of 3,367 subjects. Oncotarget. 2017;8(37):61927-61934.
doi pubmed - Yiannakouris N, Yannakoulia M, Melistas L, Chan JL, Klimis-Zacas D, Mantzoros CS. The Q223R polymorphism of the leptin receptor gene is significantly associated with obesity and predicts a small percentage of body weight and body composition variability. J Clin Endocrinol Metab. 2001;86(9):4434-4439.
doi pubmed - Hoffstedt J, Eriksson P, Mottagui-Tabar S, Arner P. A polymorphism in the leptin promoter region (-2548 G/A) influences gene expression and adipose tissue secretion of leptin. Horm Metab Res. 2002;34(7):355-359.
doi pubmed - Meshkani R, Nasimian A, Taheripak G, Zarghooni M, Rezaei M, Sadeghi A, Eshkiki ZS. Association between Leptin G2548A and Leptin Receptor Q223R Polymorphisms with Type 2 Diabetes in an Iranian Population. Clin Lab. 2016;62(1-2):89-96.
doi - Ying J, Shi NS, Pan RW, Li PZ, Zhang HQ. Association between Gln223Arg and type 2 diabetes in Zhejing. Chin Gerontol. 2009;29:858-860.
- Shen J, Ge W, Zhang J, Zhu HJ, Fang Y. Leptin -2548g/a gene polymorphism in association with antipsychotic-induced weight gain: a meta-analysis study. Psychiatr Danub. 2014;26(2):145-151.
- Bender N, Allemann N, Mareketal D. Association between variants of the leptin receptor gene (LEPR) and overweight: a systematic review and an analysis of the Colaus study. PLoS ONE. 2011;6:1-14.
doi pubmed - Duarte SF, Francischetti EA, Genelhu VA, Cabello PH, Pimentel MM. LEPR p.Q223R, beta3-AR p.W64R and LEP c.-2548G>A gene variants in obese Brazilian subjects. Genet Mol Res. 2007;6(4):1035-1043.
- Roohi A, Tehseen H, Samia R. To study the prevalence of metabolic syndrome in the adult population of Kashmir. Int J Sci Res. 2018;7:60-63.
- Ashraf R, Khan MS, Bhat MH, Shabir I, Rashid S, Majid S. Leptins: association and clinical correlation in pre-diabetics. Int J Diabetes Dev Ctries. 2021.
doi - Preventing and managing the global epidemic. Report of a WHO consultation. World Health Organ Tech Rep Ser. 2000;894:1-253.
- Chavarria-avila E, Mercado MV, Gomez-banuelos E, Castro-albarran J, Sanchez-lopez L, Martin-marquez BT. The impact of LEP G-2548A and LEPR Gln223Arg polymorphisms on adiposity, leptin, and leptin-receptor serum levels in a Mexican mestizo population 2015. Biomed Res Int. 2015;2015:539408.
doi pubmed - Boumaiza I, Omezzine A, Rejeb J, Rebhi L, Ouedrani A, Ben Rejeb N, Nabli N, et al. Relationship between leptin G2548A and leptin receptor Q223R gene polymorphisms and obesity and metabolic syndrome risk in Tunisian volunteers. Genet Test Mol Biomarkers. 2012;16(7):726-733.
doi pubmed - Zargar AH, Wani AA, Laway BA, Masoodi SR, Wani AI, Bashir MI, Dar FA. Prevalence of diabetes mellitus and other abnormalities of glucose tolerance in young adults aged 20-40 years in North India (Kashmir Valley). Diabetes Res Clin Pract. 2008;82(2):276-281.
doi pubmed - Park KS, Shin HD, Park BL, Cheong HS, Cho YM, Lee HK, Lee JY, et al. Polymorphisms in the leptin receptor (LEPR)—putative association with obesity and T2DM. J Hum Genet. 2006;51(2):85-91.
doi pubmed - Hameed I, Masoodi SR, Afroze D, Bhat RA, Naykoo NA, Mir SA, Mubarik I, et al. CTTTA Deletion/Insertion polymorphism in 3'-UTR of LEPR gene in type 2 diabetes subjects belonging to Kashmiri population. J Diabetes Metab Disord. 2014;13(1):124.
doi pubmed - Andrade-Oliveira V, Camara NO, Moraes-Vieira PM. Adipokines as drug targets in diabetes and underlying disturbances. J Diabetes Res. 2015;2015:681612.
doi pubmed - Kurajoh M, Koyama H, Kadoya M, Naka M, Miyoshi A, Kanzaki A, Kakutani-Hatayama M, et al. Plasma leptin level is associated with cardiac autonomic dysfunction in patients with type 2 diabetes: HSCAA study. Cardiovasc Diabetol. 2015;14:117.
doi pubmed - Rodriguez AJ, Nunes Vdos S, Mastronardi CA, Neeman T, Paz-Filho GJ. Association between circulating adipocytokine concentrations and microvascular complications in patients with type 2 diabetes mellitus: A systematic review and meta-analysis of controlled cross-sectional studies. J Diabetes Complications. 2016;30(2):357-367.
doi pubmed - Singh B, Saxena A. Surrogate markers of insulin resistance: A review. World J Diabetes. 2010;1(2):36-47.
doi pubmed - Gong DW, Bi S, Pratley RE, Weintraub BD. Genomic structure and promoter analysis of the human obese gene. J Biol Chem. 1996;271(8):3971-3974.
doi pubmed - Ren W, Zhang SH, Wu J, Ni YX. Polymorphism of the leptin gene promoter in pedigrees of type 2 diabetes mellitus in Chongqing, China. Chin Med J (Engl). 2004;117(4):558-561.
- Roszkowska-Gancarz M, Kurylowicz A, Polosak J, Mossakowska M, Franek E, Puzianowska-Kuznicka M. Functional polymorphisms of the leptin and leptin receptor genes are associated with longevity and with the risk of myocardial infarction and of type 2 diabetes mellitus. Endokrynol Pol. 2014;65(1):11-16.
doi pubmed - Cummings DE, Schwartz MW. Genetics and pathophysiology of human obesity. Annu Rev Med. 2003;54:453-471.
doi pubmed - Radhika B, Sriprajna M, Usha A, Sudheendrs R. Single nucleotide polymorphism of leptin receptor gene in type 2 diabetes mellitus: a cross-sectional study. Research J. Pharm. and Tech 2020; 13(2):560-564.
doi - Shi XH, Sun L, Wang L, Jin F, Zhu XQ, Tang L, Yang Z. Association between Q223R gene polymorphism and type2 diabetes mellitus in Chinese north population. Med Res J 2012; 41:23-26.
- Salopuro T, Pulkkinen L, Lindstrom J, Eriksson JG, Valle TT, Hamalainen H, Ilanne-Parikka P, et al. Genetic variation in leptin receptor gene is associated with type 2 diabetes and body weight: The Finnish Diabetes Prevention Study. Int J Obes (Lond). 2005;29(10):1245-1251.
doi pubmed - Wauters M, Mertens I, Rankinen T, Chagnon M, Bouchard C, Van Gaal L. Leptin receptor gene polymorphisms are associated with insulin in obese women with impaired glucose tolerance. J Clin Endocrinol Metab. 2001;86(7):3227-3232.
doi pubmed - Chiu KC, Chu A, Chuang LM, Saad MF. Association of leptin receptor polymorphism with insulin resistance. Eur J Endocrinol. 2004;150(5):725-729.
doi pubmed - Mattevi VS, Zembrzuski VM, Hutz MH. Association analysis of genes involved in the leptin-signaling pathway with obesity in Brazil. Int J Obes Relat Metab Disord. 2002;26(9):1179-1185.
doi pubmed - Portoles O, Sorli JV, Frances F, Coltell O, Gonzalez JI, Saiz C, Corella D. Effect of genetic variation in the leptin gene promoter and the leptin receptor gene on obesity risk in a population-based case-control study in Spain. Eur J Epidemiol. 2006;21(8):605-612.
doi pubmed - Santaniemi M, Ukkola O, Kesaniemi YA. Tyrosine phosphatase 1B and leptin receptor genes and their interaction in type 2 diabetes. J Intern Med. 2004;256(1):48-55.
doi pubmed - Gu P, Jiang W, Chen M, Lu B, Shao J, Du H, Jiang S. Association of leptin receptor gene polymorphisms and essential hypertension in a Chinese population. J Endocrinol Invest. 2012;35(9):859-865.
- Pena GG, Guimaraes ALS, Veloso RR, Reis TC, Neto JR, Velasquez-Melendez G, et al. No association of leptin receptor gene Gln223Arg polymorphism with capillary glucose levels: a preliminary population base cross-sectional study. ISRN Genetics. 2013;2013:1-7.
doi
This article is distributed under the terms of the Creative Commons Attribution Non-Commercial 4.0 International License, which permits unrestricted non-commercial use, distribution, and reproduction in any medium, provided the original work is properly cited.
Journal of Endocrinology and Metabolism is published by Elmer Press Inc.