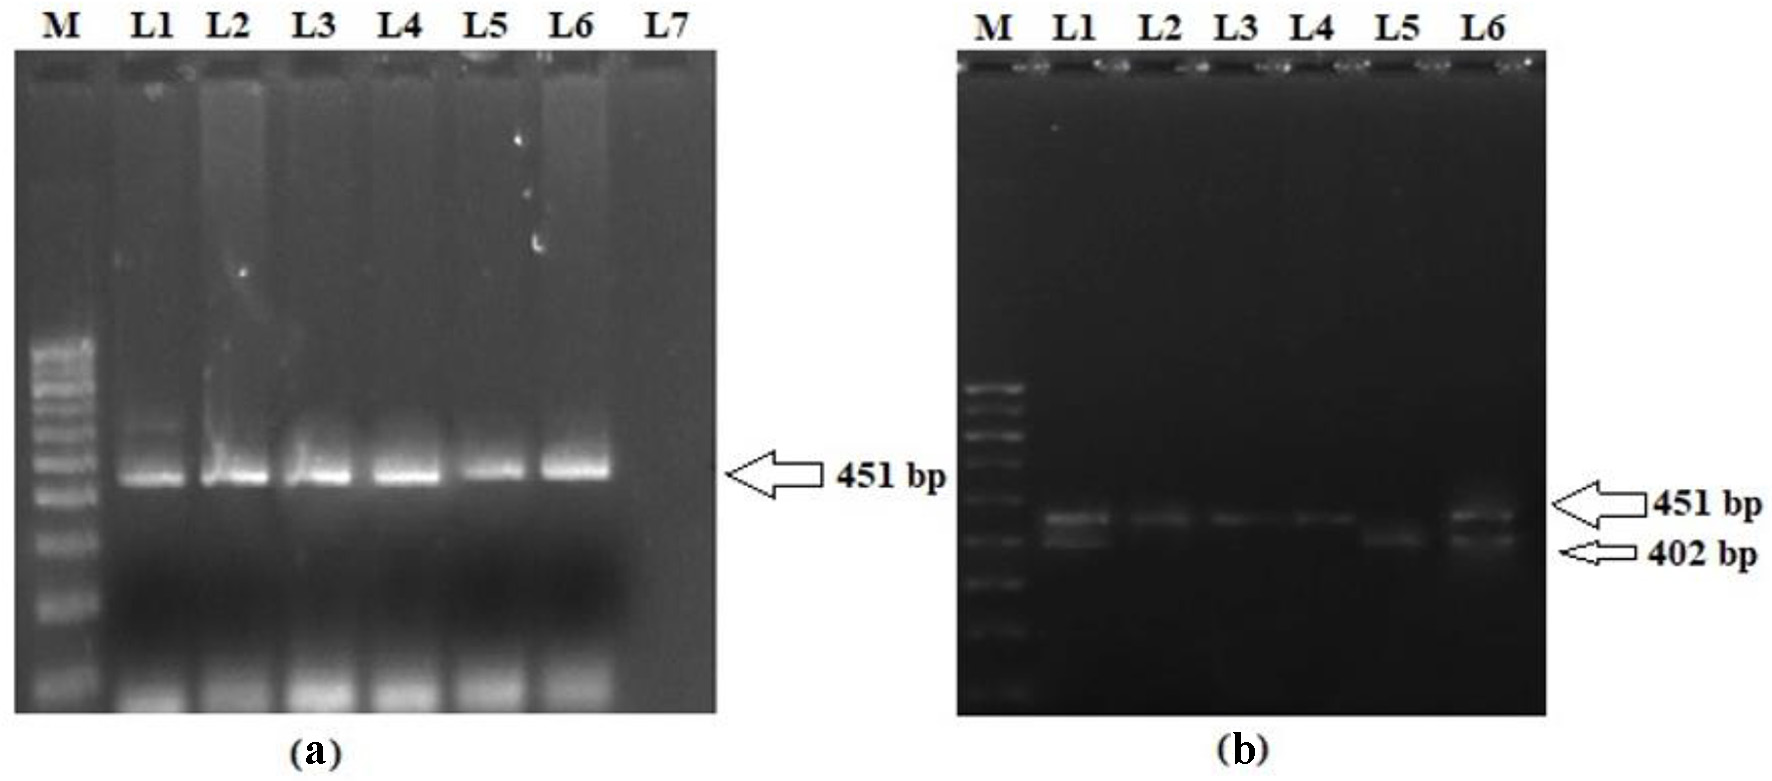
Journal of Endocrinology and Metabolism, ISSN 1923-2861 print, 1923-287X online, Open Access |
Article copyright, the authors; Journal compilation copyright, J Endocrinol Metab and Elmer Press Inc |
Journal website https://www.jofem.org |
Original Article
Volume 12, Number 1, February 2022, pages 19-31
Implication of Leptin and Leptin Receptor Gene Variations in Type 2 Diabetes Mellitus: A Case-Control Study
Figures
Tables
Characteristics | Controls (n = 408) | Cases (n = 390) | χ2 | P value | ||
---|---|---|---|---|---|---|
n | % | n | % | |||
*Statistically significant. T2DM: type 2 diabetes mellitus; BMI: body mass index (< 18.5 = underweight, 18.5 - 24.99 = normal, 25 - 29.99 = preobese, 30 - 34.99 = obese class I, 35 - 39.99 = obese class II); TG: triglycerides; LDL-C: low-density lipoprotein cholesterol; HDL-C: high-density lipoprotein cholesterol; HbA1c: glycosylated hemoglobin; HOMA-IR: homeostatic model assessment-insulin resistance. | ||||||
Age group | 0.001 | 1.0 | ||||
< 50 years | 216 | 52.9 | 206 | 52.8 | ||
≥ 50 years | 192 | 47.1 | 184 | 47.1 | ||
Gender | 0.158 | 0.72 | ||||
Male | 168 | 41.2 | 166 | 42.5 | ||
Female | 240 | 58.8 | 224 | 57.4 | ||
Dwelling | 8.869 | 0.003* | ||||
Rural | 144 | 35.3 | 178 | 45.6 | ||
Urban | 264 | 64.7 | 212 | 54.3 | ||
Family history | 27.962 | < 0.0001* | ||||
No | 216 | 52.9 | 134 | 34.3 | ||
Yes | 192 | 47.1 | 256 | 65.6 | ||
BMI (kg/m2) | 15.227 | 0.004* | ||||
Normal | 120 | 29.4 | 118 | 30.3 | ||
Underweight | 24 | 5.9 | 14 | 3.6 | ||
Preobese | 120 | 29.4 | 148 | 37.9 | ||
Obese class I | 120 | 29.4 | 78 | 20 | ||
Obese class II | 24 | 5.9 | 32 | 8.2 | ||
Hypertension | 22.107 | 0.0001* | ||||
No | 264 | 64.7 | 188 | 48.2 | ||
Yes | 144 | 35.3 | 202 | 51.8 | ||
Total cholesterol | 23.227 | < 0.0001* | ||||
Normal | 264 | 64.7 | 312 | 80 | ||
Elevated | 144 | 35.3 | 78 | 20 | ||
TG | 0.479 | 0.523 | ||||
Normal | 216 | 52.9 | 216 | 55.4 | ||
Elevated | 192 | 47.1 | 174 | 44.6 | ||
LDL-C | 8.411 | 0.004* | ||||
Normal | 312 | 76.5 | 330 | 84.6 | ||
Elevated | 96 | 23.5 | 60 | 15.4 | ||
HDL-C | 0.220 | 0.671 | ||||
Normal | 192 | 47 | 190 | 48.7 | ||
Low | 216 | 53 | 200 | 51.3 | ||
HbA1c | 434.917 | < 0.0001* | ||||
Normal | 384 | 94.1 | 84 | 21.5 | ||
High glycemic control | 24 | 5.9 | 238 | 61 | ||
Low glycemic control | 00 | 0 | 68 | 17.4 | ||
Insulin levels | 30.568 | < 0.0001* | ||||
Normal | 264 | 64.7 | 320 | 82.1 | ||
Low | 144 | 35.3 | 70 | 17.9 | ||
HOMA-IR | 345.549 | < 0.0001* | ||||
Insulin sensitive | 360 | 88.2 | 110 | 28.2 | ||
Low IR | 48 | 11.8 | 72 | 18.5 | ||
Significant IR | 00 | 0.0 | 208 | 53.3 | ||
Leptin levels | 188.638 | < 0.0001* | ||||
Normal | 360 | 88.2 | 164 | 42.1 | ||
Elevated | 48 | 11.8 | 226 | 57.9 |
Parameters | Controls, mean ± SD | Cases, mean ± SD | P value |
---|---|---|---|
*Statistically significant. T2DM: type 2 diabetes mellitus; HbA1c: glycosylated hemoglobin; BMI: body mass index (< 18.5 = underweight, 18.5 - 24.99 = normal, 25 - 29.99 = preobese, 30 - 34.99 = obese class I, 35 - 39.99 = obese class II); TG: triglycerides; LDL-C: low-density lipoprotein cholesterol; HDL-C: high-density lipoprotein cholesterol; HOMA-IR: homeostatic model assessment-insulin resistance. | |||
Age (years) | 46.94 ± 6.81 | 47.39 ± 12.61 | 0.530 |
Fasting blood sugar (mg/dL) | 90 ± 6.44 | 138.9 ± 73.26 | < 0.0001* |
HbA1c (%) | 5.64 ± 0.33 | 7.68 ± 1.68 | < 0.0001* |
BMI (kg/m2) | 26.82 ± 5.05 | 27.34 ± 5.05 | 0.0143* |
Total cholesterol (mg/dL) | 171 ± 51.57 | 165.27 ± 43.11 | 0.090 |
TG (mg/dL) | 228.24 ± 229.03 | 160.82 ± 76.76 | < 0.0001* |
HDL-C (mg/dL) | 43.76 ± 13.63 | 43.11 ± 13.87 | 0.504 |
LDL-C (mg/dL) | 96.94 ± 38.58 | 93.46 ± 37.08 | 0.195 |
Insulin levels (µIU/mL) | 6.27 ± 1.92 | 15.84 ± 16.86 | < 0.0001* |
HOMA-IR | 1.4 ± 0.4 | 5.3 ± 5.9 | < 0.0001* |
Leptin levels (ng/mL) | 7.22 ± 3.80 | 13.89 ± 9.21 | < 0.0001* |
Genotype/allele | Controls, n = 408 (%) | Cases, n = 390 (%) | Model 1 | Model 2 | Model 3 | |||
---|---|---|---|---|---|---|---|---|
OR (95% CI) | P value | OR (95% CI) | P value | OR (95% CI) | P value | |||
*Statistically significant. Model 1: unadjusted odds ratio and P value. Model 2: odds ratio and P value adjusted for age and gender using a multivariable logistic model. Model 3: odds ratio and P value adjusted for age, gender, dwelling, family history and other polymorphisms using a multivariable logistic model. T2DM: type 2 diabetes mellitus; OR: odds ratio; CI: confidence interval. | ||||||||
LEP (rs7799039; G2548A) | ||||||||
Genotype | ||||||||
GG | 288 (70.6) | 118 (30.2) | Ref. (1.00) | Ref. (1.00) | Ref. (1.00) | |||
GA | 96 (23.5) | 72 (18.5) | 1.83 (1.2 - 2.6) | 0.001* | 2.0 (1.3 - 2.9) | < 0.0001* | 1.1 (0.7 - 1.8) | 0.4 |
AA | 24 (5.9) | 200 (51.3) | 20.3 (12.6 - 32.6) | < 0.0001* | 22.5 (13.8 - 36.5) | < 0.0001* | 18.6 (10.6 - 32.4) | < 0.0001* |
GA + AA | 120 (29.4) | 272 (69.8) | 5.5 (4.0 - 7.4) | < 0.0001* | 6.1 (4.5 - 8.4) | < 0.0001* | 3.8 (2.7 - 5.6) | < 0.0001* |
Allele type | ||||||||
G | 672 (82.3) | 308 (39.5) | Ref. (1.00) | Ref. (1.00) | Ref. (1.00) | |||
A | 144 (17.7) | 472 (60.5) | 7.1 (5.6 - 9.0) | < 0.0001* | 7.7 (5.8 - 10.3) | < 0.0001* | 5.9 (4.1 - 7.9) | < 0.0001* |
LEPR (rs1137101; A668G; Q223R) | ||||||||
Genotype | ||||||||
AA | 312 (76.4) | 120 (30.8) | Ref. (1.00) | Ref. (1.00) | Ref. (1.00) | |||
AG | 48 (11.8) | 110 (28.2) | 5.9 (4.0 - 8.8) | < 0.0001* | 6.6 (4.3 - 10.1) | < 0.0001* | 6.5 (4.0 - 10.6) | < 0.0001* |
GG | 48 (11.8) | 160 (41.0) | 8.6 (5.9 - 12.7) | < 0.0001* | 9.5 (6.4 - 14.1) | < 0.0001* | 7.6 (4.6 - 12.5) | < 0.0001* |
AG + GG | 96 (23.6) | 270 (69.2) | 7.3 (5.3 - 10.0) | < 0.0001* | 8.1 (5.1 - 11.2) | < 0.0001* | 7.3 (4.9 - 10.7) | < 0.0001* |
Allele type | ||||||||
A | 672 (82.3) | 350 (44.8) | Ref. (1.00) | Ref. (1.00) | Ref. (1.00) | |||
G | 144 (17.7) | 430 (55.2) | 5.7 (4.5 - 7.2) | < 0.0001* | 6.5 (4.9 - 9.5) | < 0.0001* | 4.8 (3.6 - 6.5) | < 0.0001* |
Socio-demographic/clinicopathological parameters | LEP G2548A genotypes in controls | LEP G2548A genotypes in T2DM cases | OR (95% CI) | P value | ||||
---|---|---|---|---|---|---|---|---|
n = 408 (%) | GG, 288 (70.6) | GA + AA, 120 (29.4) | n = 390 (%) | GG, 118 (30.2) | GA + AA, 272 (69.8) | 5.5 (4.0 - 7.4) | < 0.0001* | |
*Statistically significant. T2DM: type 2 diabetes mellitus; OR: odds ratio; CI: confidence interval; BMI: body mass index (< 18.5: underweight, 18.5 - 24.99 = normal, 25 - 29.99 = preobese, 30 - 34.99 = obese class I, 35 - 39.99 = obese class II); TG: triglycerides; LDL-C: low-density lipoprotein cholesterol; HDL-C: high-density lipoprotein cholesterol; HbA1c: glycosylated hemoglobin; HOMA-IR: homeostatic model assessment-insulin resistance. | ||||||||
Age group | ||||||||
< 50 years | 216 (52.9) | 144 (66.7) | 72 (33.3) | 206 (52.8) | 70 (34.0) | 136 (66.0) | 3.88 (2.5 - 5.8) | < 0.0001* |
≥ 50 years | 192 (47.1) | 144 (75.0) | 48 (25.0) | 184 (47.1) | 48 (26.1) | 136 (73.9) | 8.5 (5.3 - 13.5) | < 0.0001* |
Gender | ||||||||
Male | 168 (41.2) | 144 (85.7) | 24 (14.3) | 166 (42.5) | 62 (37.3) | 104 (62.7) | 10.0 (5.8 - 17.1) | < 0.0001* |
Female | 240 (58.8) | 144 (60.0) | 96 (40.0) | 224 (57.4) | 56 (25.0) | 168 (75.0) | 4.5 (3.0 - 6.6) | < 0.0001* |
Dwelling | ||||||||
Rural | 144 (35.3) | 120 (83.3) | 24 (16.7) | 178 (45.6) | 56 (31.5) | 122 (68.5) | 10.8 (6.3 - 18.7) | < 0.0001* |
Urban | 264 (64.7) | 168 (63.6) | 96 (36.4) | 212 (54.3) | 62 (29.2) | 96 (36.4) | 4.2 (2.8 - 6.2) | < 0.0001* |
Family history | ||||||||
No | 216 (52.9) | 192 (88.9) | 24 (11.1) | 134 (34.3) | 34 (25.4) | 100 (74.6) | 23.5 (13.2 - 41.8) | < 0.0001* |
Yes | 192 (47.1) | 96 (50.0) | 96 (50.0) | 256 (65.6) | 84 (32.8) | 172 (67.2) | 2.0 (1.3 - 3.0) | < 0.0001* |
BMI (kg/m2) | ||||||||
Normal | 120 (29.4) | 96 (80.0) | 24 (20) | 118 (30.3) | 36 (30.5) | 82 (69.5) | 9.1 (5.0 - 16.5) | < 0.0001* |
Underweight | 24 (5.9) | 24 (100) | 0 (0.0) | 14 (3.6) | 02 (14.3) | 12 (85.7) | - | < 0.0001* |
Preobese | 120 (29.4) | 120 (100) | 0 (0.0) | 148 (37.9) | 46 (31.1) | 102 (68.9) | - | < 0.0001* |
Obese class I | 120 (29.4) | 48 (40.0) | 72 (60) | 78 (20.0) | 22 (28.2) | 56 (71.8) | 1.6 (0.9 - 3.1) | 0.061 |
Obese class II | 24 (5.9) | 0 (0.0) | 24 (100) | 32 (8.2) | 12 (37.5) | 20 (62.5) | - | < 0.0001* |
Hypertension | ||||||||
No | 264 (64.7) | 240 (90.9) | 24 (9.1) | 188 (48.2) | 58 (30.9) | 130 (69.1) | 22.4 (13.3 - 37.7) | < 0.0001* |
Yes | 144 (35.3) | 48 (33.3) | 96 (66.7) | 202 (51.8) | 60 (29.7) | 142 (70.3) | 1.1 (0.7 - 1.8) | 0.482 |
Total cholesterol | ||||||||
Normal | 264 (64.7) | 168 (63.6) | 96 (36.4) | 312 (80.0) | 92 (29.5) | 220 (70.5) | 4.1 (2.9 - 5.9) | < 0.0001* |
Elevated | 144 (35.3) | 120 (83.3) | 24 (16.7) | 78 (20.0) | 26 (33.3) | 52 (66.7) | 10.0 (5.2 - 19.0) | < 0.0001* |
TG | ||||||||
Normal | 216 (52.9) | 168 (77.8) | 48 (22.2) | 216 (55.4) | 54 (25.0) | 162 (75) | 10.5 (6.7 - 16.3) | < 0.0001* |
Elevated | 192 (47.1) | 120 (62.5) | 72 (37.5) | 174 (44.6) | 64 (36.8) | 110 (63.2) | 2.8 (1.8 - 4.3) | < 0.0001* |
LDL-C | ||||||||
Normal | 312 (76.5) | 216 (69.2) | 96 (30.8) | 330 (84.6) | 102 (30.9) | 228 (69.1) | 5.02 (3.5 - 7.0) | < 0.0001* |
Elevated | 96 (23.5) | 72 (75.0) | 24 (25.0) | 60 (15.4) | 16 (26.7) | 44 (73.3) | 8.2 (3.9 - 17.2) | < 0.0001* |
HDL-C | ||||||||
Normal | 192 (47.0) | 144 (75.0) | 48 (25.0) | 190 (48.7) | 54 (28.4) | 136 (71.6) | 7.55 (4.7 - 11.8) | < 0.0001* |
Low | 216 (53.0) | 144 (66.7) | 72 (33.3) | 200 (51.3) | 64 (32.0) | 136 (68.0) | 4.2 (2.8 - 6.4) | < 0.0001* |
HbA1c | ||||||||
Normal | 384 (94.1) | 264 (68.7) | 120 (31.3) | 84 (21.5) | 18 (21.4) | 66 (78.6) | 8.0 (4.5 - 14.1) | < 0.0001* |
High glycemic control | 24 (5.9) | 24 (100) | 0 (0.0) | 238 (61.0) | 82 (34.5) | 156 (65.5) | - | < 0.0001* |
Low glycemic control | 0 (0.0) | 0 (0.0) | 0 (0 .0) | 68 (17.4) | 18 (26.5) | 50 (73.5) | - | < 0.0001* |
Insulin levels | ||||||||
Normal | 264 (64.7) | 168 (63.6) | 96 (36.4) | 320 (82.1) | 98 (30.6) | 222 (69.4) | 3.96 (2.8 - 5.6) | < 0.0001* |
Low | 144 (35.3) | 120 (83.3) | 24 (16.7) | 70 (17.9) | 20 (28.6) | 50 (71.4) | 12.5 (6.3 - 24.6) | < 0.0001* |
HOMA-IR | ||||||||
Insulin sensitive | 360 (88.2) | 240 (66.7) | 120 (33.3) | 110 (28.2) | 34 (30.9) | 76 (69.1) | 4.4 (2.8 - 7.0) | < 0.0001* |
Low IR | 48 (11.8) | 48 (100) | 0 (0.0) | 72 (18.5) | 18 (25.0) | 54 (75.0) | - | < 0.0001* |
Significant IR | 0 (0.0) | 0 (0.0) | 0 (0.0) | 208 (53.3) | 66 (31.7) | 142 (68.3) | - | < 0.0001* |
Leptin levels | ||||||||
Normal | 360 (88.2) | 264 (73.3) | 96 (26.7) | 164 (42.1) | 38 (23.2) | 126 (76.8) | 9.1 (5.9 - 14.0) | < 0.0001* |
Elevated | 48 (11.8) | 24 (50.0) | 24 (50.0) | 226 (57.9) | 80 (35.4) | 146 (64.6) | 1.8 (0.97 - 3.4) | 0.072 |
Socio-demographic/clinicopathological parameters | LEPR A668G genotypes in controls | LEPR A668G genotypes in T2DM cases | OR (95% CI) | P value | ||||
---|---|---|---|---|---|---|---|---|
n = 408 (%) | AA, 312 (46.6) | AG + GG, 96 (53.3) | n = 390 (%) | AA, 120 (30.7) | AG + GG, 270 (69.3) | 7.3 (5.3 - 10.0) | < 0.0001* | |
*Statistically significant. T2DM: type 2 diabetes mellitus; OR: odds ratio; CI: confidence interval; BMI: body mass index (< 18.5 = underweight, 18.5 - 24.99 = normal, 25 - 29.99 = preobese, 30 - 34.99 = obese class I, 35 - 39.99 = obese class II); TG: triglycerides; LDL-C: low-density lipoprotein cholesterol; HDL-C: high-density lipoprotein cholesterol; HbA1c: glycosylated hemoglobin; HOMA-IR: homeostatic model assessment-insulin resistance. | ||||||||
Age group | ||||||||
< 50 years | 216 (52.9) | 192 (88.9) | 24 (11.1) | 206 (52.8) | 64 (31.1) | 142 (98.9) | 17.7 (10.5 - 29.7) | < 0.0001* |
≥ 50 years | 192 (47.1) | 120 (62.5) | 72 (37.5) | 184 (47.1) | 56 (30.4) | 128 (69.6) | 3.8 (2.4 - 5.8) | < 0.0001* |
Gender | ||||||||
Male | 168 (41.2) | 96 (57.1) | 72 (42.9) | 166 (42.5) | 54 (32.5) | 112 (67.5) | 2.7 (17 - 4.3) | < 0.0001* |
Female | 240 (58.8) | 216 (90.0) | 24 (10.0) | 224 (57.4) | 66 (29.5) | 158 (70.5) | 21.5 (12.9 - 35.8) | < 0.0001* |
Dwelling | ||||||||
Rural | 144 (35.3) | 144 (100) | 0 (0.0) | 178 (45.6) | 60 (33.7) | 118 (66.3) | - | < 0.0001* |
Urban | 264 (64.7) | 168 (63.6) | 96 (36.4) | 212 (54.3) | 60 (28.3) | 152 (71.7) | 4.43 (3.0 - 6.5) | < 0.0001* |
Family history | ||||||||
No | 216 (52.9) | 192 (88.9) | 24 (11.1) | 134 (34.3) | 40 (29.9) | 94 (70.1) | 18.8 (10.7 - 33) | < 0.0001* |
Yes | 192 (47.1) | 120 (62.5) | 72 (37.5) | 256 (65.6) | 80 (31.3) | 176 (68.8) | 3.6 (2.4 - 5.4) | < 0.0001* |
BMI (kg/m2) | ||||||||
Normal | 120 (29.4) | 120 (100) | 0 (0.0) | 118 (30.3) | 44 (37.3) | 74 (62.7) | - | < 0.0001* |
Underweight | 24 (5.9) | 24 (100) | 0 (0.0) | 14 (3.6) | 4 (28.6) | 10 (71.4) | - | < 0.0001* |
Preobese | 120 (29.4) | 72 (60.0) | 48 (40.0) | 148 (37.9) | 40 (27.0) | 108 (73.0) | 4.0 (2.4 - 6.7) | < 0.0001* |
Obese class I | 120 (29.4) | 96 (80.0) | 24 (20.0) | 78 (20.0) | 22 (28.2) | 56 (71.8) | 10.1 (5.2 - 19.8) | < 0.0001* |
Obese class II | 24 (5.9) | 0 (0.0) | 24 (100) | 32 (8.2) | 10 (31.3) | 22 (68.8) | - | 0.002* |
Hypertension | ||||||||
No | 264 (64.7) | 216 (81.8) | 48 (18.2) | 188 (48.2) | 70 (37.2) | 118 (62.8) | 7.5 (4.9 - 11.6) | < 0.0001* |
Yes | 144 (35.3) | 96 (66.7) | 48 (33.3) | 202 (51.8) | 50 (24.8) | 152 (75.2) | 6.0 (3.7 - 9.7) | < 0.0001* |
Total cholesterol | ||||||||
Normal | 264 (64.7) | 216 (81.8) | 48 (18.2) | 312 (80.0) | 94 (30.1) | 218 (69.9) | 10.4 (7.0 - 15.4) | < 0.0001* |
Elevated | 144 (35.3) | 96 (66.7) | 48 (33.3) | 78 (20.0) | 26 (33.3) | 52 (66.7) | 4.0 (2.2 - 7.1) | < 0.0001* |
TG | ||||||||
Normal | 216 (52.9) | 192 (88.9) | 24 (11.1) | 216 (55.4) | 64 (29.6) | 152 (70.4) | 19.0 (11.3 - 31.8) | < 0.0001* |
Elevated | 192 (47.1) | 120 (62.5) | 72 (37.5) | 174 (44.6) | 56 (32.2) | 118 (67.8) | 3.5 (2.2 - 5.4) | < 0.0001* |
LDL-C | ||||||||
Normal | 312 (76.5) | 264 (84.6) | 48 (15.4) | 330 (84.6) | 100 (30.3) | 230 (69.7) | 12.6 (8.5 - 18.6) | < 0.0001* |
Elevated | 96 (23.5) | 48 (50.0) | 48 (50.0) | 60 (15.4) | 20 (33.3) | 40 (66.7) | 2.0 (1.0 - 3.9) | 0.047* |
HDL-C | ||||||||
Normal | 192 (47.0) | 168 (87.5) | 24 (12.5) | 190 (48.7) | 58 (30.5) | 132 (69.5) | 15.9 (9.4 - 26.9) | < 0.0001* |
Low | 216 (53.0) | 144 (66.7) | 72 (33.3) | 200 (51.3) | 62 (31.0) | 138 (69.0) | 2.8 (2.2 - 3.5) | < 0.0001* |
HbA1c | ||||||||
Normal | 384 (94.1) | 288 (75.0) | 96 (25.0) | 84 (21.5) | 26 (31.0) | 58 (69.0) | 6.6 (3.9 - 11.2) | < 0.0001* |
High glycemic control | 24 (5.9) | 24 (100) | 0 (0.0) | 238 (61.0) | 72 (30.3) | 166 (63.4) | - | < 0.0001* |
Low glycemic control | 0 (0.0) | 0 (0.0) | 0 (0.0) | 68 (17.4) | 22 (32.4) | 46 (67.6) | - | < 0.0001* |
Insulin levels | ||||||||
Normal | 264 (64.7) | 192 (72.7) | 72 (27.3) | 320 (82.1) | 96 (30.0) | 224 (70.0) | 6.2 (4.3 - 8.9) | < 0.0001* |
Low | 144 (35.3) | 120 (83.3) | 24 (16.7) | 70 (17.9) | 24 (34.3) | 46 (65.7) | 9.5 (4.9 - 18.5) | < 0.0001* |
HOMA-IR | ||||||||
Insulin sensitive | 360 (88.2) | 288 (80.0) | 72 (20.0) | 110 (28.2) | 34 (30.9) | 76 (69.1) | 8.9 (5.5 - 14.4) | < 0.0001* |
Low IR | 48 (11.8) | 24 (50.0) | 24 (50.0) | 72 (18.5) | 22 (30.6) | 50 (69.4) | 2.2 (1.0 - 4.8) | 0.037* |
Significant IR | 0 (0.0) | 0 (0.0) | 0 (0.0) | 208 (53.3) | 64 (30.8) | 114 (69.2) | - | < 0.0001* |
Leptin levels | ||||||||
Normal | 360 (88.2) | 288 (80) | 72 (20.0) | 164 (42.1) | 62 (37.8) | 102 (62.2) | 6.5 (4.3 - 9.8) | < 0.0001* |
Elevated | 48 (11.8) | 24 (50.0) | 24 (50.0) | 226 (57.9) | 58 (25.7) | 168 (74.3) | 2.8 (1.5 - 5.4) | 0.02* |