

| Journal of Endocrinology and Metabolism, ISSN 1923-2861 print, 1923-287X online, Open Access |
| Article copyright, the authors; Journal compilation copyright, J Endocrinol Metab and Elmer Press Inc |
| Journal website http://www.jofem.org |
Original Article
Volume 9, Number 6, December 2019, pages 186-192
Increased Ratio of Total Testosterone to Dihydrotestosterone May Predict an Adverse Metabolic Outcome in Polycystic Ovary Syndrome
Sukanti Shaha, Hurjahan Banua, Tania Sultanab, Nazma Akhtarc, Afroza Begumd, Begum Moriom Zamilaa, Md Fariduddina, Muhammad Abul Hasanata, e
aDepartment of Endocrinology, Bangabandhu Sheikh Mujib Medical University (BSMMU), Shahbag, Dhaka, Bangladesh
bDhaka Dental College Hospital, Dhaka, Bangladesh
cDepartment of Medicine, Shaheed Tajuddin Ahmed Medical College, Gazipur, Bangladesh
dDepartment of Endocrinology, Dhaka Medical College Hospital, Dhaka, Bangladesh
eCorresponding Author: Muhammad Abul Hasanat, Department of Endocrinology, Bangabandhu Sheikh Mujib Medical University (BSMMU), Dhaka, Bangladesh
Manuscript submitted August 17, 2019, accepted October 14, 2019
Short title: Increased TT/DHT Ratio in PCOS
doi: https://doi.org/10.14740/jem601
| Abstract | ▴Top |
Background: Androgen excess may correlate with metabolic risk in polycystic ovary syndrome (PCOS). The aim of the study was to determine the role of total testosterone to dihydrotestosterone (TT/DHT) ratio in assessing the adverse metabolic outcome in PCOS.
Methods: This cross-sectional study encompassed 40 PCOS women recruited on the basis of revised Rotterdam criteria 2003, and 40 age-matched control subjects. TT, sex hormone binding globulin (SHBG) and insulin levels were measured by chemiluminescent microparticle immunoassay (CMIA) while DHT by enzyme-linked immunosorbent assay (ELISA). In addition, TT/DHT ratio, free androgen index (FAI), and insulin resistance (IR) by homeostatic model of assessment of insulin resistance (HOMA-IR) were calculated.
Results: TT/DHT ratio was significantly higher in PCOS group than control group (P < 0.001). No significant difference was found for DHT (P = 0.261). PCOS patients had significantly higher TT (0.69 ± 0.26 vs. 0.30 ± 0.13 ng/mL; P < 0.001), FAI (P < 0.001) and low SHBG (P = 0.004) compared to controls. TT/DHT ratio was significantly higher in PCOS with impaired glucose tolerance (IGT) (P = 0.037) and metabolic syndrome (MetS) (P = 0.041). The best cutoff value for TT/DHT ratio to diagnose PCOS was observed to be 2.38 (sensitivity: 70%, specificity: 32.5% and area under the curve (AUC): 0.753). TT/DHT ratio also showed positive correlation with weight (r = 0.323, P = 0.042), waist circumference (WC) (r = 0.372, P = 0.018), HOMA-IR (r = 0.385, P = 0.014), 2-h post 75-g glucose (2h-PG), (r = 0.413, P = 0.008) and triglyceride (TG) level (r = 0.402, P = 0.010) in PCOS.
Conclusions: There is a close relation between the TT/DHT ratio and adverse metabolic outcome in PCOS. Therefore, TT/DHT ratio may be considered as a predictor of adverse metabolic findings in PCOS.
Keywords: PCOS; TT/DHT ratio; IGT; Metabolic syndrome; Insulin resistance; Obesity
| Introduction | ▴Top |
Based on the clinical picture and laboratory findings, three main phenotypes of polycystic ovary syndrome (PCOS) can be defined: metabolic, hyperandrogenic and reproductive [1]. Prevalence of PCOS varies from 6-18% depending on the diagnostic criteria used [2]. The etiology of PCOS is still far from clear. PCOS is not the consequence of a single gene defect, but rather the result of a polygenic interaction together with environmental factors [3]. It appears that insulin resistance (IR) and hyperinsulinemia play a permissive role. Hyperinsulinemia stimulates both ovarian (mainly) and adrenal androgen secretion and suppresses sex hormone binding globulin (SHBG) synthesis from the liver, thereby resulting in increase in free, biologically active androgens [4, 5]. In addition to hyperandrogenemia, women with PCOS may present with typical metabolic abnormalities such as IR and obesity at a young age. Long-term exposure to these abnormalities throughout fertile life may exacerbate the adverse effects and expose these women to higher risks of metabolic syndrome (MetS), cardiovascular diseases (CVDs) and type 2 diabetes mellitus (T2DM) [6-8].
There are several hypotheses for the association of hyperandrogenism (HA) with poor metabolic profile. PCOS women with androgen excess are at a higher risk of IR, liver disease, and subclinical atherosclerosis compared to PCOS patients with normal androgen level [9]. There is a lack of clarity on which androgen to be measured and how often should they be measured to determine the metabolic risk factors [10]. The metabolic complications in PCOS should not be quantified on single hormone measurement, but should comprise the quantification of other steroid hormones and a further analysis of the relationship of these hormones to each other. At present, testosterone is the most common measurement in routine clinical practice [11]. Increased peripheral conversion of testosterone to the potent androgen (dihydrotestosterone (DHT)) by 5α-reductase activity has been linked to an adverse metabolic profile in PCOS [12]. It is estimated that more than 60% DHT in women is produced from the skin and originates from androstenedione. Recent studies have shown that a high total testosterone to dihydrotestosterone (TT/DHT) ratio was useful to see an adverse metabolic profile not only in PCOS patients but also useful to predict development of PCOS in “theoretically healthy” obese women [13, 14].
The present study was undertaken to analyze whether the TT/DHT ratio may be helpful in predicting metabolic risk in PCOS women.
| Materials and Methods | ▴Top |
Subjects
This study was conducted in the Department of Endocrinology, Bangabandhu Sheikh Mujib Medical University (BSMMU), Dhaka. Sample size was estimated according to a previous study [15]. Forty Bangladeshi women aged 16 - 35 years with PCOS diagnosed on the basis of revised Rotterdam consensus 2003 criteria [1, 14] were recruited. Control group included 40 age-matched healthy women having regular menstrual cycle, no history of clinical and biochemical HA, no polycystic ovary morphology on ultrasonography (USG) and without clinical evidence of any endocrine diseases. Patients were not included if they had: primary amenorrhea, hyperprolactinemia (serum prolactin values greater than 25 ng/mL), hypothyroidism (serum thyroid stimulating hormone (TSH) greater than 5 µIU/mL) and non-classical congenital adrenal hyperplasia (CAH) diagnosed in case of basal or adrenocorticotropic hormone (ACTH) stimulated 17-OH progesterone greater than 10 ng/mL [16].Women on medication for < 6 months prior to the study (including oral contraceptives, glucocorticoids, metformin, ovulation induction agents, and estrogenic or anti-androgenic drugs or any medication for dyslipidemia or anti-obesity drugs) or suffering from other systemic diseases (e.g. chronic kidney disease, liver diseases etc.) were also excluded from the study. Prior to commencement, the research protocol was approved by the Institutional Review Board (IRB). Informed written consent was taken from all subjects.
Protocol
Anthropometric measurements were taken by the same investigator and hirsutism was assessed using a modified Ferriman-Gallwey (FG) score [17]. For TT, SHBG, DHT, follicle-stimulating hormone (FSH), luteinising hormone (LH), TSH and prolactin, samples were collected on any day between the second and the seventh day of a spontaneous bleeding episode or randomly in the case of amenorrhea. Samples for fasting plasma glucose (FPG) and 2-h post 75-g glucose (2h-PG) as well as fasting insulin (FI) and lipid profile were taken. For serum levels of DHT and SHBG, blood was centrifuged; about 1 mL of serum was separated in an Eppendorf tube and stored at a temperature of -20 °C. Oligomenorrhea was defined as delayed menses > 35 days or < 8 spontaneous hemorrhagic episodes/year, clinical HA (hirsutism using modified FG-score of > 8) or biochemical HA (TT ≥ 53 ng/dL) [18], polycystic ovarian morphology on ultrasonography (USG) (12 or more follicles in each ovary measuring 2 - 9 mm in diameter, and/or increased ovarian volume > 10 cm3).
Analytic methods and calculated values
The circulating levels of TT, FSH, LH, TSH, and prolactin levels were measured by CMIA in the Department of Microbiology and Immunology. DHT samples were run by enzyme-linked immunosorbent assay (ELISA) and SHBG by Beckman Coulter at once in the Department of Microbiology and Immunology. Transabdominal (in unmarried) or transvaginal USG was performed preferably in early follicular phase. FPG was analyzed by glucose oxidase method whereas FI by CMIA, Architect plus ci4100 and lipid profile was assessed by automated analyzer, Architect Plus ci8200. TT/DHT ratio was calculated by dividing TT by DHT (ng/mL) and free androgen index (FAI) was calculated as TT/SHBG × 100 (nmol/L), a cutoff value of ≥ 5 was used to define HA [19]. To define IR, homeostatic model of assessment of insulin resistance (HOMA-IR) with a cutoff of ≥ 2.6 was used as evidenced by a previous study in Bangladeshi population [20]. HOMA-IR was calculated using the formula: HOMA-IR = FPG (mmol/L) × FI (µIU/mL)/22.5 [21]. MetS was defined following the definition provided by the revised Rotterdam consensus 2003 criteria [1]. Prediabetes was defined as follows: impaired fasting glucose (IFG) when FPG was between 5.6 - 6.9 mmol/L and impaired glucose tolerance (IGT) when the 2h-PG value during a 75 g oral glucose tolerance test (OGTT) was between 7.8 - 11.0 mmol/L. Diabetes mellitus (DM) was confirmed by FPG ≥ 7.0 mmol/L, a 2h-PG value during a 75 g OGTT of ≥ 11.1 mmol/L [22]. Obesity was defined as per the Western Pacific Region Office of World Health Organization [23], where body mass index (BMI) of 23 - 24.9 kg/m2 was considered overweight and BMI ≥ 25 kg/m2 as obese.
Statistical analysis
All data were expressed either as frequency or mean ± standard deviation (SD) as applicable, Student’s independent t-test and Chi-square tests were used to compare variables between the two groups. When more than 20% of the expected counts were less than 5, Fisher’s exact test was applied. Receiver operating characteristics (ROC) curve was constructed to determine the optimal cutoff point of TT/DHT ratio to diagnose PCOS and adverse metabolic parameters. Pearson’s correlation was done to see the correlation of TT/DHT ratio with clinical and biochemical parameters in PCOS and control. P value of ≤ 0.05 was considered to be statistically significant.
| Results | ▴Top |
Clinical and metabolic profile
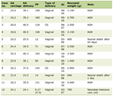
PCOS women (n = 40, age (mean ± SD): 23.18 ± 4.66 years) were compared with 40 age-matched healthy control subjects (age: 23.00 ± 4.32 years). Comparison of the clinical and metabolic parameters among the PCOS and control groups are shown in Table 1. BMI was statistically and significantly higher in PCOS women (26.14 ± 4.16 vs. 20.84 ± 3.48 kg/m2, P < 0.001) than control. PCOS group revealed higher level of waist circumference (WC) (84.05 ± 10.85 vs. 71.15 ± 5.82 cm; P < 0.001), hip circumference (HC) (100.98 ± 10.17 vs. 88.38 ± 7.40 cm; P < 0.001), waist hip ratio (WHR) (0.83 ± 0.06 vs. 0.80 ± 0.04; P = 0.046), FI (23.01 ± 21.57 vs. 8.54 ± 3.80 µU/mL; P < 0.001), FPG (4.50 ± 0.67 vs. 3.67 ± 0.40 mmol/L; P < 0.001), 2h-PG (7.40 ± 1.95 vs. 6.10 ± 1.23 mmol/L; P < 0.001), HOMA-IR (4.44 ± 3.70 vs. 1.40 ± 0.70; P < 0.001), triglyceride (TG) (134.90 ± 76.30 vs. 91.88 ± 28.87 mg/dL; P = 0.002) and high-density lipoprotein cholesterol (HDL-C) (37.39 ± 7.24 vs. 49.65 ± 9.54 mg/dL; P < 0.001).
 Click to view | Table 1. Clinical and Metabolic Characteristics of Studied Subjects |
Androgenic profile
Table 2 depicts the hormone levels between the two groups. TT (0.69 ± 0.26 vs. 0.30 ± 0.13 ng/mL; P < 0.001), TT/DHT ratio (3.51 ± 1.95 vs. 2.02 ± 1.03; P < 0.001) and FAI (10.93 ± 8.52 vs. 2.93 ± 2.17; P < 0.001) were significantly higher in PCOS than those of control whereas DHT level (0.252 ± 0.180 vs. 0.207 ± 0.180 ng/mL; P = 0.261) did not show any significant difference. Serum level of SHBG (32.16 ± 21.33 vs. 47.66 ± 24.70 nmol/L; P = 0.004) was significantly low in PCOS.
Click to view | Table 2. Hormone Profile of PCOS and Control Groups |
Glycemic status
Table 3 illustrates that 32.5% of PCOS patients had prediabetes (32.5% vs. 5%; P = 0.002) and 5% had DM; 65% had IR (65% vs. 7.5%; P < 0.001) and 42.5% had MetS (42.5% vs. 5%; P < 0.001).
Click to view | Table 3. Glycemic Status and Insulin Resistance in PCOS and Control Groups |
Comparison of TT/DHT ratio with metabolic profiles
Table 4 shows the level of TT/DHT ratio in PCOS and control subjects comparing the presence or absence of adverse metabolic parameters within the PCOS group and in PCOS and control. TT/DHT ratio was raised in PCOS patients with MetS (with MetS: 4.33 ± 2.54 vs. without MetS: 2.90 ± 1.06; P = 0.041) and in those who had IGT (with IGT: 4.73 ± 2.73 vs. without IGT: 2.92 ± 1.08; P = 0.037) but not in control group. However, the ratio was not raised in patients with IR and obesity neither among the PCOS nor in control group. In addition to the above findings, when comparison was done within PCOS and control group for obesity, TT/DHT ratio was found to be significantly higher in PCOS (PCOS: 3.71 ± 2.16 vs. control: 2.10 ± 1.09; P = 0.032). Comparison between PCOS and control for MetS, IGT and IR could not be done due to very few numbers of controls.
Click to view | Table 4. Level of TT/DHT Ratio in PCOS and Control Groups With Metabolic Parameters |
ROC curve analysis for diagnosis of PCOS and adverse metabolic profile by TT/DHT ratio
Figure 1 showing the ROC curve analyses revealed that the best cutoff value for the TT/DHT ratio to diagnose PCOS was 2.38 (sensitivity: 70%, specificity: 32.5%, and AUC: 0.753). In PCOS patients, the cutoff value for the TT/DHT ratio for MetS calculated via ROC curve analyses was 2.53 (sensitivity: 73.7%, specificity: 39.3%, and AUC: 0.738) and for IGT 2.78 (sensitivity: 61.5%, specificity: 38.5%, and AUC: 0.653). Figure 2 showed when a TT/DHT ratio of ≥ 2.38 was used as a cutoff value of TT/DHT ratio to diagnose PCOS, 70% of PCOS and 32.5% of control subjects had a high ratio (P = 0.001).
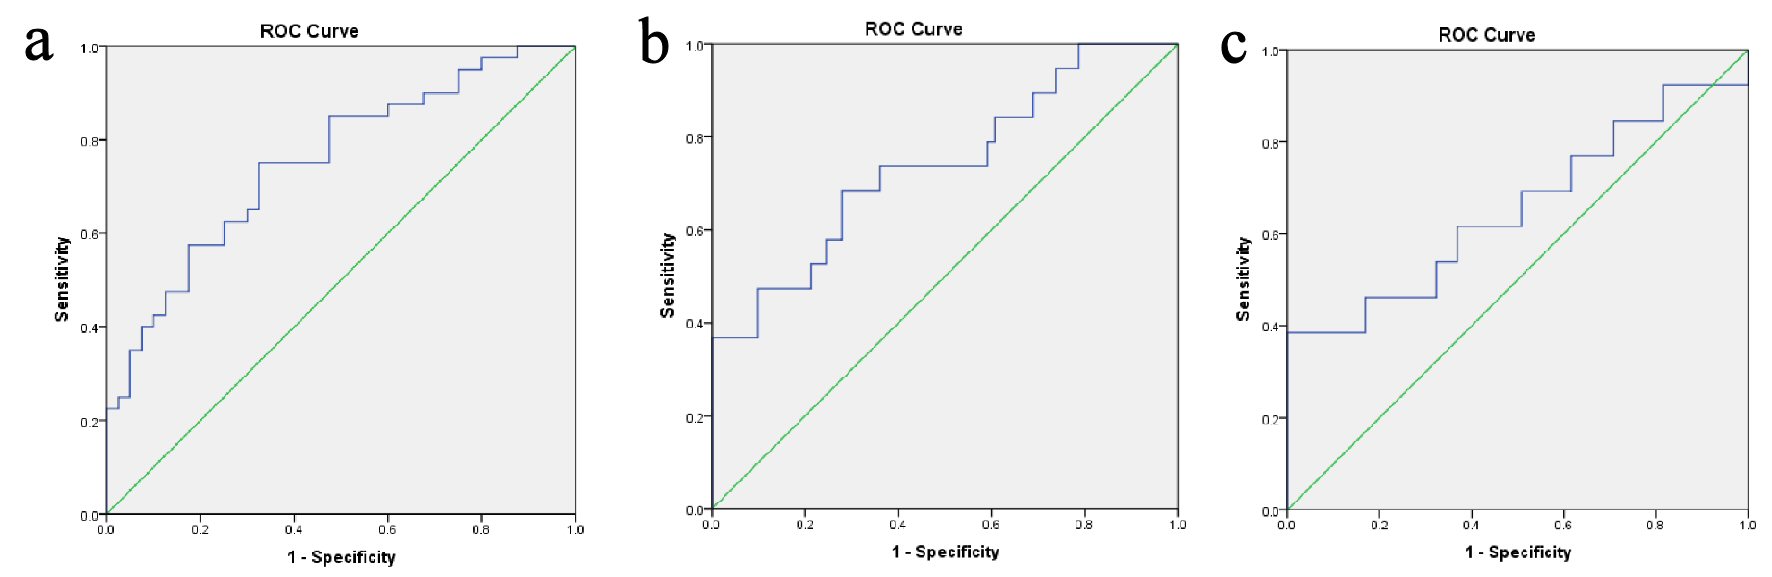 Click for large image | Figure 1. (a) ROC curves analyses revealed the best cutoff value of TT/DHT ratio of 2.38 for the diagnosis of PCOS (sensitivity: 70%, specificity: 32.5%, and AUC: 0.753). In PCOS patients, ROC curves analyses were conducted for best cutoff values of TT/DHT ratio for the diagnosis of (b) metabolic syndrome (2.53, sensitivity: 73.7%, specificity: 39.3%, and AUC: 0.738) and (c) impaired glucose tolerance (2.78, sensitivity: 61.5%, specificity: 38.5%, and AUC: 0.653). PCOS: polycystic ovary syndrome; AUC: area under the curve; ROC: receiver operating characteristics; TT/DHT: total testosterone/dihydrotestosterone ratio. |
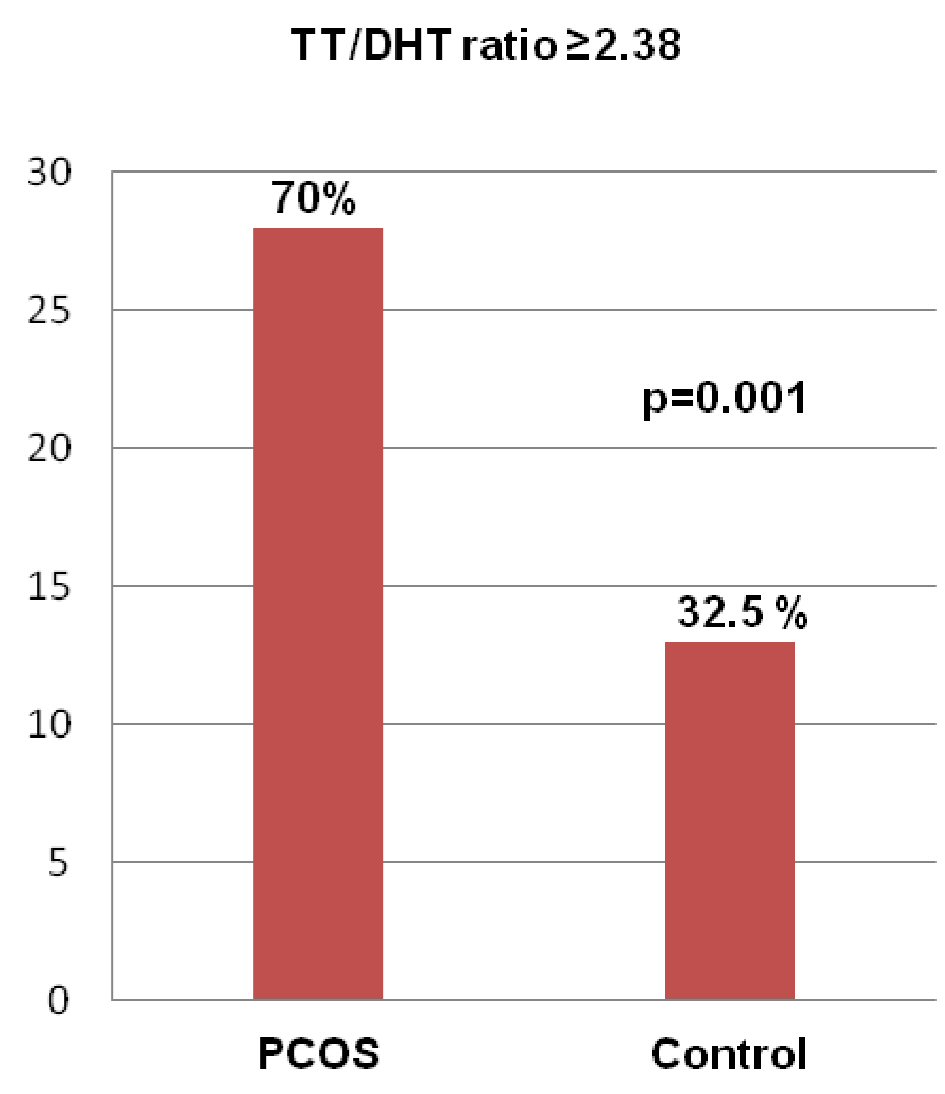 Click for large image | Figure 2. Frequency of a raised TT/DHT ratio (≥ 2.38) in the PCOS and control groups. (Data were expressed as frequency and percentage; comparison between PCOS and control groups was done by Chi-square test. PCOS: polycystic ovary syndrome; TT/DHT ratio: total testosterone/dihydrotestosterone ratio. |
Correlations
Table 5 showing the Pearson’s correlation analysis in PCOS patients depicted that the TT/DHT ratio significantly correlated with weight (r = 0.323, P = 0.042), WC (r = 0.372, P = 0.018), 2h-PG (r = 0.413, P = 0.008), HOMA-IR (r = 0.385, P = 0.014) and TG (r = 0.402, P = 0.010) but none in the control group (P = non significant (NS) for all).
Click to view | Table 5. Correlations of TT/DHT Ratio With Clinical and Biochemical Parameters in PCOS and Control Groups |
| Discussion | ▴Top |
PCOS is a heterogeneous disease with several metabolic characteristics, clinical phenotypes and HA as a key factor. The present study observed that the TT/DHT ratio was higher in PCOS women with adverse metabolic parameters, and a higher TT/DHT ratio was observed within PCOS patients who had MetS and IGT; similar observations were made in recent studies [13, 14, 24]. These findings were also supported by significant correlations with parameters of glucose intolerance (i.e. higher level of FPG, 2h-PG and HOMA-IR) and other adverse metabolic factors, like weight, WC and TG level in PCOS group. The ROC curve analysis predicted the nearest cutoff value of TT/DHT ratio to diagnose PCOS was 2.38; Munzker et al (2015) revealed ROC curve value of 4.37 as the cutoff value [13]. The lower cutoff value found in the present study may be explained by the use of CMIA and ELISA rather than mass spectrometry for hormonal analysis. However, ROC curve value is more appropriate than arbitrary cutoff values of other investigators in international studies for our studied population. Subsequently, a number of studies have been conducted in order to identify potential predictors of the metabolic risk in PCOS patients. Investigators have also observed that a worse metabolic profile in PCOS patients was associated with higher testosterone concentrations [25]; and among the obese women not meeting PCOS criteria, those with hyperandrogenemia have a worse metabolic phenotype [26].
In addition to the above findings, when comparing the PCOS and control group, it was observed that PCOS women with obesity had a higher ratio than those of control with obesity. However, MetS, IGT and IR could not be compared between the two groups because the numbers in these variables were not mutually exclusive in the control group.
When TT/DHT ratio cutoff of ≥ 2.38 was used to diagnose PCOS, it was interestingly observed that 32.5% of control women also had a high ratio. These observations of high ratio may also be associated with adverse metabolic profile not only in PCOS but also in control women with metabolic derangements; Ambroziak et al (2017) also made similar observations [14]. Metabolic disturbances observed in patients with PCOS result from the unfavorable influence of androgens on glucose and lipid metabolism as well as on insulin action. In turn, hyperinsulinemia stimulates androgens synthesis in ovaries, continuing the vicious cycle [27]. The findings of the present study focused on the importance of measuring androgen concentrations in order to look for relation between androgen levels and poor metabolic constellations.
In the present study, serum TT and DHT could not be assessed by standard liquid chromatography and tandem mass spectrometry method. In addition, for assessing IR we used surrogate marker instead of gold standard hyperinsulinemic euglycemic clamp method. The strength of the study is the inclusion of an age-matched equal number of control group, and PCOS subjects were not preselected to have biochemical HA or any other specific characteristics. However, due to the relatively small size of the investigated groups, further studies and larger trials are needed to verify our results.
Conclusions
The present study demonstrated that the TT/DHT ratio may be important as a predictor for adverse metabolic outcome in PCOS women. This component may be considered for the assessment of metabolic abnormalities in PCOS.
Acknowledgments
We thank the Institutional Review Board as well as Department of Endocrinology of BSMMU for moral support and acknowledge the grant of UniMed UniHealth Pharmaceuticals Mfg. Ltd. Technical support by the Microbiology, Radiology and Biochemistry Departments of BSMMU are also duly acknowledged.
Financial Disclosure
We obtained a grant from UniMed UniHealth Pharmaceuticals Mfg. Ltd of Bangladesh.
Conflict of Interest
The authors declare that they have no conflict of interest concerning this article.
Informed Consent
All patients had informed written consent prior to participation in the study.
Author Contributions
MA Hasanat, Hurjahan Banu, Sukanti Shah and Nazma Akhtar designed the research; Sukanti Shah, Begum Moriom Zamila and Afroza Begum collected the data; Sukanti Shah and Tania Sultana did the statistical analysis; Hurjahan Banu and Sukanti Shah prepared the manuscript. MA Hasanat supervised and coordinated the study. Md Fariduddin went through the manuscript and provided moral support. All authors read and approved the final paper.
| References | ▴Top |
- Rotterdam EA-SPCWG. Revised 2003 consensus on diagnostic criteria and long-term health risks related to polycystic ovary syndrome. Fertil Steril. 2004;81(1):19-25.
doi pubmed - March WA, Moore VM, Willson KJ, Phillips DI, Norman RJ, Davies MJ. The prevalence of polycystic ovary syndrome in a community sample assessed under contrasting diagnostic criteria. Hum Reprod. 2010;25(2):544-551.
doi pubmed - Urbanek M. The genetics of the polycystic ovary syndrome. Nat Clin Pract Endocrinol Metab. 2007;3(2):103-111.
doi pubmed - Carmina E, Lobo RA. Use of fasting blood to assess the prevalence of insulin resistance in women with polycystic ovary syndrome. Fertil Steril. 2004;82(3):661-665.
doi pubmed - DeUgarte CM, Bartolucci AA, Azziz R. Prevalence of insulin resistance in the polycystic ovary syndrome using the homeostasis model assessment. Fertil Steril. 2005;83(5):1454-1460.
doi pubmed - Glintborg D, Mumm H, Ravn P, Andersen M. Age associated differences in prevalence of individual rotterdam criteria and metabolic risk factors during reproductive age in 446 caucasian women with polycystic ovary syndrome. Horm Metab Res. 2012;44(9):694-698.
doi pubmed - Johnstone EB, Davis G, Zane LT, Cedars MI, Huddleston HG. Age-related differences in the reproductive and metabolic implications of polycystic ovarian syndrome: findings in an obese, United States population. Gynecol Endocrinol. 2012;28(10):819-822.
doi pubmed - Puurunen J, Piltonen T, Morin-Papunen L, Perheentupa A, Jarvela I, Ruokonen A, Tapanainen JS. Unfavorable hormonal, metabolic, and inflammatory alterations persist after menopause in women with PCOS. J Clin Endocrinol Metab. 2011;96(6):1827-1834.
doi pubmed - Jones H, Sprung VS, Pugh CJ, Daousi C, Irwin A, Aziz N, Adams VL, et al. Polycystic ovary syndrome with hyperandrogenism is characterized by an increased risk of hepatic steatosis compared to nonhyperandrogenic PCOS phenotypes and healthy controls, independent of obesity and insulin resistance. J Clin Endocrinol Metab. 2012;97(10):3709-3716.
doi pubmed - Barth JH. How robust is the methodology for trials of therapy in hirsute women? Clin Endocrinol (Oxf). 1996;45(4):379-380.
doi pubmed - Azziz R, Woods KS, Reyna R, Key TJ, Knochenhauer ES, Yildiz BO. The prevalence and features of the polycystic ovary syndrome in an unselected population. J Clin Endocrinol Metab. 2004;89(6):2745-2749.
doi pubmed - O'Reilly MW, Taylor AE, Crabtree NJ, Hughes BA, Capper F, Crowley RK, Stewart PM, et al. Hyperandrogenemia predicts metabolic phenotype in polycystic ovary syndrome: the utility of serum androstenedione. J Clin Endocrinol Metab. 2014;99(3):1027-1036.
doi pubmed - Munzker J, Hofer D, Trummer C, Ulbing M, Harger A, Pieber T, Owen L, et al. Testosterone to dihydrotestosterone ratio as a new biomarker for an adverse metabolic phenotype in the polycystic ovary syndrome. J Clin Endocrinol Metab. 2015;100(2):653-660.
doi pubmed - Ambroziak U, Kurylowicz A, Kepczynska-Nyk A, Bartoszewicz Z, Kondracka A, Jazwiec R, Samborowska E, et al. Total testosterone to dihydrotestosterone ratio assessed by LC-MS/MS predicts a worse metabolic profile not only in PCOS patients. Ginekol Pol. 2017;88(1):5-8.
doi pubmed - Hurjahan-Banu, Hasanat MA, Nazma-Akhtar Sukanti-Shah, Tania-Sultana Sadiqa-Tuqan, Md Fariduddin, et al. Prostate specific antigen is raised in polycystic ovary syndrome. Endocrinology & Metabolism International Journal. 2018;6(4):297-300.
doi - Moran C, Tena G, Moran S, Ruiz P, Reyna R, Duque X. Prevalence of polycystic ovary syndrome and related disorders in mexican women. Gynecol Obstet Invest. 2010;69(4):274-280.
doi pubmed - Ferriman D, Gallwey JD. Clinical assessment of body hair growth in women. J Clin Endocrinol Metab. 1961;21:1440-1447.
doi pubmed - Rosner W, Auchus RJ, Azziz R, Sluss PM, Raff H. Position statement: Utility, limitations, and pitfalls in measuring testosterone: an Endocrine Society position statement. J Clin Endocrinol Metab. 2007;92(2):405-413.
doi pubmed - Al Kindi MK, Al Essry FS, Al Essry FS, Mula-Abed WA. Validity of serum testosterone, free androgen index, and calculated free testosterone in women with suspected hyperandrogenism. Oman Med J. 2012;27(6):471-474.
doi pubmed - Bhowmik B, Siddiquee T, Mujumder A, Rajib MMR, Das CK, Khan MI, Khan AKA, et al. Identifying insulin resistance by fasting blood samples in Bangladeshi population with normal blood glucose. Journal of Diabetology; Official Journal of Diabetes in Asia Study Group. 2016;7(3):4.
- Matthews DR, Hosker JP, Rudenski AS, Naylor BA, Treacher DF, Turner RC. Homeostasis model assessment: insulin resistance and beta-cell function from fasting plasma glucose and insulin concentrations in man. Diabetologia. 1985;28(7):412-419.
doi pubmed - American Diabetes Association. Standards of medical care in diabetes-2017. Diabetes Care. 2017;40:18-19.
- World Health Organization. The Asia-Pacific perspective: redefining obesity and its treatment. 2000.
- Wang-Qing Feng, Yan-jie Zhang, Xian-ru Lei Xia. Clinical and diagnostic significance of testosterone to dihydrotestosterone ratio in patients with polycystic ovary syndrome complicated with obesity. Modern Medical Journal. 2016. [abstract].
- Moran L, Teede H. Metabolic features of the reproductive phenotypes of polycystic ovary syndrome. Hum Reprod Update. 2009;15(4):477-488.
doi pubmed - Valderhaug TG, Hertel JK, Nordstrand N, Dale PO, Hofso D, Hjelmesaeth J. The association between hyperandrogenemia and the metabolic syndrome in morbidly obese women. Diabetol Metab Syndr. 2015;7:46.
doi pubmed - Shroff R, Syrop CH, Davis W, Van Voorhis BJ, Dokras A. Risk of metabolic complications in the new PCOS phenotypes based on the Rotterdam criteria. Fertil Steril. 2007;88(5):1389-1395.
doi pubmed
This article is distributed under the terms of the Creative Commons Attribution Non-Commercial 4.0 International License, which permits unrestricted non-commercial use, distribution, and reproduction in any medium, provided the original work is properly cited.
Journal of Endocrinology and Metabolism is published by Elmer Press Inc.