| Journal of Endocrinology and Metabolism, ISSN 1923-2861 print, 1923-287X online, Open Access |
| Article copyright, the authors; Journal compilation copyright, J Endocrinol Metab and Elmer Press Inc |
| Journal website http://www.jofem.org |
Original Article
Volume 4, Number 5-6, December 2014, pages 136-142
Significant Differences in Effects of Sitagliptin Treatment on Body Weight and Lipid Metabolism Between Obese and Non-Obese Patients With Type 2 Diabetes
Hisayuki Katsuyamaa, Hiroki Adachia, Hidetaka Hamasakia, Sumie Moriyamaa, Akahito Sakoa, b, Hidekatsu Yanaia, b, c
aDepartment of Internal Medicine, National Center for Global Health and Medicine, Kohnodai Hospital, Chiba 272-8516, Japan
bClinical Research Center, National Center for Global Health and Medicine, Kohnodai Hospital, Chiba 272-8516, Japan
cCorresponding Author: Hidekatsu Yanai, Department of Internal Medicine and Clinical Research Center, National Center for Global Health and Medicine, Kohnodai Hospital, 1-7-1 Kohnodai, Chiba 272-8516, Japan
Manuscript accepted for publication November 11, 2014
Short title: Sitagliptin Treatment
doi: http://dx.doi.org/10.14740/jem243w
| Abstract | ▴Top |
Background: We previously reported that HbA1c levels and body weight significantly decreased by 0.6% and by 0.8 kg, respectively, at 6 months after sitagliptin treatment started. We found a significant and negative correlation between change in body weight and body mass index (BMI) at baseline.
Methods: We retrospectively sub-analyzed effects of 6-month treatment with sitagliptin on glucose and lipid metabolism, blood pressure, body weight and renal function in patients with type 2 diabetes, by dividing 173 type 2 diabetic subjects into obese group (BMI ≥ 25) and non-obese group (BMI < 25).
Results: At baseline, obese group was significantly younger than non-obese group. Diastolic blood pressure, low-density lipoprotein-cholesterol (LDL-C), triglyceride (TG), and estimated glomerular filtration rate (eGFR) in obese group were significantly higher than in non-obese group. Serum high-density lipoprotein-cholesterol (HDL-C) in obese group was significantly lower than in non-obese group. At 6 months after the start of sitagliptin use, body weight significantly decreased in obese group, while body weight did not change in non-obese group. HbA1c significantly decreased in both groups. Serum HDL-C significantly decreased in obese group, while serum HDL-C did not change in non-obese group. Serum TG significantly decreased in obese group, while serum TG significantly increased in non-obese group. Change in serum TG was significantly and inversely correlated with BMI at baseline.
Conclusions: We found significant differences in effects of sitagliptin treatment on body weight and lipid metabolism between obese and non-obese patients with type 2 diabetes. Sitagliptin improved HbA1c regardless of the existence of obesity. In obese people, sitagliptin significantly reduced body weight and serum TG. Sitagliptin reduced serum TG in a baseline-BMI-dependent manner.
Keywords: Body weight; HbA1c; Obesity; Sitagliptin; Triglyceride
| Introduction | ▴Top |
We previously reported effects of 6-month treatment with sitagliptin on glucose and lipid metabolism, blood pressure, body weight and renal function in patients with type 2 diabetes [1]. We found that HbA1c levels and body weight significantly decreased by 0.6% and by 0.8 kg, respectively, at 6 months after sitagliptin treatment started. We also found a significant and negative correlation between change in body weight and body mass index (BMI) at baseline, and a significant and negative correlation between change in HbA1c and HbA1c levels at baseline. Here, we retrospectively sub-analyzed effects of 6-month treatment with sitagliptin on glucose and lipid metabolism, blood pressure, body weight and renal function in patients with type 2 diabetes by dividing studied subjects into obese group (BMI ≥ 25) and non-obese group (BMI < 25).
| Materials and Methods | ▴Top |
Subjects
We retrospectively studied 173 type 2 diabetic patients who had taken sitagliptin for 6 months by a chart-based analysis. Clinical and biochemical characteristics of patients with BMI ≥ 25 (n = 98) and < 25 (n = 75) was shown in Table 1. Other prescribed oral anti-diabetic drugs were shown in Table 2.
| Table 1. Clinical and Biochemical Characteristic of Patients With BMI ≥ 25 and < 25 |
| Table 2. Other Prescribed Anti-Diabetic Drugs in Patients With BMI ≥ 25 and < 25 |
Methods
This study was approved by the Institutional Ethics Committee in National Center for Global Health and Medicine, Japan. We selected patients who have both data before and after 6-month sitagliptin treatment and compared the data before the sitagliptin treatment with the data at 6 months after the sitagliptin treatment started. Body weight, blood pressure, plasma glucose, HbA1c, serum low-density lipoprotein cholesterol (LDL-C), triglyceride (TG), high-density lipoprotein cholesterol (HDL-C), and estimated glomerular filtration rate (eGFR) in type 2 diabetic patients were measured almost at the same time points before and after 6-month treatment with sitagliptin. Serum LDL-C levels were determined by direct measurement or the Friedewald’s formula.
Statistical analyses
Differences in body weight, blood pressure, plasma glucose, HbA1c, serum lipids and eGFR between before and after 6-month sitagliptin treatment were analyzed by the paired t-test. We analyzed the correlation between changes in metabolic parameters and BMI at baseline by the Pearson’s correlation test. P < 0.05 was considered to be statistically significant.
| Results | ▴Top |
At baseline, age in obese group was significantly younger than non-obese group (Table 1). Body weight and BMI in obese group were significantly greater than in non-obese group. Diastolic blood pressure, serum LDL-C, TG, and eGFR in obese group were significantly higher than in non-obese group. Serum HDL-C in obese group was significantly lower than in non-obese group.
There was no significant difference in frequency of use of other prescribed anti-diabetic drugs between obese and non-obese groups (Table 2).
We did not observe significant changes in blood pressure, plasma glucose and eGFR at 6 months after the start of sitagliptin use in both obese and non-obese groups (Table 3).
| Table 3. Changes in Blood Pressure, Plasma Glucose and eGFR at 6 Months After the Start of Sitagliptin Use |
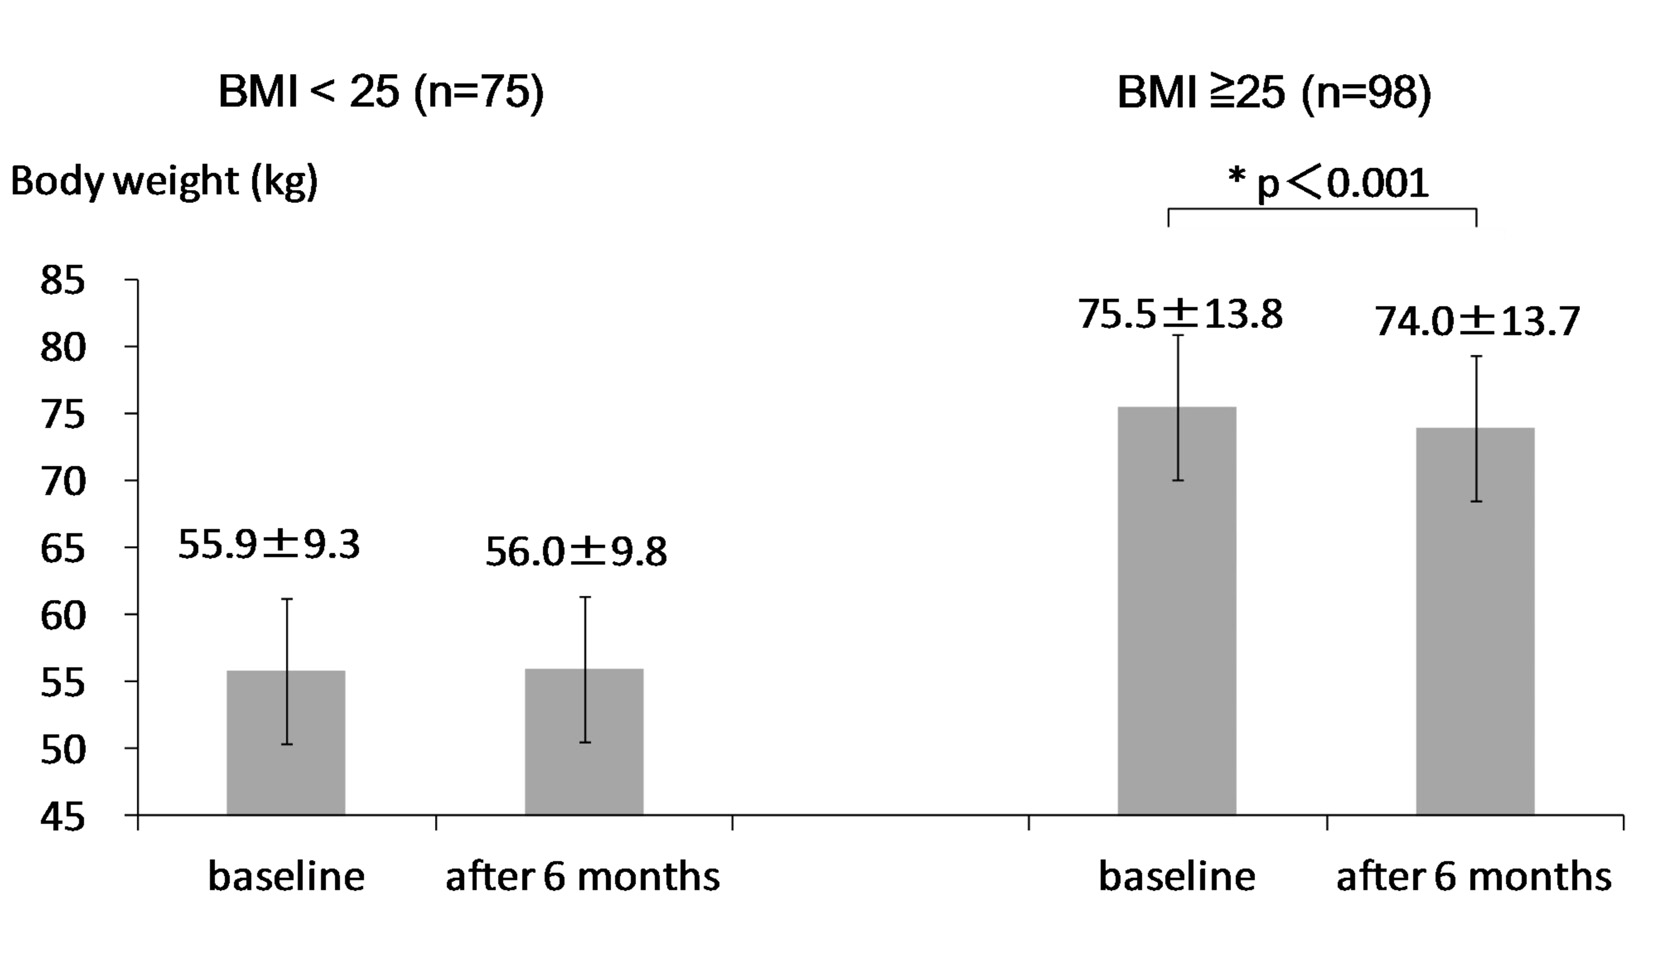
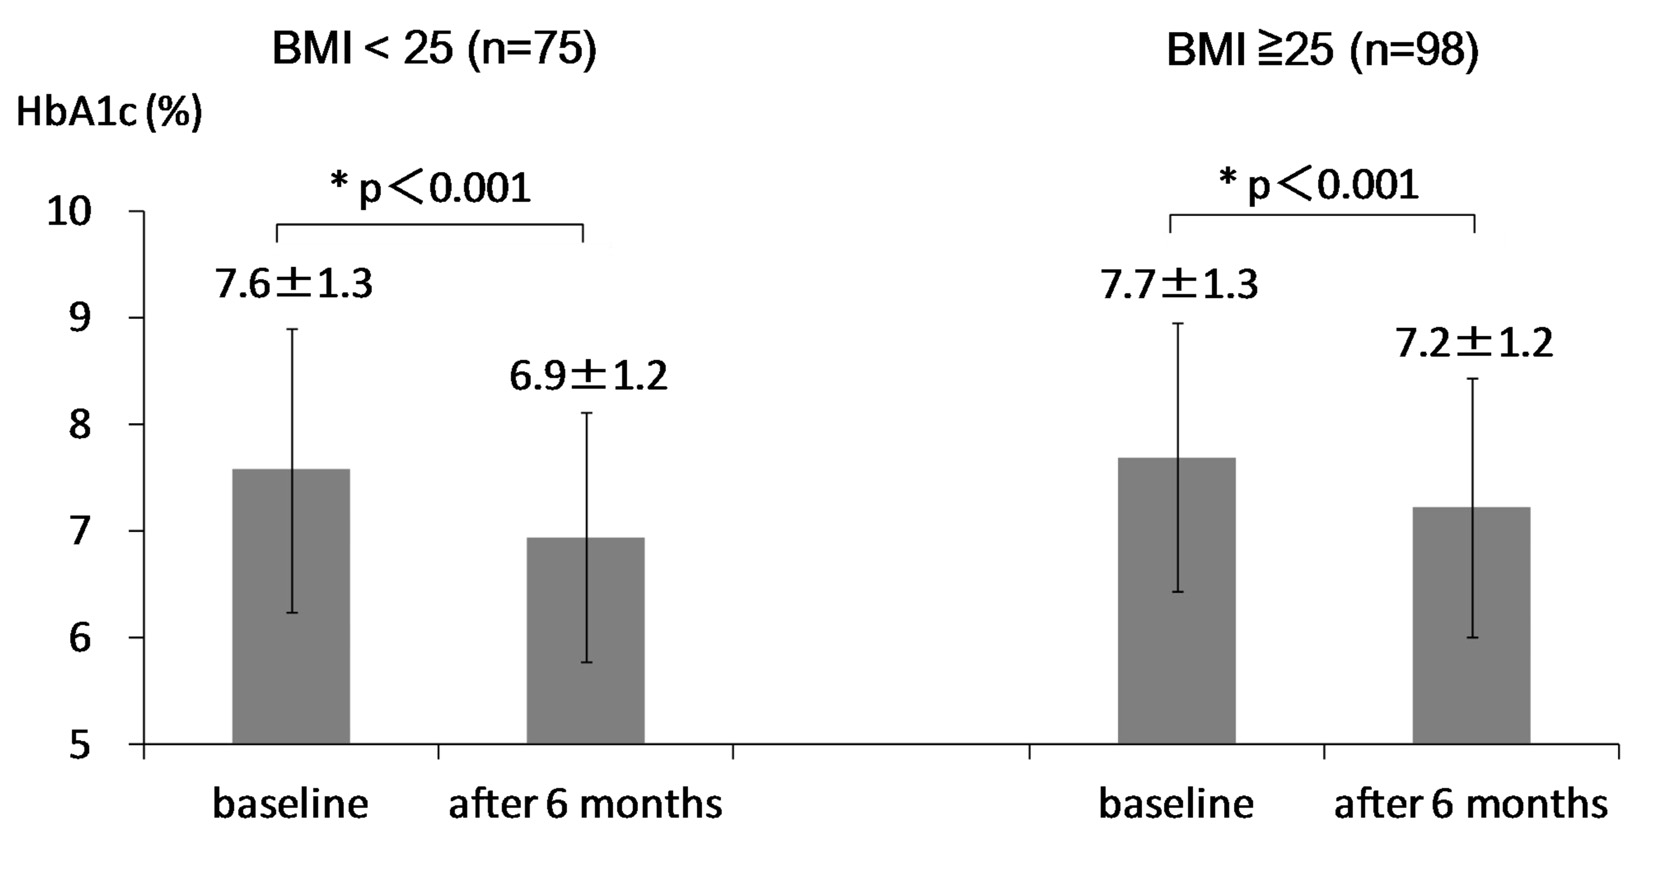
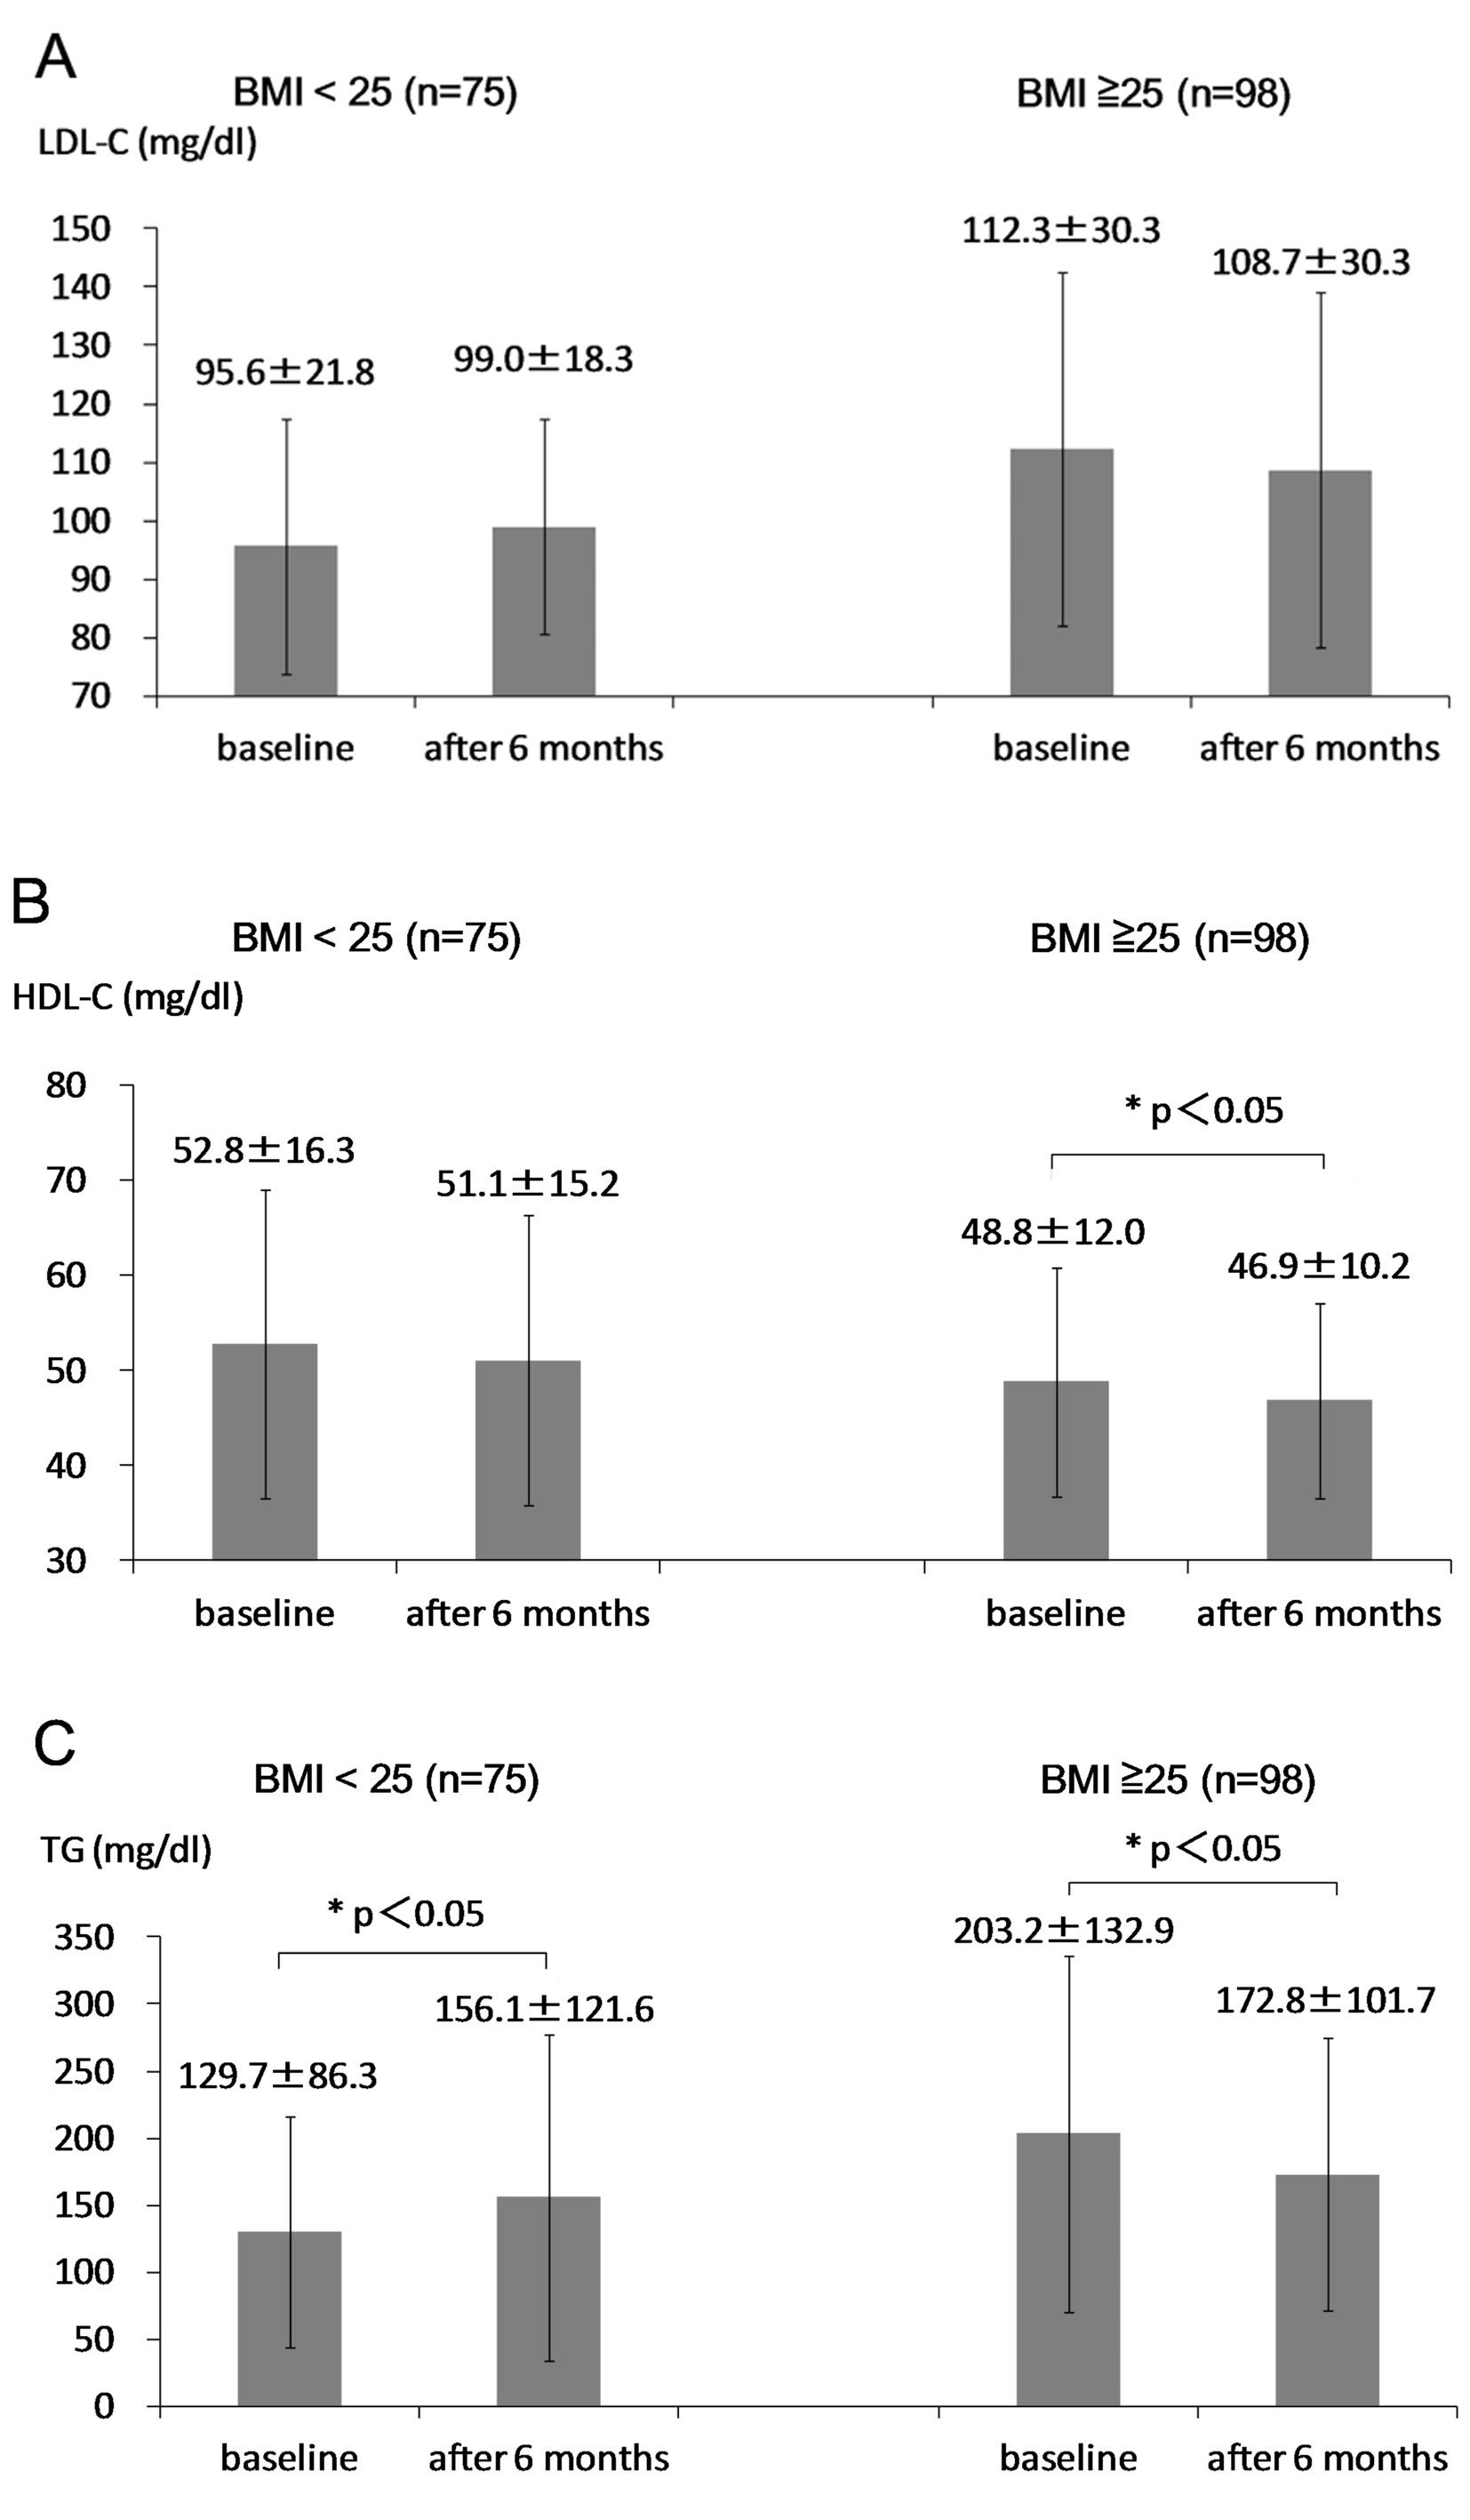
At 6 months after the start of sitagliptin use, body weight significantly decreased in obese group, while body weight did not change in non-obese group (Fig. 1). HbA1c significantly decreased in both groups (Fig. 2). Serum LDL-C did not significantly change in both groups (Fig. 3A). Serum HDL-C significantly decreased in obese group, while serum HDL-C did not change in non-obese group (Fig. 3B). Serum TG significantly decreased in obese group, while serum TG significantly increased in non-obese group (Fig. 3C).
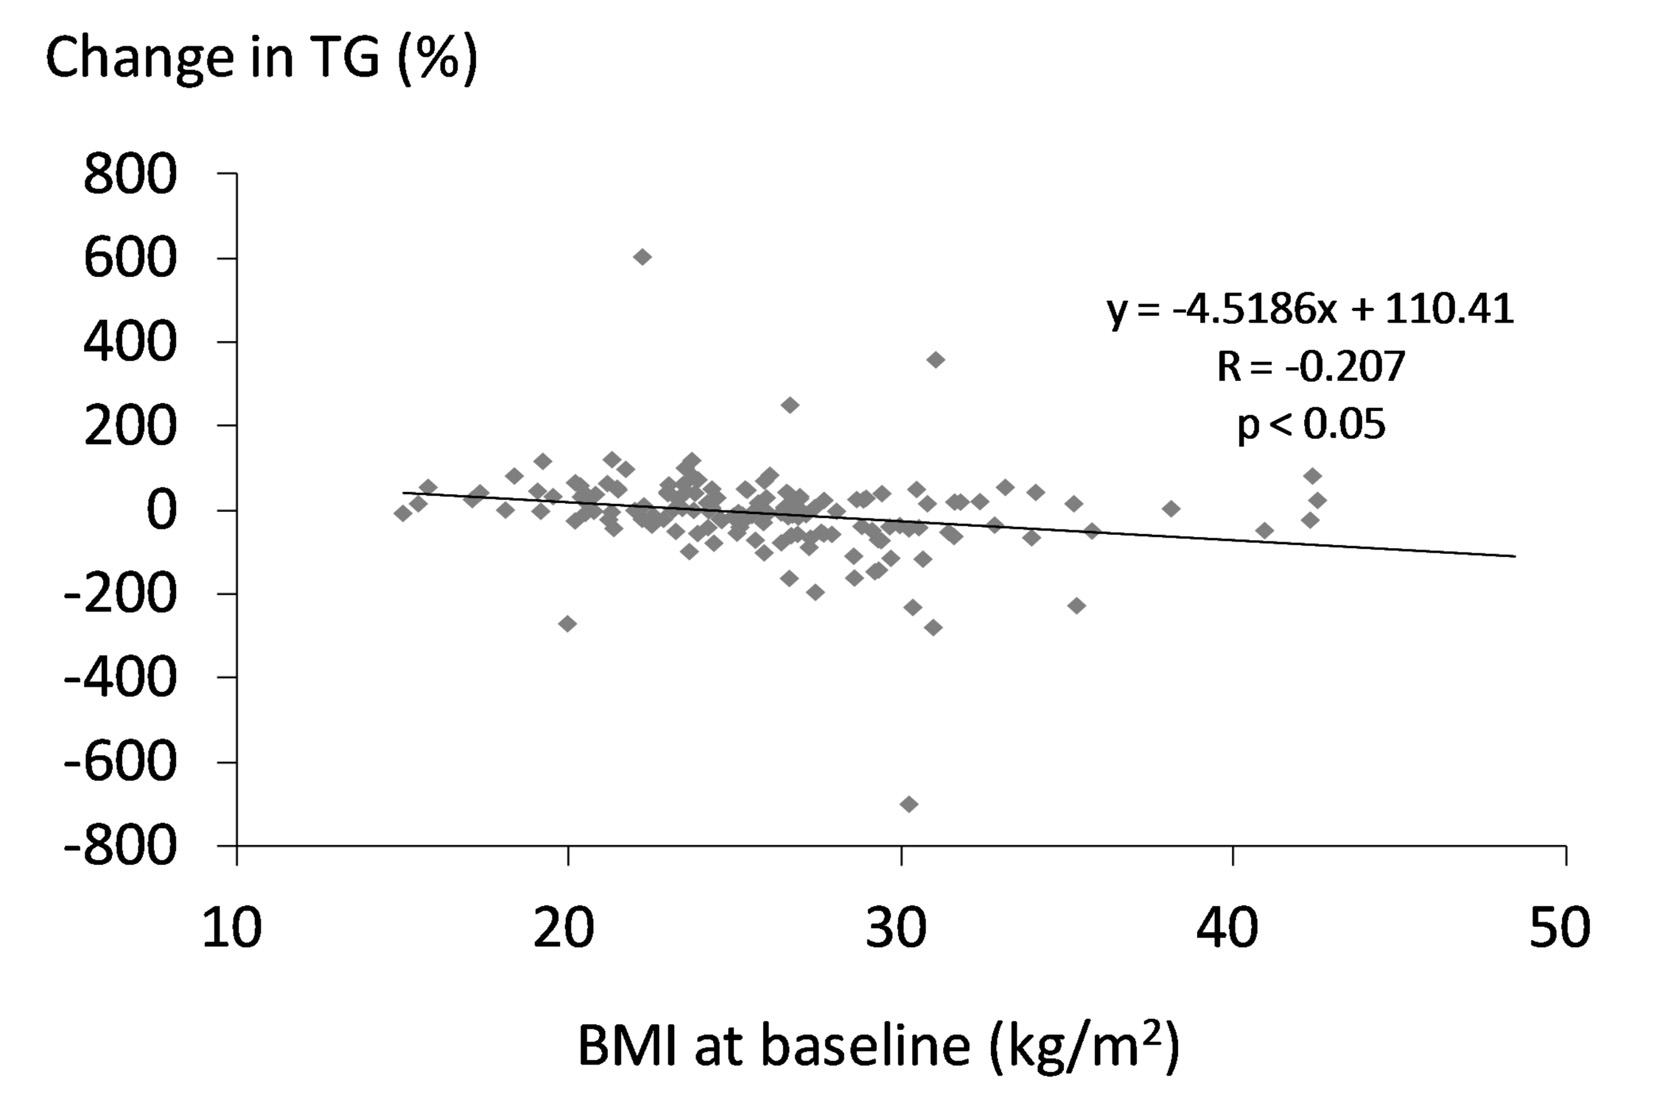
Changes in LDL-C and HDL-C were not significantly correlated with BMI at baseline. We found a significant and inverse correlation between change in TG and BMI at baseline (Fig. 4).
 Figure 4. Correlation between change in serum TG and BMI at baseline. A statistical analysis was performed by the Pearson’s correlation test. R indicates correlation coefficient. Figure 4. Correlation between change in serum TG and BMI at baseline. A statistical analysis was performed by the Pearson’s correlation test. R indicates correlation coefficient. |
| Discussion | ▴Top |
The characteristics of dyslipidemia in obesity include elevated fasting and postprandial TG with the preponderance of small dense LDL and low HDL-C [2]. Lipolysis of TG-rich lipoproteins is impaired in obesity by reduced expression of lipoprotein lipase (LPL) mRNA in adipose tissue [3]. Elevated TG induces delayed clearance of TG-rich lipoproteins, and increases formation of small dense LDL [4-12]. In addition to abnormal metabolism of TG-rich lipoproteins, LDL receptor expression has been also reported to be reduced in obesity [13]. In obesity, HDL metabolism is strongly affected by increased TG-rich lipoproteins. Increased TG-rich lipoproteins result in increased cholesterol ester transfer protein (CETP) activity, which exchanges cholesterolesters from HDL for TG from very low-density lipoprotein (VLDL) and LDL [14]. The lipolysis of TG-rich HDL by hepatic lipase induces an increase in small HDL with a reduced affinity for apo A-I [15]. These mechanisms may lead to lower levels of HDL-C in obesity. In present study, obese patients showed higher levels of LDL-C and TG, and lower levels of HDL-C as compared with non-obese patients, presenting characteristic lipid abnormalities in obesity.
In obese patients, visceral obesity, insulin resistance, sympathetic overactivity, oxidative stress, endothelial dysfunction, activated renin-angiotensin system, increased inflammatory mediators and obstructive sleep apnea have been suggested to be possible factors to develop hypertension [16]. Diastolic blood pressure was significantly higher in obese group than in non-obese group.
At baseline, eGFR in obese group was significantly higher than non-obese group. Renal function and eGFR have been reported to decline by aging [17]. Age in obese group was significantly younger than non-obese group, which can explain a significant difference in eGFR between obese and non-obese groups.
Body weight significantly decreased by 1.5 kg in obese group, while body weight did not change in non-obese group. In preset study, we observed a significant difference in age between obese and non-obese groups at the baseline. To understand the influence of age on change in body weight, we studied the correlation of age with change in body weight in type 2 diabetic patients including obese and non-obese patients. The reduction rate of body weight was significantly and positively correlated with BMI at baseline (r = 0.31, P < 0.001). However, age was not significantly correlated with change in body weight (r = -0.09, P = 0.337), denying a significant influence of age on change in body weight. HbA1c significantly decreased in both obese and non-obese groups, suggesting that sitagliptin may reduce HbA1c regardless of the existence of obesity.
We did not observe changes in blood pressure, plasma glucose, LDL-C and eGFR at 6 months after the start of sitagliptin use in both obese and non-obese groups. Sitagliptin and sitagliptin-mediated changes in metabolic parameters may not influence on these parameters.
Although HDL-C was expected to increase in obese group due to body weight loss [2, 15], HDL-C significantly decreased in obese group. We cannot explain this discrepancy between expected result and obtained result, which should be elucidated in the future. Serum TG significantly increased in non-obese group. This is a retrospective study, and measurements of non-fasting serum lipids were performed in approximately 20% of subjects studied, which may induce the increase of TG in non-obese group. Serum TG significantly decreased in obese group, and we observed a significant and inverse correlation between change in TG and BMI at baseline, suggesting that sitagliptin reduces TG more in obese people. Age was not also significantly correlated with change in serum TG (r = -0.04, P = 0.62) in all participants including obese and non-obese patients. Body weight loss may ameliorate insulin resistance, and subsequently may increase expression of LPL which led to reduction in TG among obese people [2, 3, 18]. To understand the effects of sitagliptin on serum lipids precisely and validly, further studies, preferably with larger numbers of subjects in fasting state, will be needed.
In conclusion, we found significant differences in effects of sitagliptin treatment on body weight and lipid metabolism between obese and non-obese patients with type 2 diabetes. Sitagliptin improved HbA1c regardless of the existence of obesity. In obese people, sitagliptin significantly reduced body weight and serum TG. Sitagliptin reduced serum TG in a baseline-BMI-dependent manner.
Acknowledgement
The authors would like to thank Tomoko Kaga, Yukari Takano, Fumi Kawasaki, Yukie Kawamura and Naomi Inoue at Clinical Research Center, National Center for Global Health and Medicine, Kohnodai Hospital, for their technical help.
Conflict of Interest
The authors declare that they have no competing interests.
Funding Support
This work was funded by a grant from the National Center for Global Health and Medicine (25-203).
| References | ▴Top |
- Yanai H, Adachi H, Hamasaki H, Masui Y, Yoshikawa R, Moriyama S, Mishima S, et al. Effects of 6-month sitagliptin treatment on glucose and lipid metabolism, blood pressure, body weight and renal function in type 2 diabetic patients: a chart-based analysis. J Clin Med Res. 2012;4(4):251-258.
pubmed - Klop B, Elte JW, Cabezas MC. Dyslipidemia in obesity: mechanisms and potential targets. Nutrients. 2013;5(4):1218-1240.
doi pubmed - Clemente-Postigo M, Queipo-Ortuno MI, Fernandez-Garcia D, Gomez-Huelgas R, Tinahones FJ, Cardona F. Adipose tissue gene expression of factors related to lipid processing in obesity. PLoS One. 2011;6(9):e24783.
doi pubmed - Patsch JR, Miesenbock G, Hopferwieser T, Muhlberger V, Knapp E, Dunn JK, Gotto AM, Jr., et al. Relation of triglyceride metabolism and coronary artery disease. Studies in the postprandial state. Arterioscler Thromb. 1992;12(11):1336-1345.
doi pubmed - Ryu JE, Howard G, Craven TE, Bond MG, Hagaman AP, Crouse JR, 3rd. Postprandial triglyceridemia and carotid atherosclerosis in middle-aged subjects. Stroke. 1992;23(6):823-828.
doi pubmed - Karpe F, Steiner G, Uffelman K, Olivecrona T, Hamsten A. Postprandial lipoproteins and progression of coronary atherosclerosis. Atherosclerosis. 1994;106(1):83-97.
doi - Ellsworth JL, Fong LG, Kraemer FB, Cooper AD. Differences in the processing of chylomicron remnants and beta-VLDL by macrophages. J Lipid Res. 1990;31(8):1399-1411.
pubmed - Genest J, Sniderman A, Cianflone K, Teng B, Wacholder S, Marcel Y, Kwiterovich P, Jr. Hyperapobetalipoproteinemia. Plasma lipoprotein responses to oral fat load. Arteriosclerosis. 1986;6(3):297-304.
doi pubmed - Cabezas MC, de Bruin TW, Jansen H, Kock LA, Kortlandt W, Erkelens DW. Impaired chylomicron remnant clearance in familial combined hyperlipidemia. Arterioscler Thromb. 1993;13(6):804-814.
doi pubmed - Castro Cabezas M, de Bruin TW, de Valk HW, Shoulders CC, Jansen H, Willem Erkelens D. Impaired fatty acid metabolism in familial combined hyperlipidemia. A mechanism associating hepatic apolipoprotein B overproduction and insulin resistance. J Clin Invest. 1993;92(1):160-168.
doi pubmed - Capell WH, Zambon A, Austin MA, Brunzell JD, Hokanson JE. Compositional differences of LDL particles in normal subjects with LDL subclass phenotype A and LDL subclass phenotype B. Arterioscler Thromb Vasc Biol. 1996;16(8):1040-1046.
doi pubmed - Hokanson JE, Krauss RM, Albers JJ, Austin MA, Brunzell JD. LDL physical and chemical properties in familial combined hyperlipidemia. Arterioscler Thromb Vasc Biol. 1995;15(4):452-459.
doi pubmed - Mamo JC, Watts GF, Barrett PH, Smith D, James AP, Pal S. Postprandial dyslipidemia in men with visceral obesity: an effect of reduced LDL receptor expression? Am J Physiol Endocrinol Metab. 2001;281(3):E626-632.
pubmed - Subramanian S, Chait A. Hypertriglyceridemia secondary to obesity and diabetes. Biochim Biophys Acta. 2012;1821(5):819-825.
doi pubmed - Deeb SS, Zambon A, Carr MC, Ayyobi AF, Brunzell JD. Hepatic lipase and dyslipidemia: interactions among genetic variants, obesity, gender, and diet. J Lipid Res. 2003;44(7):1279-1286.
doi pubmed - Yanai H, Tomono Y, Ito K, Furutani N, Yoshida H, Tada N. The underlying mechanisms for development of hypertension in the metabolic syndrome. Nutr J. 2008;7:10.
doi pubmed - Hemmelgarn BR, Zhang J, Manns BJ, Tonelli M, Larsen E, Ghali WA, Southern DA, et al. Progression of kidney dysfunction in the community-dwelling elderly. Kidney Int. 2006;69(12):2155-2161.
doi pubmed - Howard BV. Insulin resistance and lipid metabolism. Am J Cardiol. 1999;84(1A):28J-32J.
doi
This is an open-access article distributed under the terms of the Creative Commons Attribution License, which permits unrestricted use, distribution, and reproduction in any medium, provided the original work is properly cited.
Journal of Endocrinology and Metabolism is published by Elmer Press Inc.


