

| Journal of Endocrinology and Metabolism, ISSN 1923-2861 print, 1923-287X online, Open Access |
| Article copyright, the authors; Journal compilation copyright, J Endocrinol Metab and Elmer Press Inc |
| Journal website http://www.jofem.org |
Original Article
Volume 3, Number 3, June 2013, pages 47-56
Vitamin D Levels in Overweight/Obese Adults With and Without Metabolic Syndrome
Savas Karatasa, Zeliha Hekimsoyb, e, Gonul Dincc, Ece Onurd, Bilgin Ozmenb
aDepartment of Internal Medicine, Celal Bayar University, Manisa, Turkey
bDepartment of Internal Medicine, Division of Endocrinology and Metabolism, Celal Bayar University, Manisa, Turkey
cDepartment of Public Health, Celal Bayar University, Manisa, Turkey
dDepartment of Clinical Biochemistry, Celal Bayar University, Manisa, Turkey
eCorresponding author: Zeliha Hekimsoy, 259 sok. No36/1, D.3, Ozlu apartment, Hatay, Izmir, 35360 Turkey
Manuscript accepted for publication May 27, 2013
Short title: Vitamin D Levels in Overweight/Obese
doi: https://doi.org/10.4021/jem166e
| Abstract | ▴Top |
Background: Vitamin D role is not only associated with mineral metabolism and bone health but also in globally important diseases such as obesity and metabolic syndrome. The aims of this observational study were to investigate: 1) 25(OH) vitamin D levels in overweight/obese persons with and without metabolic syndrome and compare these with levels in healthy subjects, 2) the relationship between serum 25(OH) vitamin D levels and metabolic syndrome components such as body mass index, waist circumference, blood pressure, fasting blood glucose, lipid parameters and insulin resistance:Homeostasis Model Assesment of Insulin Resistance (HOMA-IR).
Methods: Participants (n = 287) were 94 overweight/obese adults with metabolic syndrome, 120 overweight/obese adults without metabolic syndrome, and 73 non-obese healthy subjects (controls). Overweight/obese subjects were classified as metabolic syndrome (MetS) positive according to the recent International Diabetes Federation criteria. HOMA-IR was calculated as serum glucose (mg/dL) × insulin level (µU/mL)/405. Vitamin D nutritional status was assessed as deficient if 25(OH) vitamin D levels were < 20 ng/mL, insufficient if ≥ 20 - < 30 ng/mL, and sufficient if ≥ 30 ng/mL.
Results: Serum 25(OH) vitamin D deficiency, defined as a level < 20 ng/mL, was more common in overweight/obese adults with (72%) and without (69%) metabolic syndrome than in controls (49%) (P = 0.006). Serum 25(OH) vitamin D levels were significantly lower in overweight/obese metabolic syndrome adults (16.8 ±7.3 ng/mL) and overweight/obese non-metabolic syndrome adults (18.3 ± 8.6 ng/mL) than healthy subjects (21.2 ± 8.9 ng/mL, P = 0.001). A negative relationship was found between serum 25(OH) vitamin D levels and body mass index (r = -0.159, P = 0.007) and serum triglyceride levels (r = -0.149, P = 0.012). Serum 25(OH) vitamin D levels correlated inversely (not statistically significant) to waist circumference, fasting blood glucose, HOMA-IR, and blood pressure, but positively (not statistically significant) to HDL cholesterol levels.
Conclusions: Vitamin D deficiency is very common in overweight/obese adults, more so than in healthy controls. Vitamin D deficiency is not more common in those with metabolic syndrome than in those without. Reduced 25(OH) vitamin D levels are associated with an increased risk of overweight/obesity and metabolic syndrome.
Keywords: Vitamin D; Vitamin D status; Obesity; Metabolic syndrome; Vitamin D deficiency
| Introduction | ▴Top |
Vitamin D was identified a hundred years ago, when it was realized that cod liver oil contained a substance that cured rickets. Over the last century, after vitamin D fortification of commonly consumed foods was begun, rickets began to disappear and public health officials became complacent about major health problems due to vitamin D deficiency. However, recent studies have found that rickets and musculoskeletal diseases were only the tip of the vitamin D deficiency iceberg; many diseases such as cancer, autoimmune diseases, and cardiovascular diseases have also been found to be associated with vitamin D deficiency [1-3]. Reports from various areas of the world have found that metabolic syndrome, a risk factor for diabetes and cardiovascular morbidity [4], is a process that is also possibly related to vitamin D deficiency [5-7]. Obesity, as a precursor to metabolic syndrome, has been linked to vitamin D deficiency in recent studies [8-12].
In this cross-sectional study, we aimed to investigate: 1) 25(OH) vitamin D levels in overweight/obese adults with and without metabolic syndrome and compare these with levels in healthy subjects, 2) the relationship between serum 25(OH) vitamin D levels and the components of metabolic syndrome.
| Materials and Methods | ▴Top |
The study protocol was approved by the Institute of Health and Human Development Ethical Issues on Clinical Trials Review Board of our university. Between February 2008 and April 2009, adults aged 20 - 65 years presenting to the internal medicine clinic of our tertiary university hospital because of weight problems were invited to participate in the study. After informed consent was obtained on the initial visit, a standardized questionnaire regarding demographics, smoking and alcohol status, past medical history, and current medications was administered by a trained clinician. Exclusion criteria included the following: use of vitamin D, calcium supplements, an antihyperlipidemic drug, or medications that influence vitamin D metabolism, a medical condition that could cause weight gain, or a known abnormality that influences vitamin D metabolism. Then, participants had a detailed physical examination. The following anthropometric measures were performed by the samephysician ( Savas Karatas) using the same devices throughout the study: height (m), weight (kg) using a manual scale, and waist circumference (WC) measured in cm at the umbilicus. Blood pressure (mmHg) was measured three times after a rest of at least five minutes using a mercury sphygnomanometer. The mean of the second and third blood pesssures was recorded as the patient’s mean arterial pressure. Body mass index (BMI, kg/m2) was calculated. A BMI was categorised as normal weight (18.5 - 24.9 kg/m2), overweight (25 - 29.9 kg/m2) and obese ( ≥ 30 kg/m2). For analysis purposes, overweight and obese persons were divided into two groups, those who met and those who did not meet criteria for metabolic syndrome. Metabolic syndrome was considered present if three or more of the following components of the International Diabetes Federation Criteria for Europeans [13] were present: waist circumference ≥ 94 cm for men or ≥ 80 cm for women, blood pressure (BP)≥ 130/85 mmHg or current use of antihypertensive medication, triglycerides (Tg) ≥ 150 mg/dL, HDL cholesterol <40 mg/dL for men or < 50 mg/dL for women, and fasting plasma glucose (FPG) ≥ 100 mg/dL.
The season (winter versus summer) of the patient’s participation was recorded also, for analysis purposes. The warmest months in our area, according to our national metereological agency, are from May to October and were defined as ‘summer’; the cooler months, from November to April, were defined as ‘winter’.
Laboratory methods
Venous samples were collected, avoiding haemolysis, into plain and EDTA tubes in the morning after a 12 hours fasting period. Blood samples were centrifugated immediately at 800 g for 10 minutes at 4°C, then serum and plasma were stored at -70°C until use. Levels of plasma glucose, serum phosphorus, calcium, alkaline phosphatase, total protein, albumin, triglycerides, total cholesterol and HDL-cholesterol were measured by a colorimetric method on an automatic analyzer (Unicel DxC 600/800, Beckman Coulter, Brea, USA). Serum LDL-cholesterol was calculated using the Friedewald formula (LDL cholesterol = total cholesterol minus HDLcholesterol minus (triglyceride/5)). Plasma parathyroid hormone and serum insulin levels were measured by chemiluminescence on a IMMULITE 2000 (Siemens Healthcare Diagnostics, Munich, Germany) analyzer. 25(OH) vitamin D levels were measured by an HPLC device (Thermo-Finnigan, Waltham, USA) using Vitamin D3 ClinRep HPLC kits (RECIPE Chemicals + Instruments GmbH, Munich, Germany). Vitamin D nutritional status was assessed as deficient if 25(OH) vitamin D levels were < 20 ng/mL, insufficient if ≥ 20 - < 30 ng/mL, and sufficient if ≥ 30 ng/mL [1]. The insulin resistance index : Homeostasis Model Assesment of Insulin Resistance (HOMA-IR) was calculated as HOMA-IR = serum glucose (mg/dL) × insulin level (µU/mL) /405 [14, 15].
Statistical methods
Statistical analyses were performed with SPSS 11.0 (SPSS, Inc., Chicago, USA). Data were expressed as mean ±SD. Analysis of covariance with Tukey’s HSD as a post-comparison tests were used to compare mean vitamin D level between control subjects, overweight/obese metabolic syndrome, and overweight/obese non-metabolic syndrome adults while one-way ANOVA with Tukey’s HSD was used to compare other numerical variables of the groups. Chi-square testing was used to analyze categoric values (gender, season). Pearson coefficient of correlation was used to analyze univariate relationships between numerical variables. The associations between the metabolic syndrome and its components and concentrations of 25(OH) vitamin D were examined by multiple logistic regression analysis. Several logistic regression models were developed to obtain adjusted odds ratios and their corresponding 95% CIs of 25(OH) vitamin D deficiency and insufficieny, taking into account the presence of metabolic syndrome and its components.
Metabolic syndrome and each of the its components was introduced as a dependent variable and 25(OH) vitamin D as a independent variable. Regression models were performed with two different models for each variable: the first model was adjusted for age, sex and season, and the second model was adjusted for age, sex and season and metabolic syndrome components. Coding for the variables included in the models as as follows:
Dependent variables: metabolic syndrome (yes = 1/no = 0), abdominal obesity (yes = 1/no = 0), hypertriglyceridemia (yes = 1/no = 0), low HDL cholesterol (yes = 1/no = 0), hypertension (yes = 1/no = 0), hyperglycemia (yes = 1/no = 0), obesity (BMI level < 30 = 0, ≥ 30 = 1), overweight (BMI level < 25 = 0, ≥ 25 = 1), HOMA-IR (< 2, 8 = 0, ≥ 2.8 = 1).
Independent variables: 25(OH) vitamin D level, 25(OH) vitamin D deficiency (1), 25(OH) vitamin D insufficieny (2), 25(OH) vitamin D sufficieny (3, reference level).
Confounders: age (18 – 34 = 1 (reference), 35 – 49 = 2, ≥ 50 = 3), sex (male = 1, female = 0), season (winter = 1, summer = 0). Results with a p value of less than 0.05 were considered statistically significant.
| Results | ▴Top |
Of the 300 adults meeting inclusion criteria for participation in the study, 13 were excluded for various reasons, leaving 287 patients, all of whom gave consent to participate. Of these, 94 were overweight/obese with metabolic syndrome (OwithMS), 120 were overweight/obese without metabolic syndrome (OwithoutMS), and 73 were non-obese healthy subjects. The demographic characteristics and laboratory parametres of these three groups are shown in Table 1. BMI, WC, serum insulin and triglycerides, and HOMA index were all significantly higher in OwithMS and OwithoutMS subjects compared to healthy controls (P < 0.001 for all variables). Fasting plasma glucose was significantly higher in OwithMS than OwithoutMS and healthy controls, and serum HDL cholesterol was significantly lower in OwithMS than in OwithoutMS and healthy controls (P < 0.001 for all variables, Table 1).
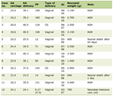 Click to view | Table 1. Demographic Characteristics and Laboratory Parameters of Overweight/Obese Adults With Metabolic Syndrome (n = 94, OwithMS), Overweight/Obese Adults Without Metabolic Syndrome (n = 120, OwithoutMS), and Healthy Controls (n = 73, Healthy). |
Table 2 shows the distribution of study participants (healthy controls, OwithMS and OwithoutMS) according to age, gender, body mass index (BMI) and season of patient evaluation.
Click to view | Table 2. Distribution of Healthy Controls (Healthy) and Overweight/Obese Adults With (OwithMS) and Without (OwithoutMS) Metabolic Syndrome, According to Age, Gender, Body Mass Index (BMI), and Season of Patient Evaluation. P Values Were Calculated Using Chi-square Testing. |
The mean levels of 25(OH) vitamin D were 16.8 ± 7.3 ng/mL in OwithMS persons, 18.3 ± 8.6 ng/mL in OwithoutMS persons, and 21.2 ± 8.9 ng/mL in healthy subjects (p = 0.001, analysis of covariance with Tukey’s HSD as a post-comparison test, Table 1). 25(OH) vitamin D deficiency was present in 72.3% of OwithMS subjects, 69.2% of OwithoutMS subjects, and 49.3% of healthy controls. The prevalence of adequate vitamin D levels was significantly lower in OwithMS subjects (5.3%) compared to OwithoutMS participants (13.3%) and healthy controls (16.4%, P = 0.006 by chi-square testing, Table 3).
Click to view | Table 3. Serum vitamin D Levels in Healthy Controls (Healthy) and in Overweight/Obese Persons With (OwithMS) and Without (OwithoutMS) Metabolic Syndrome. |
The relationship between 25(OH) vitamin D levels and metabolic syndrome components are shown in Table 4. Serum 25(OH) vitamin D levels were inversely related to body mass index and serum triglyceride levels (Pearson correlation test, r = -0.159, P = 0.007; r = 0.149, P = 0.012 respectively). Serum 25(OH) vitamin D levels correlated inversely (not statistically significant) to waist circumference, fasting blood glucose, HOMA-IR, and blood pressure, but positively (not statistically significant) to HDL cholesterol levels (Table 4).
Click to view | Table 4. Relationship Between Serum 25(OH) Vitamin D and Components of Metabolic Syndrome (Pearson Correlation Test) in Healthy Controls and in Overweight/Obese Persons With and Without Metabolic Syndrome. |
Metabolic syndrome was present in 65.4% of vitamin D deficient persons, 45.7% of vitamin D insufficient persons and 29.4% of vitamin D sufficient persons (p = 0.005, Table 5). Of the vitamin D deficient overweight/obese participants, 45% had metabolic syndrome (Table 5).
Click to view | Table 5. Unadjusted Prevalence and Adjusted Odds Ratios and 95% Confidence Limits of Having the Metabolic Syndrome by Different Categories of Serum Vitamin D Concentrations in Healthy Controls (Healthy) and in Overweight/Obese Adults With (OwithMS) and Without (OwithoutMS) Metabolic Syndrome. |
When adjusted for age, sex, and season, metabolic syndrome was 6.1 (95% CI 1.83 - 20.47, P < 0.01, Table 5) times more likely to be found in vitamin D deficient subjects and 2.45 (95% CI 0.69 - 8.68) times more likely to be found in subjects with vitamin D insufficiency. When adjusted for age, sex, season and components of the metabolic syndrome, metabolic syndrome was 10.89 (95% CI 1.68 - 70.3) times more likely to be found in vitamin D deficient persons (P < 0.05) and 2.14 (95% CI 0.34 - 13.36) times more likely to be found in vitamin D insufficient persons (Table 5).
When overweight/obese participants as a whole (with and without metabolic syndrome, n = 214) were analyzed and adjusted for age, sex, and season, metabolic syndrome was 2.62 (95% CI 0.91 - 7.52) times more likely to be found in vitamin D deficient persons (P = 0.073, Table 5) and 3.20 (95% CI 0.99 - 10.33) times more likely to be found in vitamin D insufficient subjects (p = 0.052, Table 5). When overweight/obese persons as a whole (with and without metabolic syndrome, n = 214) were analyzed and adjusted for age, sex, season and components of the metabolic syndrome, metabolic syndrome was 8.3 (95% CI 1.69 - 40.71) times more likely to be found in those with vitamin D deficiency (P = 0.009, Table 5) and 6.59 (95% CI 1.19 - 35.54) times more likely to be found in those with vitamin D insufficiency (P = 0.031, Table 5).
When the relationship between metabolic syndrome components and concentrations of 25(OH) vitamin D in all participants (n = 287) was analyzed and adjusted for age, sex, season, and components of metabolic syndrome, vitamin D deficiency raised the odds of having hypertriglyceridemia 2.67 fold (95% CI 1.02 - 6.98, P < 0.05,Table 5).
Of the 187 persons with vitamin D deficiency, 19.3% were normal weight, 24.6% were overweight, and 56.1% were obese. Of the 67 subjects with vitamin D insufficiency, 37.3% were normal weight, 22.4% were overweight, and 40.3% were obese. Of the 33 subjects with sufficient levels of vitamin D, 36.4% were with normal weight, 30.3% were overweight, and 33.3% were obese (P = 0.01, Table 6).
Click to view | Table 6. Unadjusted Prevalence, Adjusted Odds Ratios, and 95% Confidence Limits of Overweight, Obesity, HOMA-IR by Different Levels of Serum Vitamin D Concentration in Healthy Controls and Overweight/Obese Persons (With and Without Metabolic Syndrome). |
Among all participants (n = 287), adjusted for age, sex, and season, obesity was 4.03 (95% CI 1.52 - 10.64) times more likely to be found in vitamin D deficient persons (P < 0.01, Table 6) and, when adjusted for age, sex, season, and components of the metabolic syndrome, obesity was 4.71 (95% CI 1.40 - 15.85) times more likely to be found in vitamin D deficient persons (P < 0.05, Table 6).
| Discussion | ▴Top |
Obesity and vitamin D deficiency are both common problems in many area of the world, with metabolic syndrome increasing in frequency, especially in developed countries [1, 16, 17]. This is the first study performed in Turkey which examined vitamin D levels in overweight/obese persons with and without metabolic syndrome compared to levels in healthy subjects. Vitamin D deficiency was common not only in our overweight/obese subjects with (72%) and without (69%) metabolic syndrome, but also in our healthy controls (49%). Vitamin D levels can be affected by many factors such as enviromental, ethnical, and cultural characteristics (clothing style, food habits). In studies performed in Western countries, vitamin D deficiency has been found more frequently in immigrants from Turkey than in European inhabitants [18, 19]. Reasons for this include the frequent use of womens’ clothing that leaves little skin exposed to sunlight and low intake of vitamin D-rich foods such as milk and fish [18, 19]. Because vitamin D deficiency is beginning to be recognized as commonly accompanying metabolic syndrome, studies on this topic should carefully control for the prevalence of obesity.
In our study as in others, serum 25(OH) vitamin D levels and body mass index were inversely correlated, even after correction for season, age and gender [8-12, 20-22]. Possible explanations for this relationship include the usual sedentary lifestyle of obese persons and their spending less time outdoors where skin would be exposed to UV light [23]. Another explanation is that obese persons consume less vitamin D than non-obese persons [24]. Serum 25(OH) vitamin D levels may also be lower in persons with high BMI because they have a high content of body fat, which acts as a reservoir for the lipid-soluble vitamin. In a rat model, adipose tissue accumulated up to 12% of a supplemental dose of vitamin D [25], but such data is limited for humans. In 2008, Blum, et al. using liquid chromatography mass spectrometry to measure levels of vitamin D3 in human subcutaneous fat, found that vitamin D3 concentrations in fat tissue and serum were positively correlated [26].
Another recent discovery that might explain lower vitamin D levels in obese subjects is the finding that vitamin D induces activation of calpain and caspase-12, enzymes involved in the apoptosis of fat tissue [27]. Blumberg, et al. also found that liganded vitamin D receptors in the adipose tissue of 3T3-L1 cells repressed both C/EBP-α and PPAR-gamma expression via inhibition of C/EBP-β expression and action, and was a potent inhibitor of adipogenesis [28]. In addition, Rayalam, et al. found that 1, 25(OH) vitamin D3 and genistein were capable of inducing apoptosis and decreasing lipid accumulation in adipocytes [29].
OwithMS persons had the lowest mean 25(OH) vitamin D levels and highest rate of 25(OH) vitamin D deficiency among the patient groups in our study. In related studies, Forouhi, et al. found that serum 25(OH) vitamin D levels in nondiabetic persons were inversely related to the development of hyperglycemia over the subsequent ten years [30]. Hypponen, et al. found serum 25(OH) vitamin D and IGF-1 levels to be lower in metabolic syndrome persons, the inverse relationship of serum IGF-1 and metabolic syndrome occuring only in those with low serum 25(OH) vitamin D levels [31]. Vitamin D levels were also found to be lower in metabolic syndrome persons who participated in the Third National Health and Nutrition Examination Survey (NHANES III) [6]. Similar to our findings, serum triglyceride levels were inversely related to serum 25(OH) vitamin D levels. However, we did not find a significant relationship between insulin resistance and serum 25(OH) vitamin D levels, contradicting the findings in NHANES III participants [6]. The 2003 – 2004 US National Health and Nutrition Examination Survey found lower 25(OH) vitamin D levels in metabolic syndrome persons than in healthy nonobese subjects [32].
Foss hypothesized that in cold weather, in order to survive; ‘a ‘winter response’ was generated [33]. These phenotypic metabolic and physiological changes (including hypertension and insulin resistance), observed as metabolic syndrome, could result from a ‘winter metabolism’ which increases thermogenic capacity. At very low temperatures, survival might depend on additional fuel being available for shivering, and the lipidaemia, glycaemia, and elevated intramuscular triglycerides observed in metabolic syndrome provide supplementary fuel reserves. According to Foss, the stimulus for the ‘winter response’ was low vitamin D levels. He also suggested that the increasing prevalence of obesity might be slowed or reversed by improving vitamin D status in the general population [33].
Although a significant relationship between blood pressure and serum 25(OH) vitamin D was not found in our study, others have found serum vitamin D levels to be inversely related to hypertension risk [34]. Our finding of an inverse relationship between serum triglyceride and vitamin D levels is consistent with other studies. For example, a daily vitamin D supplement of 83 µg in overweight subjects with inadequate vitamin D status participating in a weight-reduction program significantly lowered serum triglyceride, PTH and TNF-α levels, but did not adversely affect weight loss [35]. As we found in our study, Ford [6] and Lu [7] also found that the odds of obesity and metabolic syndrome were increased in our 25(OH) vitamin D deficient subjects.
A limitation of our study was the measurement of serum 25(OH) vitamin D levels at only one point in time, instead of in two different seasons. A 2009 study found seasonal variation of vitamin D status to be more evident in obese subjects [36]. To overcome this issue, we tried to recruit equal numbers of persons among the different groups in the two main seasons. We also statistically accounted for seasonal variation of vitamin D levels when comparing levels of vitamin D in the various patient groups.
Conclusions
In our patient population, vitamin D deficiency was more common in overweight/obese persons with and without metabolic syndrome than in healthy individuals. Serum 25(OH) vitamin D levels were inversely related to body mass index and serum triglyceride levels. Reduced 25(OH) vitamin D levels are associated with an increased risk of obesity and metabolic syndrome.
Competing Interests
The authors declare that they have no competing interests.
Funding
This work was supported by Celal Bayar University Research Foundation (grant number 2007-080).
| References | ▴Top |
- Holick MF. Vitamin D deficiency. N Engl J Med. 2007;357(3):266-281.
doi pubmed - Lee JH, O'Keefe JH, Bell D, Hensrud DD, Holick MF. Vitamin D deficiency an important, common, and easily treatable cardiovascular risk factor? J Am Coll Cardiol. 2008;52(24):1949-1956.
doi pubmed - Holick MF. High prevalence of vitamin D inadequacy and implications for health. Mayo Clin Proc. 2006;81(3):353-373.
doi pubmed - Ford ES. Risks for all-cause mortality, cardiovascular disease, and diabetes associated with the metabolic syndrome: a summary of the evidence. Diabetes Care. 2005;28(7):1769-1778.
doi pubmed - Gannage-Yared MH, Chedid R, Khalife S, Azzi E, Zoghbi F, Halaby G. Vitamin D in relation to metabolic risk factors, insulin sensitivity and adiponectin in a young Middle-Eastern population. Eur J Endocrinol. 2009;160(6):965-971.
doi pubmed - Ford ES, Ajani UA, McGuire LC, Liu S. Concentrations of serum vitamin D and the metabolic syndrome among U.S. adults. Diabetes Care. 2005;28(5):1228-1230.
doi pubmed - Lu L, Yu Z, Pan A, Hu FB, Franco OH, Li H, Li X, et al. Plasma 25-hydroxyvitamin D concentration and metabolic syndrome among middle-aged and elderly Chinese individuals. Diabetes Care. 2009;32(7):1278-1283.
doi pubmed - Young KA, Engelman CD, Langefeld CD, Hairston KG, Haffner SM, Bryer-Ash M, Norris JM. Association of plasma vitamin D levels with adiposity in Hispanic and African Americans. J Clin Endocrinol Metab. 2009;94(9):3306-3313.
doi pubmed - Konradsen S, Ag H, Lindberg F, Hexeberg S, Jorde R. Serum 1,25-dihydroxy vitamin D is inversely associated with body mass index. Eur J Nutr. 2008;47(2):87-91.
doi pubmed - Wortsman J, Matsuoka LY, Chen TC, Lu Z, Holick MF. Decreased bioavailability of vitamin D in obesity. Am J Clin Nutr. 2000;72(3):690-693.
pubmed - Rodriguez-Rodriguez E, Navia B, Lopez-Sobaler AM, Ortega RM. Vitamin D in overweight/obese women and its relationship with dietetic and anthropometric variables. Obesity (Silver Spring). 2009;17(4):778-782.
doi pubmed - Parikh SJ, Edelman M, Uwaifo GI, Freedman RJ, Semega-Janneh M, Reynolds J, Yanovski JA. The relationship between obesity and serum 1,25-dihydroxy vitamin D concentrations in healthy adults. J Clin Endocrinol Metab. 2004;89(3):1196-1199.
doi pubmed - The IDF consensus worldwide definition of the metabolic syndrome [http://www.idf.org/webdata/docs/MetS_def_update2006.pdf].
- Matthews DR, Hosker JP, Rudenski AS, Naylor BA, Treacher DF, Turner RC. Homeostasis model assessment: insulin resistance and beta-cell function from fasting plasma glucose and insulin concentrations in man. Diabetologia. 1985;28(7):412-419.
doi pubmed - Vaccaro O, Masulli M, Cuomo V, Rivellese AA, Uusitupa M, Vessby B, Hermansen K, et al. Comparative evaluation of simple indices of insulin resistance. Metabolism. 2004;53(12):1522-1526.
doi pubmed - Botella-Carretero JI, Alvarez-Blasco F, Villafruela JJ, Balsa JA, Vazquez C, Escobar-Morreale HF. Vitamin D deficiency is associated with the metabolic syndrome in morbid obesity. Clin Nutr. 2007;26(5):573-580.
doi pubmed - Hekimsoy Z, Dinc G, Kafesciler S, Onur E, Guvenc Y, Pala T, Guclu F, et al. Vitamin D status among adults in the Aegean region of Turkey. BMC Public Health. 2010;10:782.
doi pubmed - Erkal MZ, Wilde J, Bilgin Y, Akinci A, Demir E, Bodeker RH, Mann M, et al. High prevalence of vitamin D deficiency, secondary hyperparathyroidism and generalized bone pain in Turkish immigrants in Germany: identification of risk factors. Osteoporos Int. 2006;17(8):1133-1140.
doi pubmed - Alagol F, Shihadeh Y, Boztepe H, Tanakol R, Yarman S, Azizlerli H, Sandalci O. Sunlight exposure and vitamin D deficiency in Turkish women. J Endocrinol Invest. 2000;23(3):173-177.
pubmed - Arunabh S, Pollack S, Yeh J, Aloia JF. Body fat content and 25-hydroxyvitamin D levels in healthy women. J Clin Endocrinol Metab. 2003;88(1):157-161.
doi pubmed - Bell NH, Epstein S, Greene A, Shary J, Oexmann MJ, Shaw S. Evidence for alteration of the vitamin D-endocrine system in obese subjects. J Clin Invest. 1985;76(1):370-373.
doi pubmed - Lagunova Z, Porojnicu AC, Lindberg F, Hexeberg S, Moan J. The dependency of vitamin D status on body mass index, gender, age and season. Anticancer Res. 2009;29(9):3713-3720.
pubmed - Florez H, Martinez R, Chacra W, Strickman-Stein N, Levis S. Outdoor exercise reduces the risk of hypovitaminosis D in the obese. J Steroid Biochem Mol Biol. 2007;103(3-5):679-681.
doi pubmed - Kamycheva E, Joakimsen RM, Jorde R. Intakes of calcium and vitamin d predict body mass index in the population of Northern Norway. J Nutr. 2003;133(1):102-106.
pubmed - Rosenstreich SJ, Rich C, Volwiler W. Deposition in and release of vitamin D3 from body fat: evidence for a storage site in the rat. J Clin Invest. 1971;50(3):679-687.
doi pubmed - Blum M, Dolnikowski G, Seyoum E, Harris SS, Booth SL, Peterson J, Saltzman E, et al. Vitamin D(3) in fat tissue. Endocrine. 2008;33(1):90-94.
doi pubmed - Sergeev IN. 1,25-Dihydroxyvitamin D3 induces Ca2+-mediated apoptosis in adipocytes via activation of calpain and caspase-12. Biochem Biophys Res Commun. 2009;384(1):18-21.
doi pubmed - Blumberg JM, Tzameli I, Astapova I, Lam FS, Flier JS, Hollenberg AN. Complex role of the vitamin D receptor and its ligand in adipogenesis in 3T3-L1 cells. J Biol Chem. 2006;281(16):11205-11213.
doi pubmed - Rayalam S, Della-Fera MA, Ambati S, Yang JY, Park HJ, Baile CA. Enhanced effects of 1,25(OH)(2)D(3) plus genistein on adipogenesis and apoptosis in 3T3-L1 adipocytes. Obesity (Silver Spring). 2008;16(3):539-546.
doi pubmed - Forouhi NG, Luan J, Cooper A, Boucher BJ, Wareham NJ. Baseline serum 25-hydroxy vitamin d is predictive of future glycemic status and insulin resistance: the Medical Research Council Ely Prospective Study 1990-2000. Diabetes. 2008;57(10):2619-2625.
doi pubmed - Hypponen E, Boucher BJ, Berry DJ, Power C. 25-hydroxyvitamin D, IGF-1, and metabolic syndrome at 45 years of age: a cross-sectional study in the 1958 British Birth Cohort. Diabetes. 2008;57(2):298-305.
doi pubmed - Reis JP, von Muhlen D, Miller ER, 3rd. Relation of 25-hydroxyvitamin D and parathyroid hormone levels with metabolic syndrome among US adults. Eur J Endocrinol. 2008;159(1):41-48.
doi pubmed - Foss YJ. Vitamin D deficiency is the cause of common obesity. Med Hypotheses. 2009;72(3):314-321.
doi pubmed - Forman JP, Curhan GC, Taylor EN. Plasma 25-hydroxyvitamin D levels and risk of incident hypertension among young women. Hypertension. 2008;52(5):828-832.
doi pubmed - Zittermann A, Frisch S, Berthold HK, Gotting C, Kuhn J, Kleesiek K, Stehle P, et al. Vitamin D supplementation enhances the beneficial effects of weight loss on cardiovascular disease risk markers. Am J Clin Nutr. 2009;89(5):1321-1327.
doi pubmed - Moan J, Lagunova Z, Lindberg FA, Porojnicu AC. Seasonal variation of 1,25-dihydroxyvitamin D and its association with body mass index and age. J Steroid Biochem Mol Biol. 2009;113(3-5):217-221.
doi pubmed
This is an open-access article distributed under the terms of the Creative Commons Attribution License, which permits unrestricted use, distribution, and reproduction in any medium, provided the original work is properly cited.
Journal of Endocrinology and Metabolism is published by Elmer Press Inc.