

| Journal of Endocrinology and Metabolism, ISSN 1923-2861 print, 1923-287X online, Open Access |
| Article copyright, the authors; Journal compilation copyright, J Endocrinol Metab and Elmer Press Inc |
| Journal website https://www.jofem.org |
Original Article
Volume 14, Number 4, August 2024, pages 166-173

Systemic Acetate Is a Potential Biomarker of Metabolic Health and Therapeutic Response: A Pilot Cross-Sectional Investigation
Rani J. Qasema, b, e ![]() , Ahmad Aljadac, d
, Ahmad Aljadac, d
aDepartment of Pharmacology and Pharmacy Practice, College of Pharmacy, Middle East University (MEU), Amman, Jordan
bPrevious: Department of Pharmaceutical Sciences, College of Pharmacy, King Saud Bin Abdulaziz University for Health Sciences (KSAU-HS), King Abdullah International Medical Research Center (KAIMRC) and King Abdulaziz Medical City, National Guard Health Affairs (NGHA), Riyadh, Saudi Arabia
cDepartment of Biochemistry and Molecular Medicine, College of Medicine, Alfaisal University, Riyadh, Saudi Arabia
dPrevious: Department of Basic Sciences, College of Medicine, King Saud Bin Abdulaziz University for Health Sciences (KSAU-HS), King Abdullah International Medical Research Center (KAIMRC) and King Abdulaziz Medical City, National Guard Health Affairs (NGHA), Riyadh, Saudi Arabia
eCorresponding Author: Rani J. Qasem, Department of Pharmacology and Pharmacy Practice, College of Pharmacy, Middle East University (MEU), Amman 11831, Jordan
Manuscript submitted March 31, 2024, accepted July 10, 2024, published online July 30, 2024
Short title: Systemic Acetate, an Index of Metabolic Health
doi: https://doi.org/10.14740/jem943
| Abstract | ▴Top |
Background: The negative metabolic effects of persisting obesity are progressive in nature and at one point predispose to the development of type II diabetes. Systemic levels of acetate reportedly fluctuate with the development of the obese state, but it has been controversial whether the levels increase or decrease and a paucity of information exist on the levels of the molecular anion in the obese diabetic state, and also after treatment. In this pilot cross-sectional investigation, the objective was to determine evidence of longitudinal changes in systemic acetate with the progression of metabolic disease from the lean to the obese and diabetic states and whether the changes are reversed with treatment.
Methods: A cross-sectional analysis was performed on a cohort of male subjects who were then categorized to either the lean, obese, untreated obese diabetic states or obese diabetic state treated with a therapeutic regimen comprised primarily of metformin. Fasting serum acetate was measured in the subjects and reported along with other common metabolic parameters.
Results: Compared to the lean group (67 ± 37 µM), the average level of acetate was elevated in the obese group (151 ± 81 µM), and significantly more in the untreated obese diabetic group (365 ± 111 µM; diabetic vs. lean, P value < 0.001; diabetic vs. obese, P value < 0.01). The treated obese diabetic patients showed significantly reduced concentrations relative to the untreated (172 ± 163 µM; treated vs. untreated, P value < 0.01), and their average level was not different from the lean and obese groups. Acetate levels in the pooled groups were positively associated with fasting glucose concentrations and HbA1c levels (P value = 0.02 and 0.014, respectively), but not with the body mass index (BMI) of the subjects.
Conclusions: These results are indicative of progressive increases in systemic acetate with metabolic transitioning from the lean into the obese and diabetic states, and which reverse course with treatment. These findings are limited by the small sample size, but agree with several contemporary reports, and together help establish the levels of systemic acetate as a biochemical index to longitudinally evaluate whole body metabolism and energy homeostasis, detect pathogenic transitions, and monitor therapeutic effectiveness.
Keywords: Acetate; Short chain fatty acids; Metformin; Obesity; Type 2 diabetes; Biomarkers
| Introduction | ▴Top |
Obesity is a metabolic condition that evolves under a sustained state of positive energy balance [1]. The negative metabolic effects of persisting obesity are longitudinal in nature and can predispose to type 2 diabetes. Acetate is a short chain fatty acid (SCFA) that has been historically established as a product of endogenous metabolism and a source of oxidizable carbon, contributing 6-7% of energy expenditure in the basal state. This perception changed recently over reports describing important roles for the molecule in regulating whole body metabolism and energy homeostasis. Acetate can influence a range of metabolic pathways by signaling through specific G-protein coupled receptors (GPR) and is also converted via acyl-CoA short chain synthetases (ACCS) into acetyl CoA which then regulates protein expression and activity through acetylation reactions [2-4]. In the context of obesity and diabetes, acetate signaling through these pathways can curb inflammation, alleviate oxidative stress, improve glucose homeostasis and insulin sensitivity, enhance satiety and improve body weight control [4]. Generally, the scientific literature has been deficient in reports measuring the levels of systemic acetate with the progression of obesity and after transition into the diabetic state and also following treatment. There is also a notable inconsistency associating systemic levels with various metabolic indices of obesity and diabetes. For example, systemic acetate negatively correlated with visceral adiposity, fasting insulin and also insulin levels following an oral glucose tolerance test in a study enrolling 18 females [5]. A negative correlation with visceral adiposity was also reported in a cohort of 948 female participants [6], and with indices of insulin resistance in 34 morbidly obese subjects (28 women and six men) [7]. Moreover, the benefits of intermittent fasting on metabolic syndrome patients that included reducing their BMI, systolic blood pressure and requirement for antihypertensive medications, all occurred in parallel with its encouragement of an intestinal microbial population that increased systemic release of acetate [8]. Collectively, it is concluded from these studies that fasting systemic acetate levels fall in the obese state and its replenishment through an exogenous source-like supplements of vinegar, should benefit patients. However, contrary to the forgoing findings, other studies reported increased intestinal acetogenesis and systemic acetate levels in the obese state and associated high systemic levels of the molecular anion with higher BMI values, and increased visceral and subcutaneous fat accumulation and hepatic de novo lipogenesis [9, 10]. These findings have been in agreement with animal studies that have consistently associated the systemic supply of acetate with the development of obesity and type 2 diabetes [11]. In the present study, a cross-sectional analysis of serum acetate levels was performed in a group of lean subjects and subjects representing various stages of metabolic disease, i.e. persisting obesity and untreated obesity complicated with type 2 diabetes. Because metformin is the most common treatment for diabetic patients, the analysis also involved a group of obese diabetics treated with a regimen in which metformin was the primary constituent. Our objective was to determine whether these metabolic stages representing the known chronological order of metabolic deterioration that leads to the development of type 2 diabetes and its subsequent treatment were marked by unique changes in systemic acetate levels that can be used to facilitate the clinical monitoring of disease progression and therapeutic response.
| Material and Methods | ▴Top |
Study subjects and serum acetate analysis
The serum samples used in this report were collected from a previously held cross-sectional investigation at King Abdulaziz Medical City (KAMC). The number of subjects that suited this investigation was 30, and they were all adult males and categorized to one of the following four groups: lean (n = 7), obese (n = 6), previously untreated obese diabetic (n = 9), and obese diabetic treated primarily with metformin at an average rate of 1,350 mg per day (range from 100 to 2,000 mg per day) (n = 8). Categorization of the subjects was based upon the BMI value as established by the World Health Organization (WHO) and HbA1c index (Table 1). The blood samples were withdrawn following an 8 to 12 h fast and serum separated and frozen at -80 °C. A sufficient volume for quantifying acetate was forwarded with the clinical features of the subjects through the College of Medicine of King Saud Bin Abdulaziz University for Health Sciences (KSAU-HS). Acetate was quantified using a colorimetric assay kit (Sigma Aldrich, catalog number MAK086) following the manufacturer’s instructions. The assay involves enzymatic reactions that are coupled to produce a colorimetric product in amounts that are proportionate to the levels of acetate in serum. The assay was validated in house and produced a linear range between 0.2 and 20 nmol of acetate per well (corresponding to 10 to 1,000 µM) and with an intraday and interday coefficient of variation that was less than 15%. For each sample, a blank reaction was performed to correct for background levels of ATP and NADH by omitting the enzymatic mix from the reaction well and replacing its volume by assay buffer.
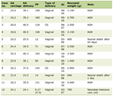 Click to view | Table 1. Descriptive and Clinical Features of the Study Groups |
This study has been approved by the Ethics Committee of King Abdullah International Medical Research Center (KAIMRC) on February 17, 2015, approval number IRBC/101/15 and on November 22, 2015, approval number IRBC/760/15. All procedures involving human subjects demanded informed consent and followed the ethical standards of the institution and national research committees.
Statistical analysis
All data are presented as mean ± standard deviation (SD). Statistical analysis was performed with SigmaStat software, version 3.5. All data were evaluated such that they passed the normality and equal variance tests prior to statistical analysis. The individual data points in each group were evaluated for possible outliers using the Dixon’s test, which is most useful for small sample sizes. Differences between the groups were tested using one-way analysis of variance (ANOVA) followed by the Bonferroni post-hoc pairwise comparisons. Linear regression was performed on the pooled groups to evaluate the association between systemic acetate and various clinical features. A P value < 0.05 was considered statistically significant.
| Results | ▴Top |
The results of the statistical analyses for the clinical features of the subjects in the different groups have been reflective through the age, BMI, fasting glucose, HbA1c and triglyceride levels, the metabolic states typical of the lean, obese and untreated obese diabetic as well as the treated diabetic state (Table 1). The average fasting levels for systemic acetate in the four groups are shown in Figure 1. Compared to the lean group, the average was elevated in the obese group, although this elevation was not statistically significant, and an additional elevation was detected in the previously untreated obese diabetic group, which was statistically significant relative to both, the lean and obese groups (untreated obese diabetic group vs. lean group, P value < 0.001; untreated obese diabetic group vs. obese group, P value < 0.01). The average in the obese diabetic group treated with metformin was significantly lower in comparison to the untreated obese diabetic group (P value < 0.01), and the level was not significantly different from the average levels in both the lean and obese groups. Linear regression analysis on the pooled groups revealed a statistically significant but weak positive relationship for systemic acetate with fasting glucose concentrations and HbA1c levels (Fig. 2a, b). On the other hand, the systemic levels of acetate did not associate with the BMI values in the pooled groups (P = 0.792, Fig. 2c), and even when the metformin-treated obese diabetic group was excluded from the pooled analysis based on the assumption that treatment with metformin can potentially confound and weaken a possible association between the two variables, there was still no association (P = 0.313, Fig. 2d).
 Click for large image | Figure 1. Fasting serum acetate concentration in a group of lean subjects (95% CI: 33.1 - 101.7), obese subjects (95% CI: 66.3 - 236.5), untreated obese diabetic subjects (95% CI: 279.6 - 450.1), and obese diabetic subjects treated with metformin as the primary component of the therapeutic regimen (95% CI: 35.4 - 308.5). A scatter of the individual data points comprising each group is shown. *Significantly different from the lean group (untreated obese diabetic vs. lean, P value < 0.001). #Significantly different from the obese group (untreated obese diabetic vs. obese, P value < 0.01). †Significantly different from the metformin treated diabetic group (untreated obese diabetic vs. obese diabetic treated with metformin, P value < 0.01). Details of the statistical results are described in the “Results” section. Sample size n = 6 - 9 per group. CI: confidence interval. |
 Click for large image | Figure 2. Linear regression fit (solid black line), 95% confidence interval (blue lines) and prediction line (red lines) for fasting serum acetate concentrations (µM) with fasting glucose concentrations (mM) (a), HbA1c levels (mmol/mol) (b), and BMI with (c) and without (d) the metformin treated obese diabetic group. The individual data points comprising the four groups are shown in different colors. There was a statistically significant positive relationship for serum acetate with fasting glucose concentrations and HbA1c levels (P = 0.02 and 0.014, respectively) that can be described by the linear equations (Acetate (µM)) = 72.457 + (16.621 × (glcuose (mM))), with an r = 0.422 and an R2 = 0.178, and log(Acetate (µM)) = 72.457 + (16.621 × log(HbA1c (mmol/mol))), with an r = 0.444 and an R2 = 0.168. The unit for HbA1c is in mmoles of glycated hemoglobin for every mole of hemoglobin. |
| Discussion | ▴Top |
The results of this study suggest that the systemic concentration of acetate can potentially reflect the stage of metabolic disease and also the effectiveness of treatments in a manner that can be similar to the methods of measuring fasting glucose concentrations and HbA1c levels. The increase in circulating acetate found with the development of the obese and diabetic states either facilitates metabolic and physiological transitioning from the lean into the obese and subsequently diabetic state or opposes them in an effort to reestablish metabolic and energy homeostasis. Literature evidence supportive of either scenario exists, but whichever the case maybe, the increase in circulatory acetate seemingly is a manifestation of metabolic transition into the obese and diabetic states. The systemic concentration of acetate is governed by the rate of its supply and clearance. Systemic supply has three sources: endogenous production in tissues through β-oxidation of fatty acids and deacetylation reactions, from microbial fermentation of indigestible fibers in the gut, and through dietary consumption. Generally, endogenous production follows a steady pace and without exogenously consumed free acetate, the microbially generated acetate adds on top of the amounts produced endogenously [2, 3]. On the other hand, systemic clearance occurs via metabolic conversion into acetyl CoA which is oxidized for the most part, or used in lipid synthesis and protein acetylation [3]. The increase in systemic concentrations in the obese and diabetic states can arise from increased supply, decreased clearance or both.
On the possibility of increased systemic supply, studies indicate increased intestinal acetogenesis in the obese state. This has been attributed to an increasing predominance of Bacteroidetes and Actinobacteria species and higher ratio of Firmicutes to Bacteroidetes. Studies have shown that this microbial composition produced more acetate from indigestible carbohydrates and positively correlated with visceral and subcutaneous adiposity, BMI, and hepatic de novo lipogenesis [9, 10]. It also exacerbated weight gain when fecal samples were inoculated into germ-free mice fed an obesogenic diet [12]. So it seems that the microbial footprint of the intestines can encourage weight gain and the progression of obesity into diabetes indirectly through steady supplies of acetate, which can account up to 10% of the overall energy consumed in a western diet and up to 85% of circulating acetate according to investigations [9]. It is important to note that human studies directly associating acetate consumption with the development of obesity are generally lacking, but acetate consumption induced obesity in mice. Studies have indicated that the molecular anion acts centrally to increase parasympathetic outflow, which encouraged insulin and ghrelin secretions, triglyceride synthesis and hepatic gluconeogenesis. These effects decreased energy expenditure, facilitated the development of diet-induced obesity and predisposed the mice to type 2 diabetes when fed an obesiogenic diet [11]. In an interesting alternative perspective, it is conceivable that the compositional shift in the intestinal microflora and parallel increase in acetate production during the development of the obese and then diabetic states, represents in its nature a symbiotic response that intends to oppose progression of the obese state and deterioration in insulin sensitivity in an attempt to reestablish metabolic and energy homeostasis. However, it seems that this response gradually diminishes in strength if a positive energy balance is sustained over a prolonged period of time, with some investigators associating it with peripheral resistance to acetate signaling, which then forces acetate to increasingly adopt the classic role of a carbon source instead, that aggravates the obese state and insulin resistance by encouraging weight gain, especially when consumed in the form of vinegar supplementations. In line with this theme, several studies have shown that the metabolic benefits of acetate in preventing weight gain and maintaining insulin sensitivity are better observed in the lean than in obese individuals, and their findings have been largely responsible for the recent motive among the public to consume vinegar [4, 9, 13].
The increase in systemic acetate can also arise from increased tissue production. In the obese and diabetic states, the flux of energy substrates for cellular respiration gradually shifts from glucose to fatty acids, which is supported by increased expression in mitochondrial marker proteins and capacity for β-oxidation of fatty acids along with a reciprocal decrease in glucose metabolism and activity of the citric acid cycle [14, 15]. The increasing resistance to insulin and increased adipocyte lipolysis and release of free fatty acids (FFAs) also favor this shift in metabolic fuel [16]. In the liver through its central role in metabolism [3, 17], the increased influx and oxidation of FFAs generates acetyl CoA at a rate than can exceed its conversion into other metabolites [2]. This forces greater amounts of acetyl CoA to break into acetate that is dispersed into the circulation. The increased systemic release of acetate can then encourage - in a feed forward mechanism - the uptake and oxidation of FFAs in peripheral tissues through activation of GPR41 and GPR43 receptors, which have been shown to mediate the effects of acetate and are expressed in metabolically active tissues [4, 18]. In line with this theme, acetate levels were reportedly higher in diabetic vs. nondiabetic subjects and its intravenous infusion induced a rapid drop in plasma FFAs followed by a slow rebound in the diabetic group [19], suggesting the increase in systemic acetate programs tissues for increased uptake and oxidation of FFAs. In this way, acetate helps limit ectopic accumulation of lipids and toxic lipid intermediates, increases resting and total energy expenditures and maintains whole body insulin sensitivity during prolonged periods of positive energy balance. These regulatory functions of acetate operate prior to the point when oxidative stress and mitochondrial overload and damage prevail (Fig. 3) [14, 15, 17]. Supportive of this notion, an increase in resting and total energy expenditures were reported in the obese state [1], and acetate infusion into the distal colon in obese men increased systemic acetate concentration, fasting fatty acid oxidation, energy expenditure and peptide YY (PYY) levels [20]. Finally, the increase in systemic acetate in the obese and diabetic states can also arise from decreased tissue uptake and metabolic conversion. In an investigation of acetate kinetics, acetate clearance was slower and half-life longer following intravenous infusion into type 2 diabetics [21], which corroborates the point suggesting a state of peripheral acetate resistance that can arise from decreased expression or activity of acetyl CoA synthetase-2 [9].
 Click for large image | Figure 3. A schematic representation of the factors affecting systemic acetate during metabolic transition to the obese and diabetic states and following metformin treatment. The number of arrows reflects substrate flux in metabolically active tissues and abundance of a product, and their thickness the intensity of a biochemical pathway. (a) In the lean state, glucose is metabolized via glycolysis and the critic acid cycle. The extra carbons are shuttled to the cytoplasm and converted into triglycerides. (b) In the obese state, systemic resistance to insulin and higher adipocyte lipolysis rates allow tissues to take relatively greater amounts of FFAs for mitochondrial β-oxidation and in the process; greater amounts of acetate are formed. Some acetate is contributed through increased microbial fermentation in the intestines. (c) Deterioration of the state in (b) and hyperglycemia occur. The increased availability of FFAs and mitochondrial β-oxidation increases production of acetate. (d) A possible decrease in systemic acetate due to oxidative stress, mitochondrial damage and excessive intracellular fat accumulation. (e) Metformin improves insulin sensitivity and glucose metabolism and decreases adipocyte lipolysis, systemic FFAs and mitochondrial β-oxidation. It also modulates the intestinal microflora. These effects reduce systemic acetate levels. FFAs: free fatty acids. |
Metformin can reduce systemic release of acetate by improving insulin sensitivity and glucose metabolism. In the adipose tissue, this decreases lipolysis and systemic supply of FFAs. In the liver and other metabolically active tissues, the deceased supply of FFAs decreases mitochondrial β-oxidation and production of acetyl CoA, and the improved glucose metabolism replenishes mitochondrial oxaloacetate which then rejuvenates the citric acid cycle allowing it to attract a sizable portion of acetyl CoA for oxidation. Collectively, these effects reduce tissue production of acetate (Fig. 3) [2, 3]. Also, the possible antibacterial properties of metformin can help re-balance the intestinal microflora to reduce the acetate amounts released through fermentation [22]. This decreases the amount of energy harnessed from food and encourages weight loss [23].
The results of this investigation suggest a linear relationship exists between systemic acetate levels and glucose and HbA1c levels. The prediction models for these relationships are weak and this could be a consequence to the small sample size. Therefore, these models can become more predictive of the relationship between systemic acetate and glucose and HbA1c levels if the sample size was made larger. The weak relationship may also indicate that maybe a curvilinear model is a better predictor or the existence of confounding factors that need control, such as the variation in age and metformin dosage. It is worth noting that unlike the weak relationships with glucose and HbA1c measurements, systemic acetate levels in this small population did not associate with BMI values, which is in agreement with previous studies [5]. The lack of a linear association between the two variables indicates in one perspective changes in the kinetics of acetate with the progression of metabolic disease, and also implies that a nonlinear model can better describe any existing association between the two variables. Overall, the weak relationships reported in this investigation are promising and warrant further investigation.
Conclusions
This study investigated systemic acetate levels in individuals representing different stages along the natural course of metabolic deterioration that leads to the development of diabetes mellitus type 2, and in diabetic patients that are being treated. The results of the study are intriguing and suggest possible longitudinal changes in the production and/or utilization of acetate in the obese and diabetic states. They also indicate that acetate levels potentially respond to treatment, and therefore can be used in monitoring therapeutic response. The findings in this report are preliminary and limited by the small sample size, variation in age and metformin dosage and single gender, so they need confirmation in larger diverse populations. However, it is important to note that individual parts of the results in this report, albeit preliminary, are in agreement with already published literature, so the limitations of this study are partially compensated by its agreement with the results of other studies. Future investigations should consider the confounding effects of age and gender on systemic acetate levels because previous investigations have indicated that advancing age was associated with progressively lower plasma acetate levels, and because systemic acetate levels responded differently to weight loss in the two genders [24, 25]. In addition, it is important to measure systemic acetate levels in individuals representing a continuous spectrum of BMIs. The results of these kinds of investigations can potentially help establish the “acetate index” as a surrogate biochemical measure in blood of whole body metabolism and energy homeostasis, a biomarker for detrimental metabolic transitions and monitor for therapeutic effectiveness.
Acknowledgments
The authors are thankful to King Abdullah International Medical Research Center (KAIMRC) for the approval and funding of this project, and to King AbdulAziz Medical City (KAMC) for facilitating patient enrollment and collection of the blood samples.
Financial Disclosure
The development of an analytical method and the analysis of blood acetate levels were approved and funded to RJQ by King Abdullah International Medical Research Center (KAIMRC), protocol number RC15/060. Enrollment of the study subjects and collection of blood samples was approved by King Abdullah International Medical Research Center (KAIMRC), protocol number RC12/105.
Conflict of Interest
The authors of this investigation have no competing interests.
Informed Consent
Informed consent was obtained from all subjects enrolled in this study.
Author Contributions
RJQ: conception, analysis of the blood samples, plotting and statistical analysis of the data, and wrote the manuscript. AA, planned the clinical study and provided the blood samples. Both authors have read and agreed to the content of this investigation.
Data Availability
The data that support the findings reported in this investigation are available on request from the corresponding author.
Abbreviations
ACCS: acyl-CoA short chain synthetase; BMI: body mass index; GPR: G-protein coupled receptors; FFA: free fatty acid; HbA1c: hemoglobin A1c index; SCFA: short chain fatty acid
| References | ▴Top |
- Carneiro IP, Elliott SA, Siervo M, Padwal R, Bertoli S, Battezzati A, Prado CM. Is obesity associated with altered energy expenditure? Adv Nutr. 2016;7(3):476-487.
doi pubmed pmc - Moffett JR, Puthillathu N, Vengilote R, Jaworski DM, Namboodiri AM. Acetate revisited: a key biomolecule at the nexus of metabolism, epigenetics, and oncogenesis - Part 2: acetate and ACSS2 in health and disease. Front Physiol. 2020;11:580171.
doi pubmed pmc - Moffett JR, Puthillathu N, Vengilote R, Jaworski DM, Namboodiri AM. Acetate revisited: a key biomolecule at the nexus of metabolism, epigenetics and oncogenesis-part 1: Acetyl-CoA, acetogenesis and Acyl-CoA short-chain synthetases. Front Physiol. 2020;11:580167.
doi pubmed pmc - Canfora EE, Blaak EE. Acetate: a diet-derived key metabolite in energy metabolism: good or bad in context of obesity and glucose homeostasis? Curr Opin Clin Nutr Metab Care. 2017;20(6):477-483.
doi pubmed - Layden BT, Yalamanchi SK, Wolever TM, Dunaif A, Lowe WL, Jr. Negative association of acetate with visceral adipose tissue and insulin levels. Diabetes Metab Syndr Obes. 2012;5:49-55.
doi pubmed pmc - Nogal A, Louca P, Zhang X, Wells PM, Steves CJ, Spector TD, Falchi M, et al. Circulating levels of the short-chain fatty acid acetate mediate the effect of the gut microbiome on visceral fat. Front Microbiol. 2021;12:711359.
doi pubmed pmc - Moreno-Navarrete JM, Serino M, Blasco-Baque V, Azalbert V, Barton RH, Cardellini M, Latorre J, et al. Gut microbiota interacts with markers of adipose tissue browning, insulin action and plasma acetate in morbid obesity. Mol Nutr Food Res. 2018;62(3):1700721.
doi pubmed - Maifeld A, Bartolomaeus H, Lober U, Avery EG, Steckhan N, Marko L, Wilck N, et al. Fasting alters the gut microbiome reducing blood pressure and body weight in metabolic syndrome patients. Nat Commun. 2021;12(1):1970.
doi pubmed pmc - Goffredo M, Mass K, Parks EJ, Wagner DA, McClure EA, Graf J, Savoye M, et al. Role of gut microbiota and short chain fatty acids in modulating energy harvest and fat partitioning in youth. J Clin Endocrinol Metab. 2016;101(11):4367-4376.
doi pubmed pmc - Schwiertz A, Taras D, Schafer K, Beijer S, Bos NA, Donus C, Hardt PD. Microbiota and SCFA in lean and overweight healthy subjects. Obesity (Silver Spring). 2010;18(1):190-195.
doi pubmed - Perry RJ, Peng L, Barry NA, Cline GW, Zhang D, Cardone RL, Petersen KF, et al. Acetate mediates a microbiome-brain-beta-cell axis to promote metabolic syndrome. Nature. 2016;534(7606):213-217.
doi pubmed pmc - Goodrich JK, Waters JL, Poole AC, Sutter JL, Koren O, Blekhman R, Beaumont M, et al. Human genetics shape the gut microbiome. Cell. 2014;159(4):789-799.
doi pubmed pmc - Lim J, Henry CJ, Haldar S. Vinegar as a functional ingredient to improve postprandial glycemic control-human intervention findings and molecular mechanisms. Mol Nutr Food Res. 2016;60(8):1837-1849.
doi pubmed - Koves TR, Ussher JR, Noland RC, Slentz D, Mosedale M, Ilkayeva O, Bain J, et al. Mitochondrial overload and incomplete fatty acid oxidation contribute to skeletal muscle insulin resistance. Cell Metab. 2008;7(1):45-56.
doi pubmed - Lopaschuk GD. Fatty acid oxidation and its relation with insulin resistance and associated disorders. Ann Nutr Metab. 2016;68(Suppl 3):15-20.
doi pubmed - Duncan RE, Ahmadian M, Jaworski K, Sarkadi-Nagy E, Sul HS. Regulation of lipolysis in adipocytes. Annu Rev Nutr. 2007;27:79-101.
doi pubmed pmc - Turner N, Cooney GJ, Kraegen EW, Bruce CR. Fatty acid metabolism, energy expenditure and insulin resistance in muscle. J Endocrinol. 2014;220(2):T61-79.
doi pubmed - Liu L, Fu C, Li F. Acetate affects the process of lipid metabolism in rabbit liver, skeletal muscle and adipose tissue. Animals (Basel). 2019;9(10):799.
doi pubmed pmc - Fernandes J, Vogt J, Wolever TM. Intravenous acetate elicits a greater free fatty acid rebound in normal than hyperinsulinaemic humans. Eur J Clin Nutr. 2012;66(9):1029-1034.
doi pubmed pmc - van der Beek CM, Canfora EE, Lenaerts K, Troost FJ, Damink S, Holst JJ, Masclee AAM, et al. Distal, not proximal, colonic acetate infusions promote fat oxidation and improve metabolic markers in overweight/obese men. Clin Sci (Lond). 2016;130(22):2073-2082.
doi pubmed - Akanji AO, Hockaday TD. Acetate tolerance and the kinetics of acetate utilization in diabetic and nondiabetic subjects. Am J Clin Nutr. 1990;51(1):112-118.
doi pubmed - Malik F, Mehdi SF, Ali H, Patel P, Basharat A, Kumar A, Ashok F, et al. Is metformin poised for a second career as an antimicrobial? Diabetes Metab Res Rev. 2018;34(4):e2975.
doi pubmed - Lee A, Morley JE. Metformin decreases food consumption and induces weight loss in subjects with obesity with type II non-insulin-dependent diabetes. Obes Res. 1998;6(1):47-53.
doi pubmed - Skutches CL, Holroyde CP, Myers RN, Paul P, Reichard GA. Plasma acetate turnover and oxidation. J Clin Invest. 1979;64(3):708-713.
doi pubmed pmc - Gonzalez Hernandez MA, Canfora EE, Pasmans K, Astrup A, Saris WHM, Blaak EE. The relationship between circulating acetate and human insulin resistance before and after weight loss in the DiOGenes study. Nutrients. 2020;12(2):339-346.
doi pubmed pmc
This article is distributed under the terms of the Creative Commons Attribution Non-Commercial 4.0 International License, which permits unrestricted non-commercial use, distribution, and reproduction in any medium, provided the original work is properly cited.
Journal of Endocrinology and Metabolism is published by Elmer Press Inc.