| Journal of Endocrinology and Metabolism, ISSN 1923-2861 print, 1923-287X online, Open Access |
| Article copyright, the authors; Journal compilation copyright, J Endocrinol Metab and Elmer Press Inc |
| Journal website https://www.jofem.org |
Original Article
Volume 12, Number 4-5, October 2022, pages 140-145
Obesity Measurement Index Is Associated With Hemoglobin A1c Level in Young Adult Without Diabetes: A Single-Center Cross-Sectional Study
Waode Sarningsa, b, e, Andi Makbul Amana, b, c, Haerani Rasyida, b, Syakib Bakria, b, Himawan Sanusia, b, c, Nu’man As Dauda, b, Andi Alfian Zainuddind
aDepartment of Internal Medicine, Faculty of Medicine, Hasanuddin University, Makassar, Indonesia
bWahidin Sudirohusodo Hospital, Makassar, Indonesia
cSub-division of Endocrinology, Metabolism, and Diabetes, Department of Internal Medicine, Faculty of Medicine, Hasanuddin University, Makassar, Indonesia
dDepartment of Biostatics, Faculty of Public Health, Hasanuddin University, Makassar, Indonesia
eCorresponding Author: Waode Sarnings, Department of Internal Medicine, Faculty of Medicine, Hasanuddin University, Makassar, Indonesia
Manuscript submitted July 6, 2022, accepted July 25, 2022, published online August 22, 2022
Short title: Obesity Measurement Index and HbA1c
doi: https://doi.org/10.14740/jem823
| Abstract | ▴Top |
Background: Obesity is a public health problem in the world, which can lead to several risks of cardiovascular events, such as, diabetes mellitus type 2 and respiratory disorders. This study aimed to analyze the obesity measurements index and hemoglobin A1c (HbA1c) in young adults without diabetes.
Methods: A cross-sectional study was conducted from February to March 2021 at the Hasanuddin University Hospital, Makassar, Indonesia. Ninety-nine subjects were included in this study. Obesity measurement index (body mass index (BMI), waist circumference, body fat percentage) and HbA1c level were measured for each subject. Statistical tests were performed using SPSS 22.0.
Results: There was a significant correlation between BMI and HbA1c (P < 0.001). Also, waist circumference and body fat percentage in women group were significantly correlated with HbA1c (P = 0.002 and 0.045, respectively).
Conclusions: Obesity measurement index is positively correlated with HbA1c levels in young adult without diabetes. So, the obesity measurement index can be used to determine the risk of diabetes mellitus
Keywords: Obesity measurement index; Obesity; HbA1c; Body mass index
| Introduction | ▴Top |
Obesity is defined as excess fat or adipose tissue in the body [1]; and it is influenced by genetic, gender, environmental, socioeconomic, psychological, disease and drug factors [2-5]. Obesity is a major risk factor for diabetes mellitus because obese subjects have insulin resistance, dyslipidemia, increased proinflammatory cytokines, and increased oxidative stress [5-8]. The diagnosis of obesity can be made by various methods of anthropometric measurements of the body that can be used as obesity screening. These methods include measuring body mass index (BMI), waist circumference (WC), hip circumference, upper arm circumference, and the ratio of WC to hip circumference. In addition to anthropometry, body fat percentage can also be measured using bioelectrical impedance analysis (BIA), which are noninvasive, relatively inexpensive, and can be applied in population studies [1].
Hemoglobin A1c (HbA1c) is a chemically glycosylated form of hemoglobin; therefore, an increase in HbA1c levels will give an idea of the average blood glucose level over the last 3 months [9]. The American Diabetes Association (ADA) recommends that HbA1c levels > 6.5% (> 48 mmol/mol) to define type 2 diabetes mellitus, whereas HbA1c levels between 5.7% and 6.4% indicate a high risk of developing diabetes mellitus [10].
Obesity can affect the HbA1c level. Skogberg et al showed that there was a significant relationship between anthropometric measurements and HbA1c [11]. Martins et al [12] found a significant relationship between HbA1c and WC, where HbA1c levels were higher in the obese group. Bower et al showed significant patient scores, who have a high proportion of body fat with HbA1c [13].
We have added patient scores at the end of the introduction. Our research consisted of 99 subjects who were students in specialist programs at the Hasanudin University Hospital. An obesity measurement index consisting of BMI, WC, and body fat percentage was assessed for each subject, which was then interpreted based on World Health Organization (WHO) guidelines. HbA1c was also assessed for each subject and interpreted according to the ADA guidelines; then, it was analyzed between the obesity measurement index and HbA1c. The results of this study are expected to prove that the measurement of the obesity index can describe HbA1c so that it can assess risk and diagnose diabetes early.
| Materials and Methods | ▴Top |
Study design
A single-center cross-sectional observational study was performed at the Hasanuddin University Hospital, Makassar, Indonesia from February to March 2021.
Study population
The subjects of the study were the students of specialist program in the Hasanuddin University Hospital, Makassar. The inclusion criteria were men and women, aged 20 - 40 years, do not have a history of taking corticosteroid drugs for a long time, and willing to be a research sample. Students who had previously been diagnosed with type 1 or type 2 diabetes mellitus based on history and previous medication history, or who were receiving treatment for diabetes mellitus and refused to participate in the study, were excluded from the study.
Data collection
Samples were taken by consecutive sampling. Based on Slovin’s formula, the minimum number of samples is 89 samples. The data collected include primary data consisting of name, date of birth, medical history, weight, height, WC, BMI, and body fat percentage using BIA; and blood sampling was carried out by the Prodia Laboratory, Makassar.
Definition of measurement
According to WHO guidelines, underweight is defined by BMI < 18.5; normal weight is defined by BMI 18.5 - 24.9; preobesity is defined by BMI 25.0 - 29.9; obesity grade I is defined by BMI 30.0 - 34.9; obesity grade II is defined by BMI > 40 [14]. With interpretation of WC results based on WHO, in men, central obesity is defined by a WC measurement of more than 90; and in women, obesity is defined by a WC measurement of more than 80 [15]. BIA was used to measure body fat percentage. With interpretation of body fat percentage results based on WHO, in men, obesity is defined by a body fat percentage of more than 25%; in women, obesity is defined by a body fat percentage measurement of more than 35% [16]. According to ADA guidelines, HbA1c levels are categorized as follows: HbA1c normal is 5.7%, HbA1c prediabetes is 5.7% - 6.4%, and HbA1c diabetes is > 6.5% [10].
Data analysis
Data analysis was performed using SPSS version 22 (SPSS Inc., Chicago, IL, USA). The statistical tests used were Kruskal-Wallis test, Mann-Whitney test, and the Spearman test. The results were considered significant if the P value was < 0.05.
Ethical clearance
This study was conducted in compliance with the ethical standards of the responsible institution on human subjects. This study protocol has been approved by the Health Research Ethics Commission of Faculty of Medicine, Hasanuddin University, following the ethical recommendations with approval letter number: 91/UN4.6.4.5.31/PP36/2021.
| Results | ▴Top |
A total of 99 subjects were included in this research. The basic characteristics are shown in Table 1. The mean WC in men was 97.76 ± 10.03 while in women was 86.87 ± 11.27. The mean BMI were 26.56 ± 4.77. The body fat percentage measured using BIA in men was on average 28.67 ± 5.91, while in women was 38.96 ± 6.15. For all subjects, HbA1c levels ranged from 4.5% to 6.4%.
 Click to view | Table 1. Subject Characteristics |
In Table 2, HbA1c was higher in the group with overweight BMI (P < 0.001), obesity I (P = 0.001), obesity II (P < 0.001) compared to the group with normal BMI. In Table 3, HbA1c was higher in the WC group with central obesity than in the non-central obesity group in women (P = 0.002). In the body fat percentages group with obesity results had a higher HbA1c than the non-obesity group in women (P = 0.045).
 Click to view | Table 2. Relationship Between HbA1c Levels With BMI Measurements |
 Click to view | Table 3. Relationship Between Waist Circumference and Body Fat Percentage and HbA1c in Women and Men Groups |
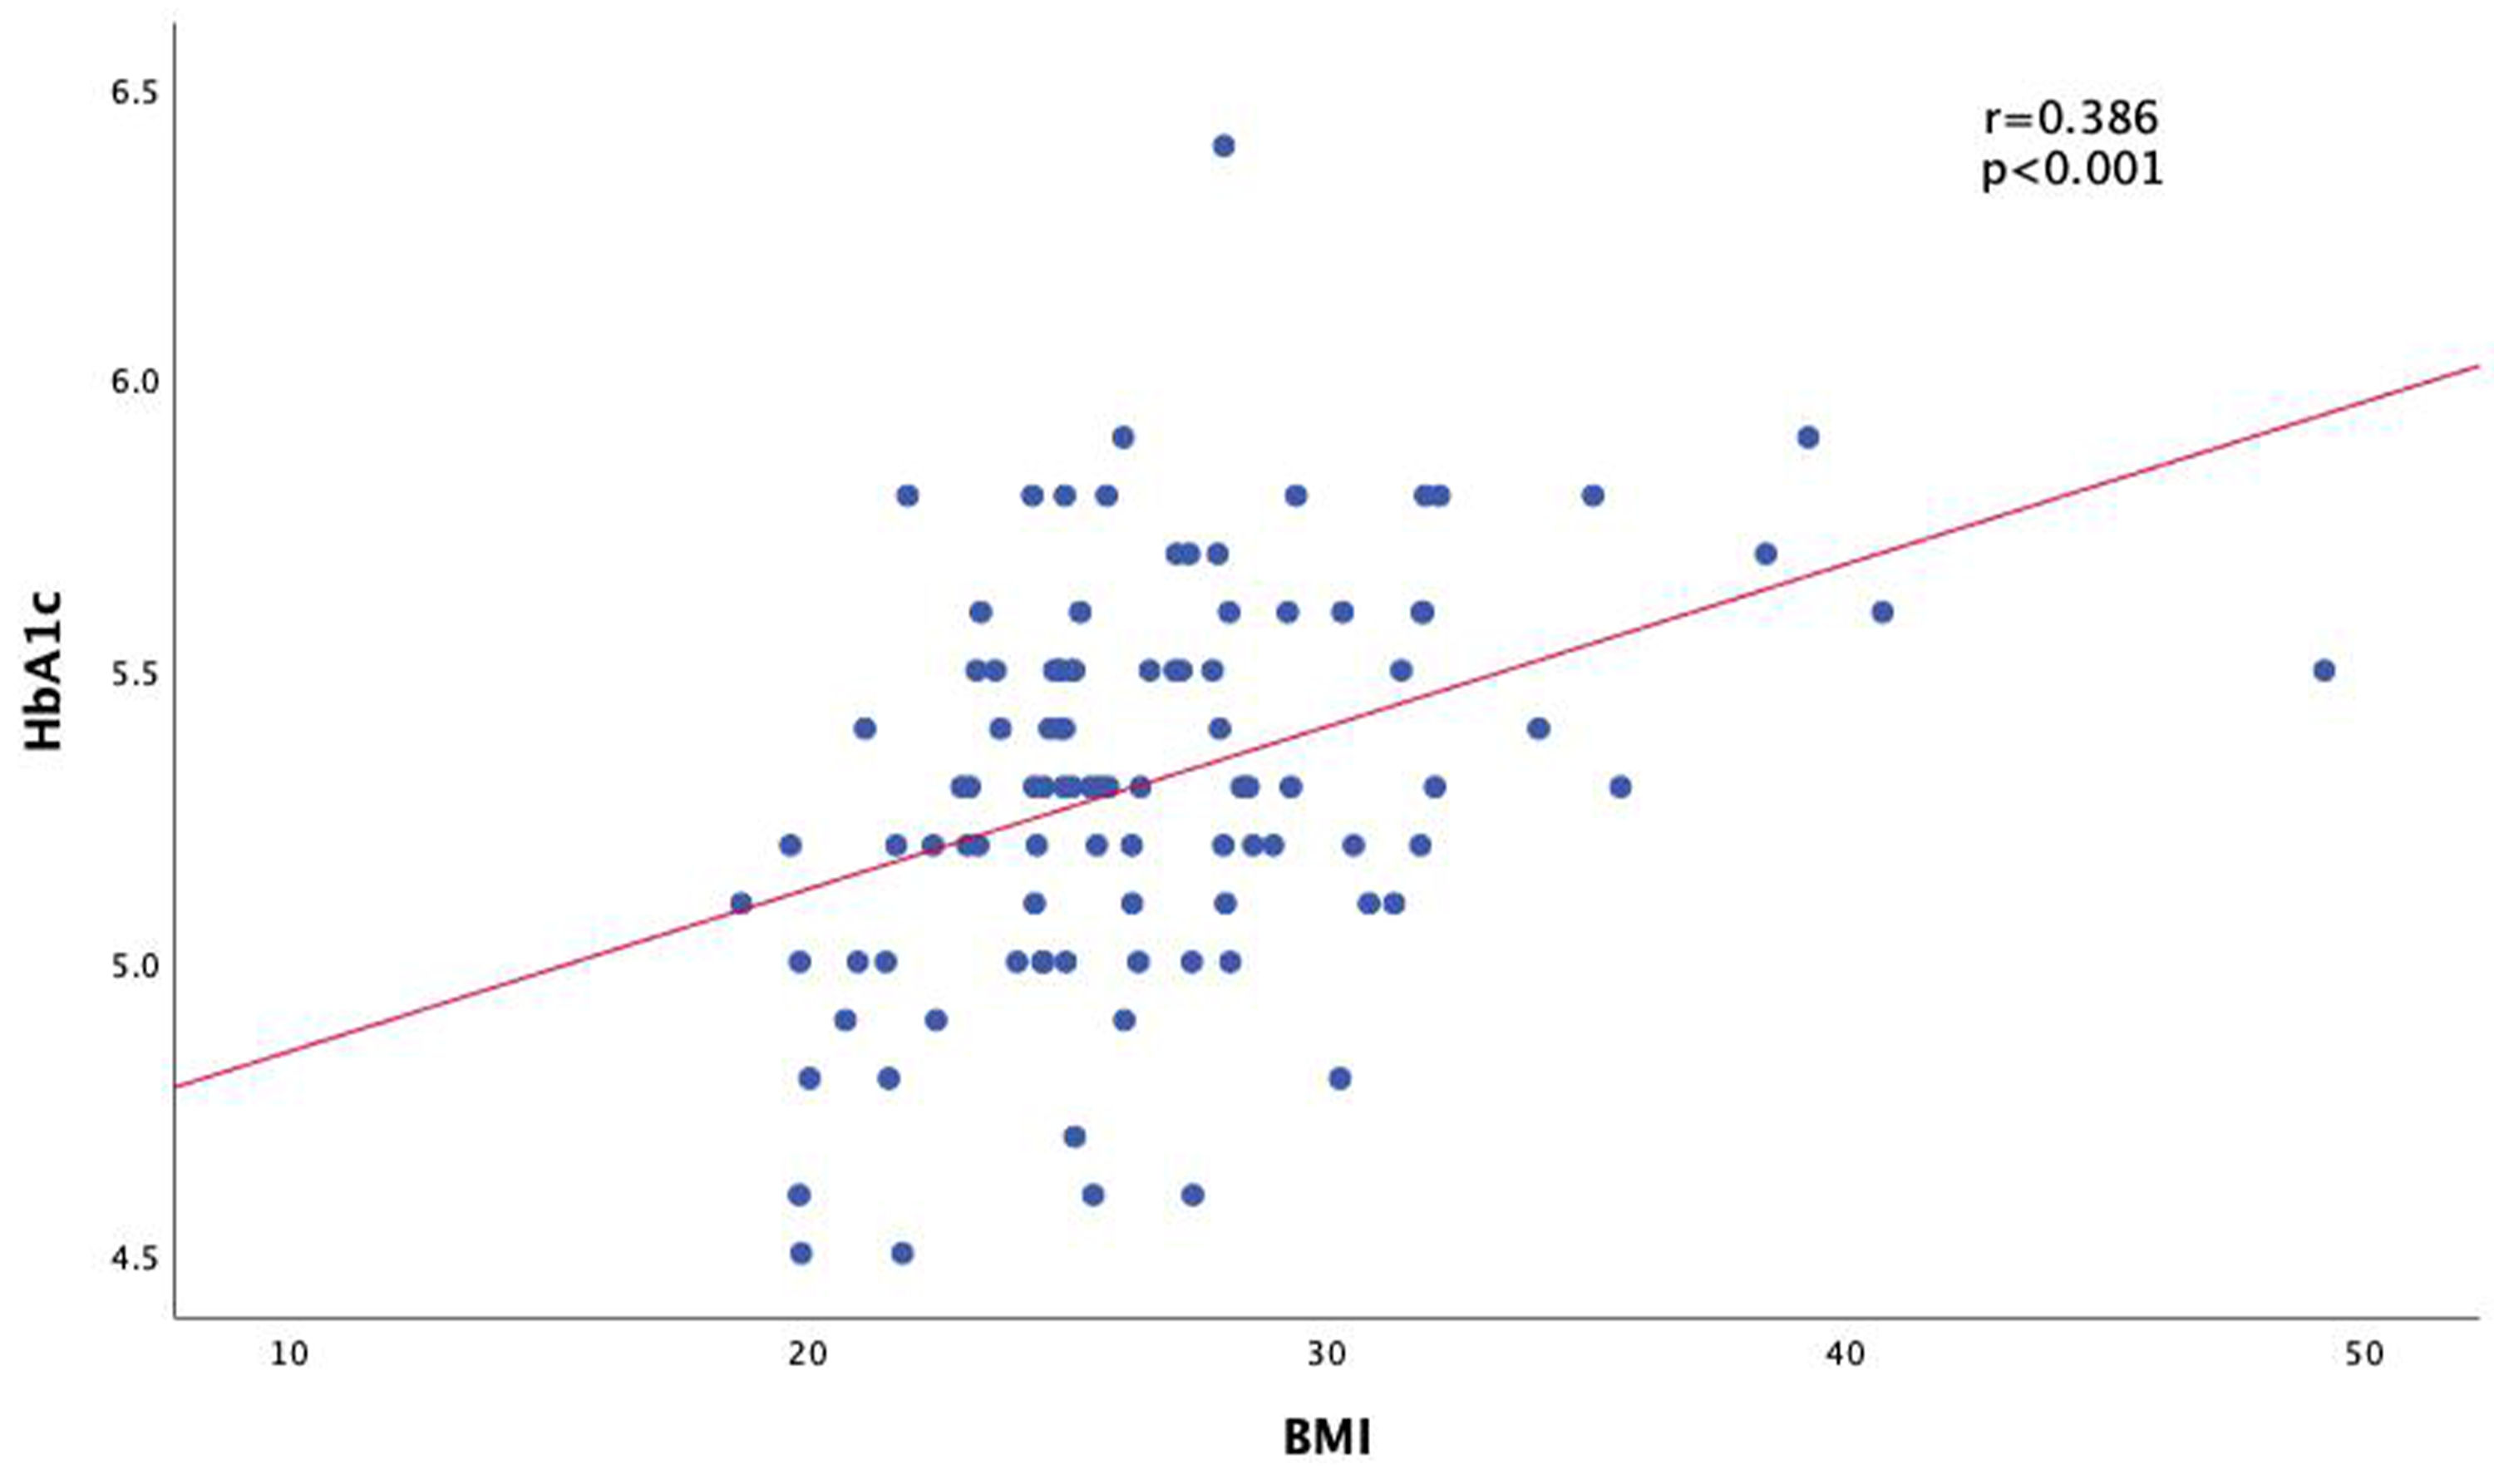
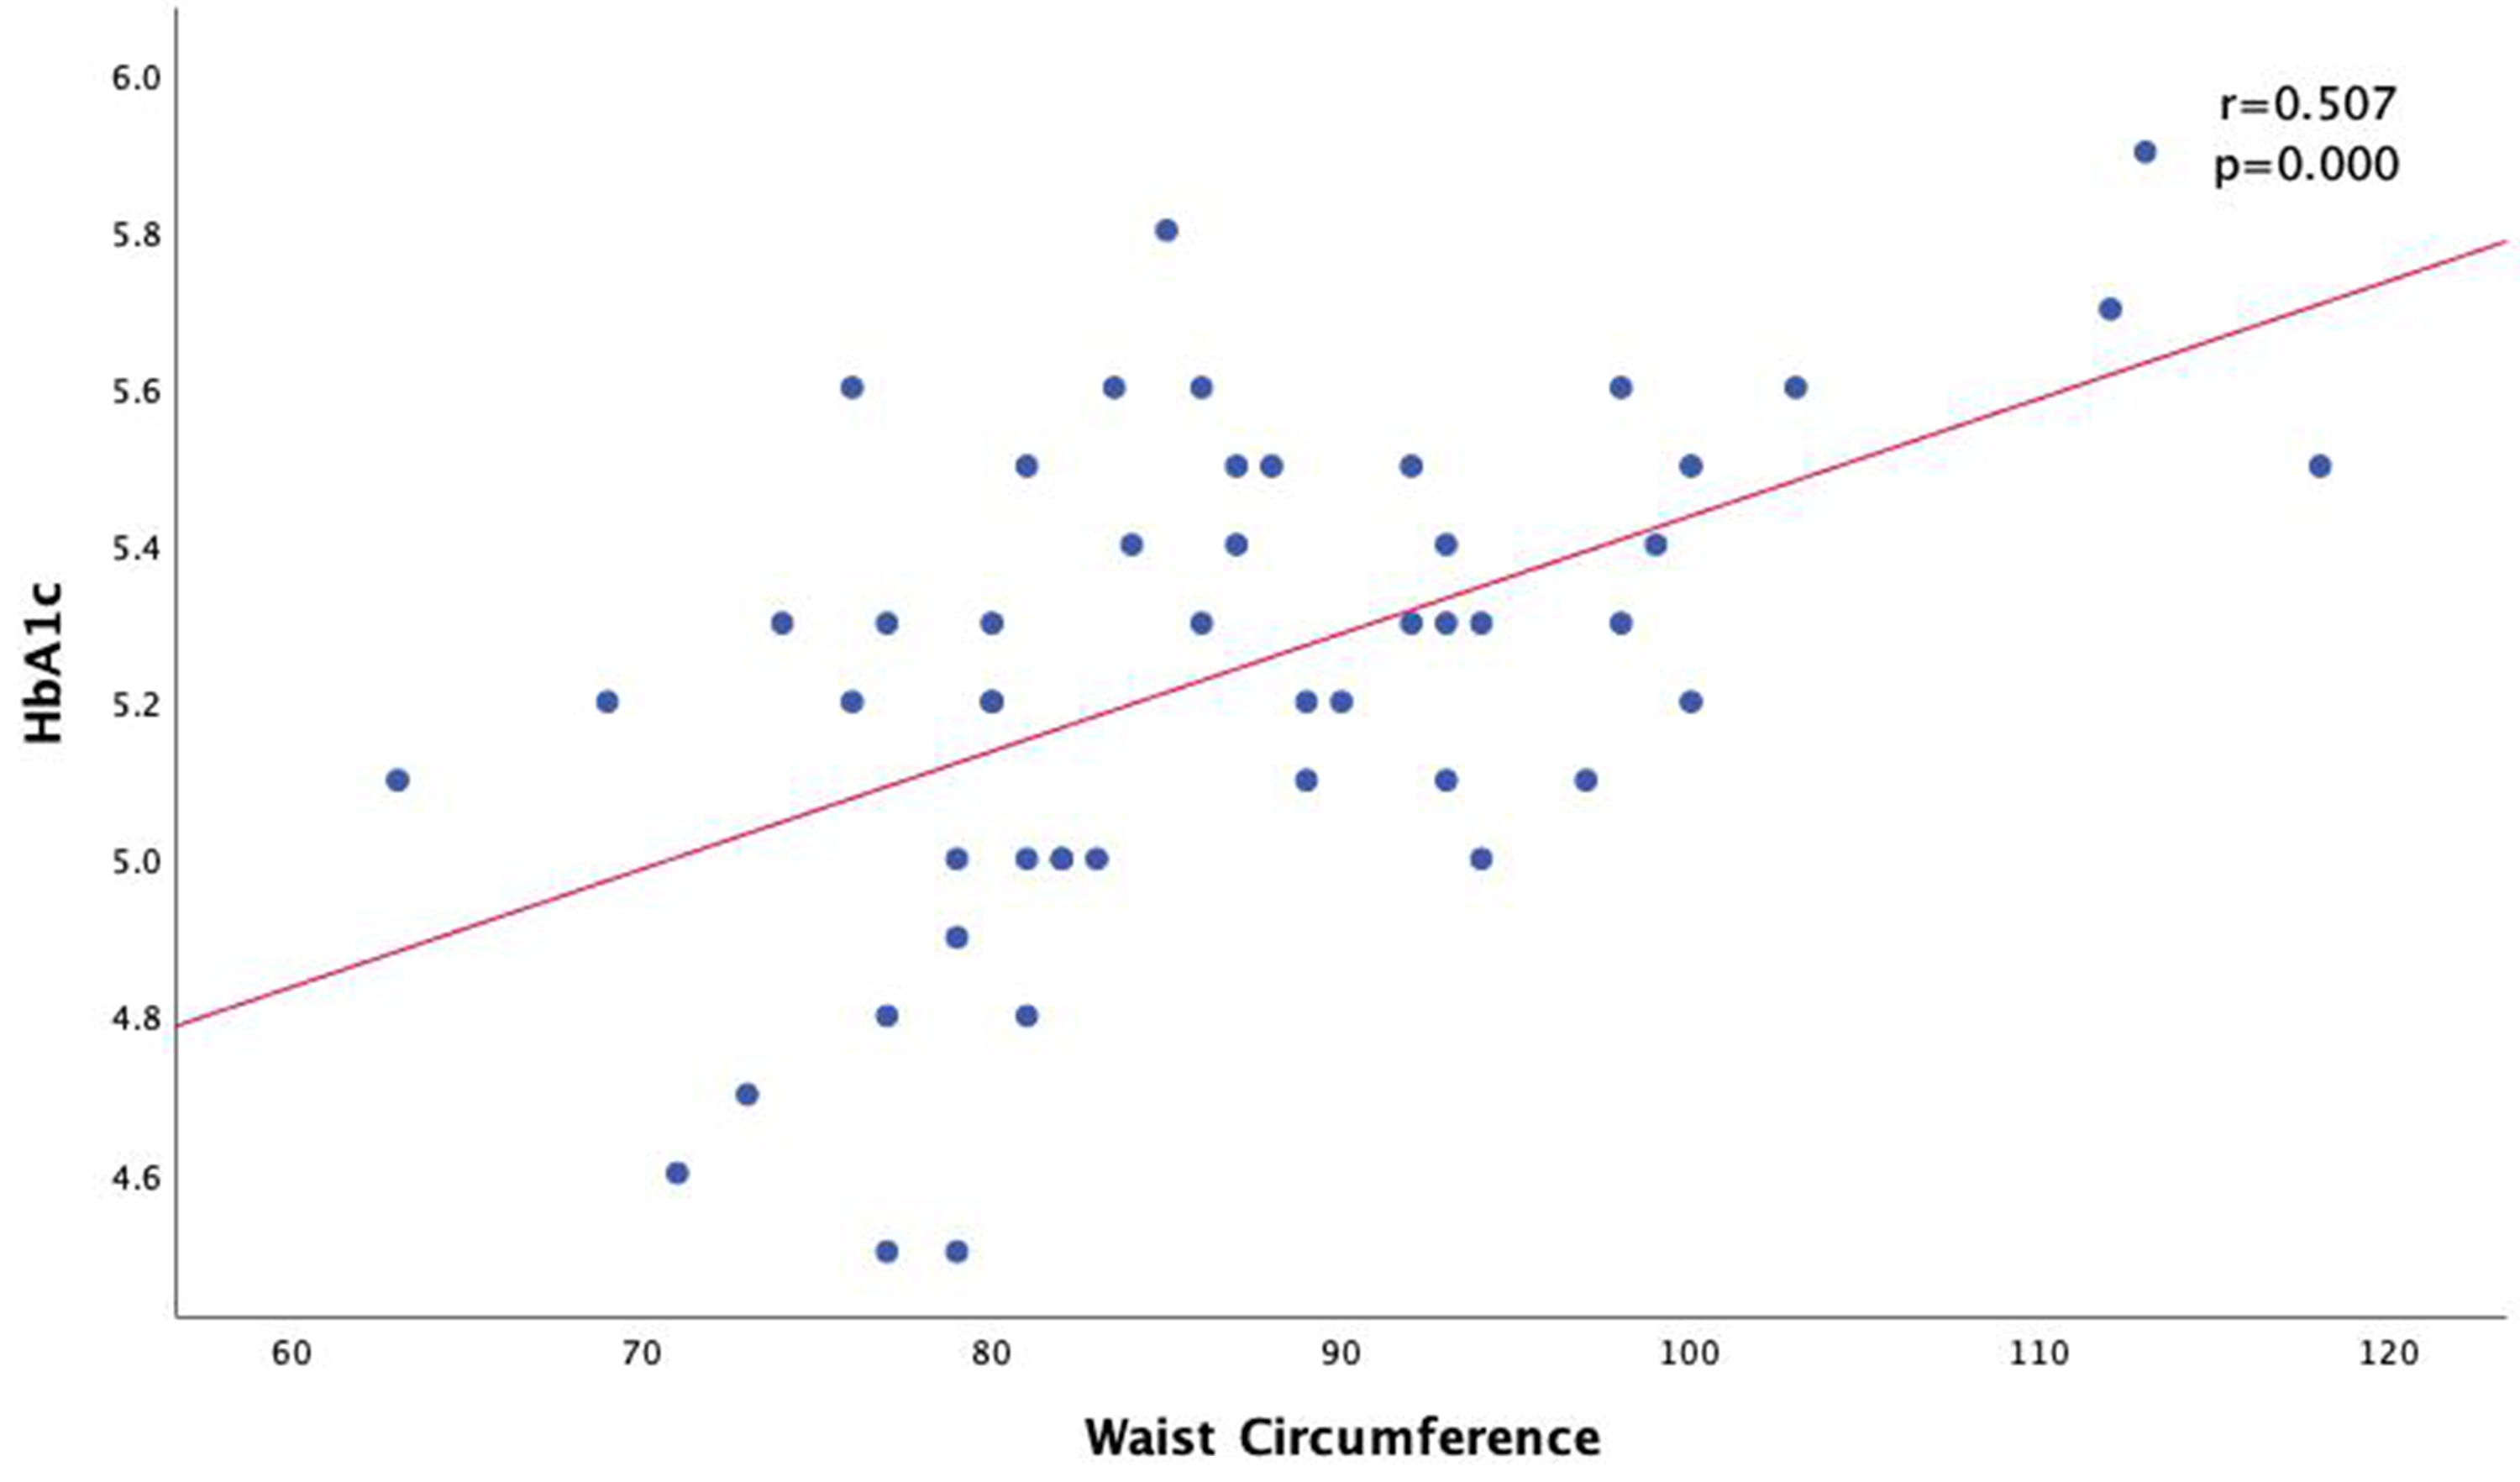
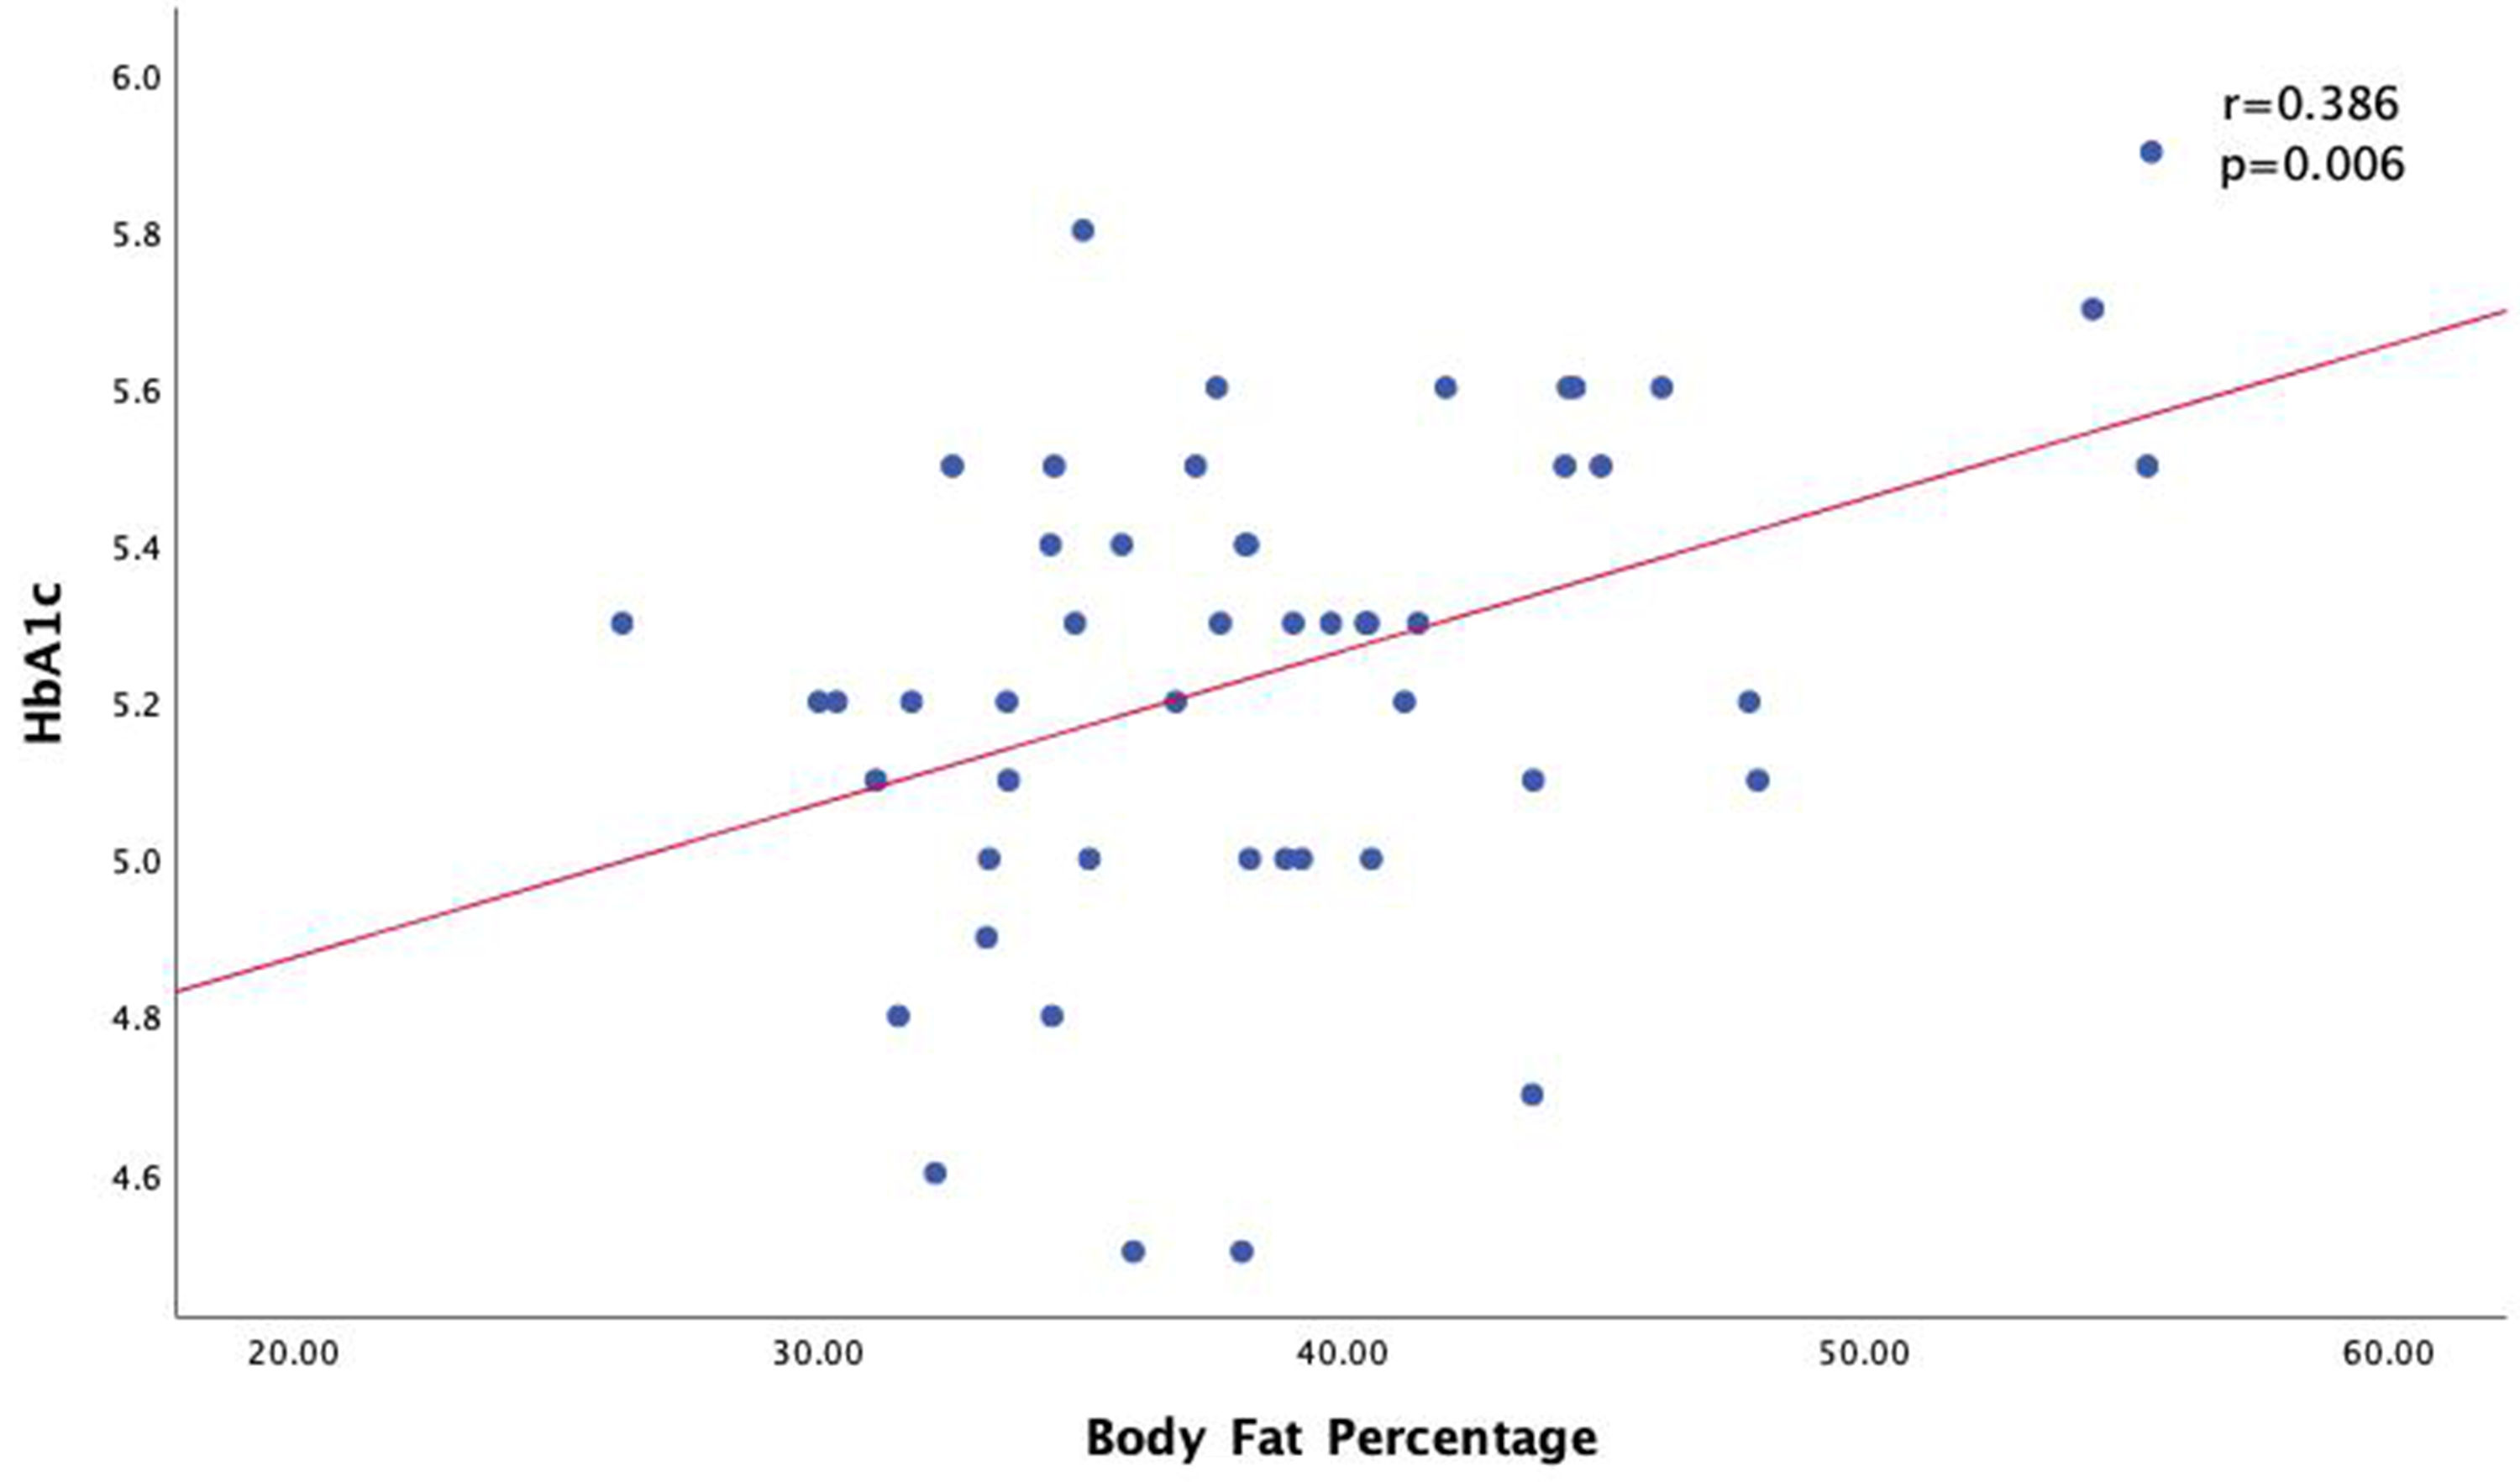
There is a positive correlation with a strong correlation strength between WC in women with HbA1c (P < 0.000) (Fig. 1). There is also a positive relationship between HbA1C levels and BMI (P < 0.000) with a weak correlation strength (Fig. 2). There is a positive correlation with moderate correlation strength between the percentage of body fat using BIA in women with HbA1c levels (P = 0.006) (Fig. 3).
 Click for large image | Figure 1. Correlation of body mass index (BMI) with HbA1c levels. HbA1c: hemoglobin A1c. |
 Click for large image | Figure 2. Correlation of waist circumference with HbA1c levels in women group. HbA1c: hemoglobin A1c. |
 Click for large image | Figure 3. Correlation of body fat percentage with HbA1c levels in women group. HbA1c: hemoglobin A1c. |
| Discussion | ▴Top |
Our study which included 99 subjects, the mean WC of men was greater than women. In line with the study of Csongova et al (2018), the mean WC in men (90.8 ± 13.0) was greater than women (79.9 ± 13.3) [17]. In addition, the mean BMI of women group (25.5 kg/m2) was lower than that of men (27.7 kg/m2). In line with the study of Zhang et al (2013), the mean BMI of women is lower than men, with a mean BMI of 23.1 for women, and 23.3 for men. This happens because women generally pay more attention to their weight, body shape, and diet than men, where women are more likely to go on a diet, vomiting, or exercise for weight loss [18]. The percentage of body fat in the study results was found to be higher in women than men (28.67 ± 5.91 vs. 38.96 ± 6.15). Steven et al (2009) showed men had greater muscle mass, bigger and stronger bones, and reduced leg fat. Women have a more peripheral distribution of fat in early adulthood. The sex differences in body composition are mainly due to the action of steroid sex hormones, which promote dimorphism during pubertal development [19].
Our study also showed a HbA1c level has a positive correlation with obesity measurements, namely WC, BMI, and body fat percentage as measured using BIA. HbA1c levels were significantly higher in the centrally obese group compared to non-central obesity in women. This study is in line with the research conducted by Jekal et al (2010), which showed that women with large WCs had higher HbA1c levels compared to women with normal WCs [12, 20]. This is known because in men, WC is caused by an increase in muscle mass, while in women it is due to fat accumulation. In addition, in women at premenopausal age under the influence of the hormone estrogen, it causes an increase in subcutaneous fat while in men an increase in visceral fat [21].
Our study also showed that there was a significant relationship between HbA1c levels in the obese group compared to the non-obese group based on the measurement of the proportion of body fat in women. In line with the research of Bower et al (2017), there is a significant value in subjects who have a high proportion of body fat with HbA1c. Several factors influenced this research, such as ethnicity, age, and environment [13].
In addition, HbA1c levels increased in line with BMI. In accordance with the research of Babikr et al (2016), there is a significant relationship between HbA1c and BMI. Obesity has a strong relationship with insulin resistance and diabetes [22]. Obesity causes impaired adipose tissue function, inducing impaired secretion of adipokines into the circulation. Excess fat cells in the long term will cause fat cells to become resistant to the antilipolytic effects of insulin and result in an increase in the process of lipolysis and free fatty acids in plasma. Free fatty acids will increase gluconeogenesis resistance and then trigger insulin in the liver and muscles, as well as interfere with insulin secretion and obesity, increase the secretion of interleukin-6 (IL-6) and tumor necrosis factor-α (TNF-α) produced by adipocytes and monocyte derivatives, which leads to more insulin resistance, resulting in high circulating blood glucose and eventually the development of the macrophage condition that we call diabetes mellitus [23, 24].
Conclusions
Obesity measurement index has a positive correlation with HbA1c levels in young adult without diabetes mellitus history. It seems that obesity measurement index can be used as an indicator of the risk of diabetes mellitus, so that it can carry out early prevention.
Acknowledgments
The authors would like to thank all the staffs in Department of Internal Medicine, and Department of Biostatistics, Faculty of Medicine, Hasanuddin University, for providing the facilities and assistance.
Financial Disclosure
None to declare.
Conflict of Interest
The authors declare no conflict of interest.
Informed Consent
Each subject has signed an informed consent for this research.
Author Contributions
WS has designed and performed the study. AMA and HR have carefully supervised this manuscript preparation and writing.
Data Availability
Data supporting the findings of this study are available from the relevant authors upon reasonable request.
| References | ▴Top |
- Haghighatdoost F, Amini M, Feizi A, Iraj B. Are body mass index and waist circumference significant predictors of diabetes and prediabetes risk: Results from a population based cohort study. World J Diabetes. 2017;8(7):365-373.
doi pubmed - Hruby A, Hu FB. The epidemiology of obesity: a big picture. Pharmacoeconomics. 2015;33(7):673-689.
doi pubmed - Kopleman PG, Caterson ID, Dietz WH. Clinical obesity in adults and children. 3rd ed. London, UK: Wiley-Blackwell; 2010.
doi - Wharton S, Raiber L, Serodio KJ, Lee J, Christensen RA. Medications that cause weight gain and alternatives in Canada: a narrative review. Diabetes Metab Syndr Obes. 2018;11:427-438.
doi pubmed - Omer T. The causes of obesity: an in-depth review. Adv Obes Weight Manag Control 2020;10(3):90-94.
doi - Munro IA, Garg ML. Weight loss and metabolic profiles in obese individuals using two different approaches. Food Funct. 2011;2(10):611-616.
doi pubmed - Cerf ME. Beta cell dysfunction and insulin resistance. Front Endocrinol (Lausanne). 2013;4:37.
doi pubmed - Manna P, Jain SK. Obesity, oxidative stress, adipose tissue dysfunction, and the associated health risks: causes and therapeutic strategies. Metab Syndr Relat Disord. 2015;13(10):423-444.
doi pubmed - Karimah HN, Sarihati IGA, Habibah N. Gambaran kadar HbA1c pada pasien diabetes melitus tipe 2 di RSUD wangaya. Meditory: The Journal of Medical Laboratory. 2018;6(2):88-98.
doi - Ikeda M, Shimazawa R. Challenges to hemoglobin A1c as a therapeutic target for type 2 diabetes mellitus. J Gen Fam Med. 2019;20(4):129-138.
doi pubmed - Skogberg N, Laatikainen T, Lilja E, Lundqvist A, Harkanen T, Koponen P. The association between anthropometric measures and glycated haemoglobin (HbA1c) is different in Russian, Somali and Kurdish origin migrants compared with the general population in Finland: a cross-sectional population-based study. BMC Public Health. 2019;19(1):391.
doi pubmed - Martins RA, Jones JG, Cumming SP, Coelho e Silva MJ, Teixeira AM, Verissimo MT. Glycated hemoglobin and associated risk factors in older adults. Cardiovasc Diabetol. 2012;11:13.
doi pubmed - Bower JK, Meadows RJ, Foster MC, Foraker RE, Shoben AB. The association of percent body fat and lean mass with HbA1c in US adults. J Endocr Soc. 2017;1(6):600-608.
doi pubmed - World Health Organization. Body Mass Index - BMI. https://www.euro.who.int/en/health-topics/disease-prevention/nutrition/a-healthy-lifestyle/body-mass-index-bmi.
- World Health Organization. Waist circumference and waist-hip ratio: report of a WHO expert consultation. Geneva: WHO; 2008.
- Rutherford WJ, Diemer GA, Scott ED. Comparison of bioelectrical impedance and skinfolds with hydrodensitometry in the assessment of body composition in healthy young adults. Journal of Research. 2011;6(2);56-60.
- Csongova M, Volkovova K, Gajdos M, Gurecka R, Koborova I, Liskova A, Sebekova K. Gender-associated differences in the prevalence of central obesity using waist circumference and waist-to-height ratio, and that of general obesity, in Slovak adults. Cent Eur J Public Health. 2018;26(3):228-233.
doi pubmed - Zhang ZQ, Deng J, He LP, Ling WH, Su YX, Chen YM. Comparison of various anthropometric and body fat indices in identifying cardiometabolic disturbances in Chinese men and women. PLoS One. 2013;8(8):e70893.
doi pubmed - Stevens J, Katz EG, Huxley RR. Associations between gender, age and waist circumference. Eur J Clin Nutr. 2010;64(1):6-15.
doi pubmed - Jekal Y, Lee MK, Park S, et al. Association between obesity and physical fitness, and hemoglobin A1c level and metabolic syndrome in Korean adults. Korean Diabetes Journal. 2010;34(4):265.
doi pubmed - Tramunt B, Smati S, Grandgeorge N, Lenfant F, Arnal JF, Montagner A, Gourdy P. Sex differences in metabolic regulation and diabetes susceptibility. Diabetologia. 2020;63(3):453-461.
doi pubmed - Babikr WG, Alshahrani AS, Hamid HG, et al. The correlation of HbA1c with body mass index and HDL-cholesterol in type 2 diabetic patients. Biomed Res. 2016;27(4):1280-1283.
- Asprila Dewi, Putu Ria. Wande I Nyoman. Hubungan lingkar pinggang dengan kadar gula darah sewaktu dan tekanan darah pada mahasiswa-mahasiswi obesitas. E-Jurnal Medika Udayana. 2018; p. 2303-1395.
- Papaetis GS, Papakyriakou P, Panagiotou TN. Central obesity, type 2 diabetes and insulin: exploring a pathway full of thorns. Arch Med Sci. 2015;11(3):463-482.
doi pubmed
This article is distributed under the terms of the Creative Commons Attribution Non-Commercial 4.0 International License, which permits unrestricted non-commercial use, distribution, and reproduction in any medium, provided the original work is properly cited.
Journal of Endocrinology and Metabolism is published by Elmer Press Inc.
