

| Journal of Endocrinology and Metabolism, ISSN 1923-2861 print, 1923-287X online, Open Access |
| Article copyright, the authors; Journal compilation copyright, J Endocrinol Metab and Elmer Press Inc |
| Journal website https://www.jofem.org |
Short Communication
Volume 12, Number 2, April 2022, pages 73-78

Alanine Aminotransferase, Body Mass Index, and Hemoglobin A1c May Be Useful Markers for Monitoring Changes in Intrahepatic Lipid Content in Japanese Patients With Overweight or Obesity and Type 2 Diabetes
Ayaka Takemotoa, b, Yukiyoshi Sadaa, Takeshi Oyanagia, b, Yosuke Sasakia, Masakatsu Soneb, Yasushi Tanakaa, c
aDiabetes Center, Yokohama General Hospital, 2201-5 Kurogane-cho, Aoba-ku, Yokohama, Kanagawa 225-0025, Japan
bMetabolism and Endocrinology, St. Marianna University School of Medicine, 2-16-1, Sugao, Miyamae-ku, Kawasaki, Kanagawa 216-8511, Japan
cCorresponding Author: Yasushi Tanaka, Diabetes Center, Yokohama General Hospital, 2201-5 Kurogane-cho, Aoba-ku, Yokohama, Kanagawa 225-0025, Japan
Manuscript submitted March 22, 2022, accepted April 4, 2022, published online April 23, 2022
Short title: ALT, BMI, and HbA1c as Markers for Liver Fat
doi: https://doi.org/10.14740/jem803
| Abstract | ▴Top |
Background: Intrahepatic lipid (IHL) content is considered as an important marker of insulin resistance in overweight and obesity, so quantifying IHL content may be useful for assessing effects of interventions. IHL content can be quantitatively measured by hepatic proton magnetic resonance spectroscopy (1H-MRS), whereas other methods, such as computed tomography (CT) scan or ultrasound echography are semi-quantitative or qualitative analysis. But, 1H-MRS cannot be routinely performed in general hospitals, and thus, surrogate markers reflecting changes in IHL content are required. Previously, we performed three prospective studies focusing on IHL by antidiabetic drug in type 2 diabetic patients with overweight or obesity. Here, we present a combined post hoc analysis of these studies with the aim to identify optimal markers of changes in IHL content.
Methods: A total of 49 patients with body mass index (BMI) ≥ 25 kg/m2 or fatty liver were enrolled in the previous three prospective studies. For the current analysis, we extracted age and sex at baseline and the following variables at baseline and 12 and 24 weeks after the start of drug treatment: IHL content; BMI; serum low-density lipoprotein-cholesterol (LDL-C) and triglyceride (TG); serum aspartate aminotransferase (AST), alanine aminotransferase (ALT), and γ-glutamyl transpeptidase (γ-GTP); hemoglobin A1c (HbA1c). We evaluated associations of the change in the variables with the change in IHL content.
Results: All variables showed significant change from baseline to 12 and 24 weeks, but not from 12 to 24 weeks. The change in BMI, AST, ALT, and HbA1c at 12 and 24 weeks showed stronger association with the change in IHL content at those times than the other variables. From multiple regression analysis at 12 weeks, the baseline value and change from baseline to 12 weeks in BMI, ALT, and HbA1c were correlated with the change in IHL content.
Conclusion: BMI, ALT, and HbA1c may be useful markers for monitoring the change in IHL content.
Keywords: Body mass index; Alanine aminotransferase; Hemoglobin A1c; Intrahepatic lipid content; Clinical marker; Type 2 diabetes
| Introduction | ▴Top |
Abdominal visceral fat (AVF) and abdominal subcutaneous fat (ASF) volume, and intrahepatic lipid (IHL) content are associated with insulin resistance in people with obesity [1-3]. In a previous study, we aimed to identify markers that are closely associated with insulin resistance [4]. Thirty unmedicated Japanese people with overweight or obesity underwent 75-g oral glucose tolerance test (OGTT) to calculate indices of insulin resistance (homeostasis model assessment of insulin resistance (HOMA-R) and Matsuda Index), dual energy X-ray absorptiometry (DXA) to measure whole body fat (WBF) weight, whole abdominal computed tomography (CT) scan from the top of liver to the bottom of pelvic cavity to obtain AVF and ASF volumes, and hepatic proton magnetic resonance spectroscopy (1H-MRS) to quantitatively assess IHL content. According to multiple regression analysis, IHL content but not WBF weight or AVF or ASF volume was significantly correlated with both the HOMA-R and Matsuda Index. Furthermore, after a 5% reduction of body weight by a dietary intervention, the Matsuda Index significantly increased, and this increase was accompanied by a significant reduction in IHL content but not by changes in AVF or ASF volume. These results suggested that IHL may be a suitable marker of insulin resistance in people with overweight and obesity. In fact, nonalcoholic fatty liver disease (NAFLD), a common chronic liver disorder worldwide, is closely associated with insulin resistance and type 2 diabetes [5]. Taken together, these findings indicate that quantitative measuring of IHL content may enable assessment of the effects of lifestyle modification and drug treatment interventions.
1H-MRS is a non-invasive method to quantitatively measure IHL content, but it cannot be routinely performed in general medical institutes or hospitals. Therefore, other imaging analyses, such as a CT scan (to assess the liver-to-spleen ratio), ultrasound echography, or the bioimpedance analysis are used; however, these methods are only semi-quantitative or qualitative. Consequently, having quantitative markers that are sensitive to changes in IHL content and easily measured by blood examination would be useful for assessing the effects of interventions on IHL content.
Previously, we measured IHL content by 1H-MRS during a general health check examination in 305 unmedicated Japanese individuals. On the basis of our findings, we proposed a cut-off value for IHL content in metabolically healthy people [6]. Furthermore, multiple regression analysis showed a correlation of the log-transformed IHL content with sex, age, log body mass index (BMI), and log serum alanine aminotransferase (ALT) but not log serum aspartate aminotransferase (AST)) or log serum γ-glutamyl transpeptidase (γ-GTP), suggesting that serum BMI and ALT may be optimal markers for IHL content. Similarly, another report showed a correlation of serum ALT but not AST or γ-GTP with IHL content measured by 1H-MRS in people with obesity [7]. However, these results were based on cross-sectional analysis, and it remains unclear whether BMI and ALT may change in parallel with IHL content. Previously, we performed three 24-week prospective studies on the changes in IHL content with anti-diabetic drug treatment in patients with overweight or obesity and type 2 diabetes [8-10]. Because IHL content was measured by 1H-MRS in all patients, we combined the results of these three studies and performed a post hoc analysis with the aim to identify useful markers for change in IHL content.
| Materials and Methods | ▴Top |
Participants
We analyzed the data of 49 patients with type 2 diabetes who had a BMI equal to or greater than 25 kg/m2 or fatty liver without other chronic liver disease. These patients were participants in three prospective, 24-week, single-center, open-label studies that we conducted at the outpatient clinic of St. Marianna University Hospital (Kawasaki, Japan) between June 2011 and January 2016 [8-10]. Twenty participants were treated with the sodium glucose co-transporter-2 inhibitor ipragliflozin (50 mg) [9]; 10 with the sulfonyl urea glimepiride (0.5 mg titrated to 1.0 mg) [8]; 10 with the dipeptidyl peptodase-4 inhibitor sitagliptin (25 mg titrated to 50 mg) [8]; and nine with the glucagon-like peptide-1 (GLP-1) receptor agonist liraglutide (0.3 mg titrated to 0.9 mg) [10]. In all patients, body weight, hemoglobin A1c (HbA1c), serum lipids, and serum liver enzymes were assessed at baseline and 12 and 24 weeks after starting treatment.
Measurement of IHL content
In the three studies, IHL content was measured at baseline, 12, and 24 weeks after starting treatment by the same method of 1H-MRS, as described previously [8, 9]. Briefly, images of the liver were obtained with a 1.5-Tesla whole-body system (Intera Achieva; Philips Medical Systems, The Netherlands). The volume of interest (20 × 20 × 20 mm3) was centered on segment 6 of the liver, and spectra were acquired by using a point-resolved spectroscopy sequence (PRESS) with a 2,000 ms repetition time, 144 ms echo time, and 128 acquisitions. Then, intracellular triglycerides were quantified from the methylene proton peaks (-CH2) of fatty acids at 1.3 ppm. Spectrum fitting and analysis were performed with LCModel software (version 6.2; S. Provencher, PhD, Canada), after which the IHL content was calculated as follows: area under the curve of the methylene proton peak (AUC-IHL)/(AUC-IHL + area under the curve of the water proton peak (AUC-water)) × 100 (%).
Data extraction and statistical analysis
We extracted age and sex at baseline and the following variables at baseline and 12 and 24 weeks after the start of drug treatment: IHL content; BMI as a marker of body weight; serum low-density lipoprotein-cholesterol (LDL-C) and triglyceride (TG) as markers of lipid metabolism; serum AST, ALT, and γ-GTP as markers of liver function; and HbA1c as a marker of glycemic control.
Data are expressed as mean ± standard deviation (SD). Differences between baseline and 12 and 24 weeks were assessed by Tukey’s type multiple comparison test. Then, to examine whether the change in each variable was linked with that in IHL content, we analyzed by a modified method of correlation analysis. Briefly, we used the change from baseline to 12 or 24 weeks in IHL content as (Yi at 12 or 24 weeks - Yi at baseline) and that in another variable as (Xi at 12 or 24 weeks - Xi at baseline), and calculated coefficient of linkage (λ) by the below equations.
Finally, to examine what are the optimal markers to reflect change in IHL content, multiple regression analysis by stepwise forward selection method was done. All analyses were performed with the SPSS version 21 software package (IBM, Tokyo, Japan). Statistical significance was defined as a P value less than 0.05, and selected variables showing P value less than 0.1 in multiple regression analysis were used to make multiple regression equation.
The study was approved by the Ethics Committee of St. Marianna University School of Medicine (No. 1850, 2678). The study was conducted in compliance with the ethical standards of the responsible institution on human subjects as well as the Helsinki Declaration.
| Results | ▴Top |
The clinical characteristics at baseline, 12, and 24 weeks after starting treatment and the change in the variables of interest are shown in Table 1. BMI, IHL content, LDL-C, AST, ALT, γ-GTP, and HbA1c but not TG decreased from baseline to 12 and 24 weeks; however, no variable changed from 12 to 24 weeks.
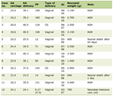 Click to view | Table 1. Clinical Characteristics of Participants |
Coefficient of linkage (λ) of the variables at 12 and 24 weeks with IHL content are shown in Table 2. At 12 weeks, significant positive association between change in the variable and that in the IHL content were found in BMI, LDL-C, TG, AST, ALT, γ-GTP, and HbA1c. At 24 weeks, such associations were found in BMI, LDL-C, AST, ALT, γ-GTP, and HbA1c but not TG. λ of BMI, AST, ALT, and HbA1c were higher than the other variables.
Click to view | Table 2. Association of Change in Clinical Variables With Change in Intrahepatic Lipid Content From Baseline to 12 and 24 Weeks |
Since all variables did not show significant change from 12 to 24 weeks, we performed multiple regression analysis by stepwise forward selection method at 12 weeks. Specifically, we used IHL content at 12 weeks as the objective variable and used IHL content at baseline and the other variables at baseline and 12 weeks as the explaining variables. As shown in Table 3, selected variables were IHL content at baseline, BMI at baseline and 12 weeks, ALT at baseline and 12 weeks, and HbA1c at baseline and 12 weeks. Along with the results, we obtained multiple regression equation as below.
Click to view | Table 3. Multiple Regression Analysis by Stepwise Forward Selection Method |
Above equation could be transformed as below.
Because multiple coefficient of determination (R2) was 0.855, and adjusted R2 was 0.829, changes in BMI, ALT, and HbA1c and baseline values of these variables and IHL content were associated with change in IHL content.
| Discussion | ▴Top |
We performed a post hoc analysis of data from three studies on IHL content and clinical biomarkers. In all studies, measurements were performed by the same methods at one hospital. The present post hoc analysis of the data from three studies found that changes in BMI, AST, ALT, and HbA1c strongly correlated with that in IHL content at 12 and 24 weeks after starting a drug intervention in analysis of coefficient of linkage as shown in Table 2. Furthermore, changes in BMI, ALT, and HbA1c and baseline values of IHL content and these variables were closely associated with change in IHL content in multiple regression analysis as shown in Table 3. Therefore, BMI, ALT, and HbA1c may be useful markers to assess change of IHL content in patients with overweight or obesity and type 2 diabetes.
In correlation analysis between X and Y, when we use changing rate or changing amount of IHL content as Y and that of another variable as X, obtained result may have a possibility of strange and unreasonable data. For example, in the case that changing rates or amounts of change in all subjects are same value, the mean of them will be same value. Thus, both covariance and product of SD will be zero, and correlation coefficient cannot be calculated. Thus, we used a modified method of correlation analysis in the present study as shown in the part of data extraction and statistical analysis. As shown in Table 3, variance inflation factor (VIF), a marker of multicollinearity, of BMI at baseline and 12 weeks were high, whereas VIF of ALT and HbA1c both at baseline and 12 weeks were less than 10. In multiple regression analysis with exclusion of BMI at baseline from the explaining variables, VIF of BMI at 12 weeks was 1.099. In similar analysis with exclusion of BMI at 12 weeks, VIF of BMI at baseline was 1.162. In both analyses, VIF of other variables were less than 10. Taken together, high VIF values of BMI at baseline and 12 weeks in the Table 3 may be due to correlation between them, and BMI, ALT, and HbA1c may be independent variables each other. Thus, obtained result from multiple regression analysis in the present study was thought as reasonable.
Both AST and ALT catalyze the transfer of amino groups from aspartate or alanine to ketoglutaric acid to produce oxaloacetate and pyruvate, respectively, in gluconeogenesis. Whereas AST is found in high concentrations in the liver, cardiac and skeletal muscle, kidneys, brain, and other organs, ALT is found mainly in the liver. Thus, ALT is considered as a useful marker of both hepatocellular injury and IHL accumulation in NAFLD [11]. However, a previous cross-sectional study showed that ALT may not be a useful marker for diagnosis of NAFLD, because levels of liver enzymes such as ALT were normal in up to 80% of patients with NAFLD [12]. Similarly, a recent meta-analysis of 11 studies in a total of 4,084 patients also showed that 25% of the patients with NAFLD had a normal ALT value (95% confidence interval (CI): 20-31%) [13]. Because these findings indicated that ALT may not be a reliable marker for screening NAFLD, several studies proposed using an index or score that combines ALT with various other clinical biomarkers and shows high sensitivity and specificity, as validated by 1H-MRS or ultrasonography [14].
Previously, we reported a significant correlation of ALT with IHL content in 305 unmedicated Japanese people who underwent a general health check [6]. In this study, we identified cut-off values for IHL content for metabolically healthy individuals by receiver operating curve analysis and suggested that these values may be useful for defining a normal range of IHL content. In addition, we calculated that ALT values of 18 and 12 IU/L in men and women, respectively, were equivalent to the cut-off values of IHL content (unpublished data). These ALT values were much lower than the general upper limit of ALT in normal ranges, including those used in the above mentioned studies, suggesting that these lower values may be useful for screening for NAFLD. Despite our findings and those of the studies described above, it remains unclear whether ALT or another variable is an optimal marker for monitor changes in IHL content because all of the above results were based on cross-sectional research.
As regards findings from prospective longitudinal studies, a meta-analysis showed that exercise alone or in combination with a dietary intervention reduces BMI, serum liver enzymes, and IHL content as assessed by liver biopsy or imaging methods such as CT, 1H-MRS, and ultrasonography, in patients with NAFLD, but the meta-analysis did not include a correlation analysis of the relative change of IHL content and that of BMI and liver enzymes [15, 16]. A recent prospective study showed that a soy protein-based meal regimen decreased IHL content (as assessed by 1H-MRS) and both AST and ALT values in patients with nonalcoholic steatohepatitis [17], and the other study also revealed that a glucagon-like peptide 1 receptor agonist and sodium glucose co-transporter 2 inhibitor (SGLT2-i) decreased liver fat (as assessed by vibration-controlled transient elastography with controlled attenuation parameter quantified hepatic fat content method), BMI, HbA1c, and the activity of both serum ALT and γ-GTP [18]. Our previous study using SGLT2-i also showed similar result [9]. However, these studies did not evaluate whether the changes in BMI and liver enzyme values were linked with the change in IHL content. Therefore, the present study might be the first to show that BMI, ALT, and HbA1c may change in parallel with changes of IHL content, as measured by 1H-MRS, and thus that these markers may be useful markers for monitoring IHL content in patients with overweight or obesity and type 2 diabetes.
The present study has several limitations. First, it was a post hoc analysis of a small number of patients with type 2 diabetes. Second, the study period was 24 weeks, and it is unclear whether the obtained results are applicable in the longer term. Third, all three studies used in the present analysis were drug intervention trials, and the analysis did not include any studies of dietary and/or exercise interventions. All antidiabetic agents can directly influence liver function and glycemic control, so serum liver enzyme activities and HbA1c may change without being related to changes in IHL content. Because of these limitations, the present results need to be confirmed in a longer term prospective study with a large number of participants treated by both drug and non-drug interventions.
In conclusion, the change in BMI, AST, ALT, and HbA1c at 12 and 24 weeks showed stronger association with the change in IHL content at those times than the other variables. The baseline value and change from baseline to 12 weeks in BMI, ALT, and HbA1c were correlated with the change in IHL content. Consequently, BMI, ALT, and HbA1c may be useful markers for monitoring change in IHL content.
Acknowledgments
None to declare.
Financial Disclosure
None to declare.
Conflict of Interest
The authors declare no conflict of interest.
Informed Consent
Written informed consent was obtained from all patients.
Author Contributions
AT designed the study, participated in data collection, performed the statistical analysis, and wrote the manuscript. YS, TO, and YS participated in data collection and statistical analysis. MS and YT designated the study and edited the manuscript. All authors approved that final version for publication.
Data Availability
The authors declare that data supporting the findings of this study are available within the article.
| References | ▴Top |
- Patel P, Abate N. Body fat distribution and insulin resistance. Nutrients. 2013;5(6):2019-2027.
doi pubmed - Korenblat KM, Fabbrini E, Mohammed BS, Klein S. Liver, muscle, and adipose tissue insulin action is directly related to intrahepatic triglyceride content in obese subjects. Gastroenterology. 2008;134(5):1369-1375.
doi pubmed - Yki-Jarvinen H. Non-alcoholic fatty liver disease as a cause and a consequence of metabolic syndrome. Lancet Diabetes Endocrinol. 2014;2(11):901-910.
doi - Sada Y, Katabami T, Asai S, Sato T, Furukawa K, Ishii S, Kato H, et al. Intrahepatic lipid content is linked to insulin resistance in obese subjects. Obes Res Clin Pract. 2011;5(2):e79-e156.
doi pubmed - Watt MJ, Miotto PM, De Nardo W, Montgomery MK. The liver as an endocrine organ-linking NAFLD and insulin resistance. Endocr Rev. 2019;40(5):1367-1393.
doi pubmed - Matsubara F, Nagai Y, Tsukiyama H, Shimizu H, Yamanouchi E, Iwamoto T, Sada Y, et al. Proposed cut-off value of the intrahepatic lipid content for metabolically normal persons assessed by proton magnetic resonance spectroscopy in a Japanese population. Diabetes Res Clin Pract. 2016;119:75-82.
doi pubmed - Chen Z, Han CK, Pan LL, Zhang HJ, Ma ZM, Huang ZF, Chen S, et al. Serum alanine aminotransferase independently correlates with intrahepatic triglyceride contents in obese subjects. Dig Dis Sci. 2014;59(10):2470-2476.
doi pubmed - Kato H, Nagai Y, Ohta A, Tenjin A, Nakamura Y, Tsukiyama H, Sasaki Y, et al. Effect of sitagliptin on intrahepatic lipid content and body fat in patients with type 2 diabetes. Diabetes Res Clin Pract. 2015;109(1):199-205.
doi pubmed - Ohta A, Kato H, Ishii S, Sasaki Y, Nakamura Y, Nakagawa T, Nagai Y, et al. Ipragliflozin, a sodium glucose co-transporter 2 inhibitor, reduces intrahepatic lipid content and abdominal visceral fat volume in patients with type 2 diabetes. Expert Opin Pharmacother. 2017;18(14):1433-1438.
doi pubmed - Ishii S, Nagai Y, Sada Y, Fukuda H, Nakamura Y, Matsuba R, Nakagawa T, et al. Liraglutide reduces visceral and intrahepatic fat without significant loss of muscle mass in obese patients with type 2 diabetes: a prospective case series. J Clin Med Res. 2019;11(3):219-224.
doi pubmed - Lala V, Goyal A, Minter DA. Liver function tests. In: StatPearls. Treasure Island (FL), 2022.
- Browning JD, Szczepaniak LS, Dobbins R, Nuremberg P, Horton JD, Cohen JC, Grundy SM, et al. Prevalence of hepatic steatosis in an urban population in the United States: impact of ethnicity. Hepatology. 2004;40(6):1387-1395.
doi pubmed - Ma X, Liu S, Zhang J, Dong M, Wang Y, Wang M, Xin Y. Proportion of NAFLD patients with normal ALT value in overall NAFLD patients: a systematic review and meta-analysis. BMC Gastroenterol. 2020;20(1):10.
doi pubmed - Piazzolla VA, Mangia A. Noninvasive Diagnosis of NAFLD and NASH. Cells. 2020;9(4):1005.
doi pubmed - Katsagoni CN, Georgoulis M, Papatheodoridis GV, Panagiotakos DB, Kontogianni MD. Effects of lifestyle interventions on clinical characteristics of patients with non-alcoholic fatty liver disease: A meta-analysis. Metabolism. 2017;68:119-132.
doi pubmed - Babu AF, Csader S, Lok J, Gomez-Gallego C, Hanhineva K, El-Nezami H, Schwab U. Positive effects of exercise intervention without weight loss and dietary changes in NAFLD-related clinical parameters: a systematic review and meta-analysis. Nutrients. 2021;13(9):3135.
doi pubmed - Deibert P, Lazaro A, Schaffner D, Berg A, Koenig D, Kreisel W, Baumstark MW, et al. Comprehensive lifestyle intervention vs soy protein-based meal regimen in non-alcoholic steatohepatitis. World J Gastroenterol. 2019;25(9):1116-1131.
doi pubmed - Mittag-Roussou V, Wagenpfeil S, Lammert F, Stokes CS. Noninvasive monitoring of liver fat during treatment with GLP-1 analogues and SGLT-2 inhibitors in a real-world setting. Endocrinol Diabetes Metab. 2020;3(3):e00131.
doi pubmed
This article is distributed under the terms of the Creative Commons Attribution Non-Commercial 4.0 International License, which permits unrestricted non-commercial use, distribution, and reproduction in any medium, provided the original work is properly cited.
Journal of Endocrinology and Metabolism is published by Elmer Press Inc.