

| Journal of Endocrinology and Metabolism, ISSN 1923-2861 print, 1923-287X online, Open Access |
| Article copyright, the authors; Journal compilation copyright, J Endocrinol Metab and Elmer Press Inc |
| Journal website https://www.jofem.org |
Original Article
Volume 10, Number 6, December 2020, pages 173-181
Epicardial Adipose Tissue Thickness as a Reliable Marker of Increased Cardiovascular Risk in Patients With Type 2 Diabetes Mellitus
Bhavana Mastebhaktia, Sandeep Garga, c, Naresh Guptaa, Sapna Singhb, Sunita Aggarwala, Ranvijay Singha
aDepartment of Medicine, Maulana Azad Medical College, New Delhi, India
bDepartment of Radiology, Maulana Azad Medical College, New Delhi, India
cCorresponding Author: Sandeep Garg, Department of Medicine, Maulana Azad Medical College, Bahadur Shah Zafar Marg, New Delhi 110002, India
Manuscript submitted October 29, 2020, accepted November 9, 2020, published online December 22, 2020
Short title: Diabetes and Epicardial Adipose Tissue
doi: https://doi.org/10.14740/jem710
| Abstract | ▴Top |
Background: Epicardial adipose tissue (EAT) is a distinct visceral adipose tissue that is present in between the visceral pericardium and myocardium, in which the coronary arteries are lodged. This tissue releases several inflammatory and atherogenic mediators which lead to the initiation and/or progression of coronary atherosclerosis and its thickness is related to the presence and severity of atherosclerotic coronary artery disease (CAD). In this study, we aimed to evaluate the EAT thickness in type 2 diabetes mellitus (T2DM) patients by non-contrast computed tomography (NCCT) of the chest and to correlate its value with HbA1c levels, duration of T2DM and carotid intima-media thickness (CIMT).
Methods: This was a cross-sectional study comprising of 40 patients with T2DM who underwent NCCT of chest and ultrasonographic estimation of CIMT. Ten individuals with equivalent age and sex were included as controls, in whom NCCT of chest was done for other purposes. All the individuals underwent thorough history, clinical examination and certain investigations based on a predesigned proforma.
Results: The EAT thickness was significantly increased in patients with T2DM as compared to controls (8.7 ± 2.94 mm vs. 3.48 ± 0.99 mm, P < 0.001) and also strongly correlated with duration of diabetes (P = 0.02), HbA1c (P ≤ 0.001), total cholesterol (P ≤ 0.001), serum triglyceride levels (P ≤ 0.001) and body mass index (BMI) (P ≤ 0.001).
Conclusion: EAT thickness can be regarded as a sensitive and non-invasive marker for risk stratification of CAD.
Keywords: Epicardial adipose tissue; Type 2 diabetes mellitus; Coronary artery disease; Carotid intima-media thickness
| Introduction | ▴Top |
Globally, type 2 diabetes mellitus (T2DM) is one of the most common comorbidities with a steadily increasing incidence. It is the most common form of diabetes mellitus characterized by hyperglycemia, insulin resistance and relative insulin deficiency. Patients with diabetes are at an increased risk of developing coronary artery disease (CAD) due to accelerated atherosclerosis.
Epicardial adipose tissue (EAT) is a distinct visceral adipose tissue that is present in between the visceral pericardium and myocardium, in which the coronary arteries are lodged. Epicardial adipocytes are anatomically, structurally and physiologically different from other visceral fats. EAT releases several inflammatory and atherogenic mediators that lead to the initiation and progression of CAD [1, 2]. The severity and extent of atherosclerotic CAD is proportional to the thickness and volume of EAT [3-7].
Visceral fat cells have enhanced lipolytic activity leading to increased delivery of free fatty acids (FFAs) into the portal and systemic circulation along with the release of adipokines or adipocytokines involved in atherosclerosis [8, 9]. Hence, visceral obesity also leads to metabolic syndrome that encases insulin resistance, diabetes, hypertension and dyslipidemia, which can further promote accelerated diabetic cardiovascular atherosclerosis.
Few studies have already reported that increased EAT thickness is a risk factor for CAD, metabolic syndrome and obesity [10, 11]. There is paucity of published data describing the role of EAT thickness in patients with T2DM and its correlation with HbA1c levels and the duration of T2DM. In the present study, we evaluated the EAT thickness in patients with T2DM by non-contrast computed tomography (NCCT) of chest and investigated its relationship with duration of T2DM, HbA1c levels and carotid intima-media thickness (CIMT).
| Materials and Methods | ▴Top |
The study was a cross-sectional study, conducted in Department of Medicine, Maulana Azad Medical College and associated Lok Nayak Hospital, New Delhi, India, after obtaining clearance from Institutional Ethics Committee between October 2018 and March 2020. This study was conducted in compliance with the ethical standards of the responsible institution on human subjects as well as with the Helsinki Declaration.
Study population
Patients with T2DM attending the Endocrinology Clinic, Medicine Outpatient Department (OPD), inpatients of Medicine Ward from Lok Nayak Hospital, New Delhi, India, were taken up for the study based on the inclusion and exclusion criteria.
Sample size
A total number of 40 T2DM were taken up for the study. Ten individuals with equivalent age and sex were included as controls, in whom NCCT of chest was done for other purposes.
Inclusion criteria
Forty non-obese and non-hypertensive patients with T2DM (diagnosed according to American Diabetes Association criteria), aged between 30 and 59 years, of either sex who were willing to participate and give consent were taken as cases. Ten age- and sex-matched non-obese, non-hypertensive and non-diabetic individuals were taken as controls.
Exclusion criteria
Patients with obesity, hypertension, diagnosed CAD, type 1 diabetes mellitus, endocrinopathies like Cushing syndrome and hypothyroidism, polycystic ovary disease and pregnant females were excluded.
Methodology
All the diabetic patients underwent thorough history and clinical examination based on a predesigned proforma. Certain investigations like hemogram, kidney function test (KFT), liver function test (LFT), serum calcium, serum phosphate and serum alkaline phosphatase, serum protein/albumin, complete lipid profile, fasting blood sugar (FBS) and post prandial blood sugar (PPBS) levels, HbA1c levels, thyroid function tests, electrocardiogram and urine routine microscopic examination were done in all study cases and controls. NCCT of chest was done in all these patients for estimation of EAT thickness. That cross-section of NCCT of chest was chosen to measure the EAT thickness which had maximum EAT thickness. Further, CIMT was measured by bilateral carotid artery Doppler in all these individuals.
Statistical analysis
Mean and standard deviation were used to represent continuous variables which were further compared by using Student’s t-test. Frequencies and percent values were used for categorical variables which have been compared by Chi-square test. The P-value < 0.05 was considered to be significant for all statistical tests. Co-relations between the EAT thickness and HbA1c levels, duration of diabetes and CIMT were analyzed by Pearson correlation coefficient. All the data gathered were processed by SPSS (Statistical Package for the Social Sciences) version 22.
| Results | ▴Top |
Baseline characteristics of cases and controls
The mean ages of the patients in the case and control groups were 47.48 ± 7.37 and 39.70 ± 4.24 years, respectively, with a range of 32 to 58 years and 32 to 45 years in cases and controls, respectively. The case study population comprised of 37.5% males and 62.5% females and the control study population had 80% males and 20% females. The male/female ratios were 0.6:1 and 4:1 in cases and controls, respectively. The mean duration of T2DM in the case study population was 5.83 ± 4.02 years. The proportion of case group subjects who were diabetic for < 1 year, 1 - 10 years and > 10 years are 7.5%, 77.5% and 15%, respectively. The baseline vitals and characteristics of the subjects in case and control groups are enlisted in Table 1.
 Click to view | Table 1. Baseline Characteristics of the Study Population (n = 50) |
Comparison of EAT and CIMT between cases and controls
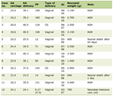
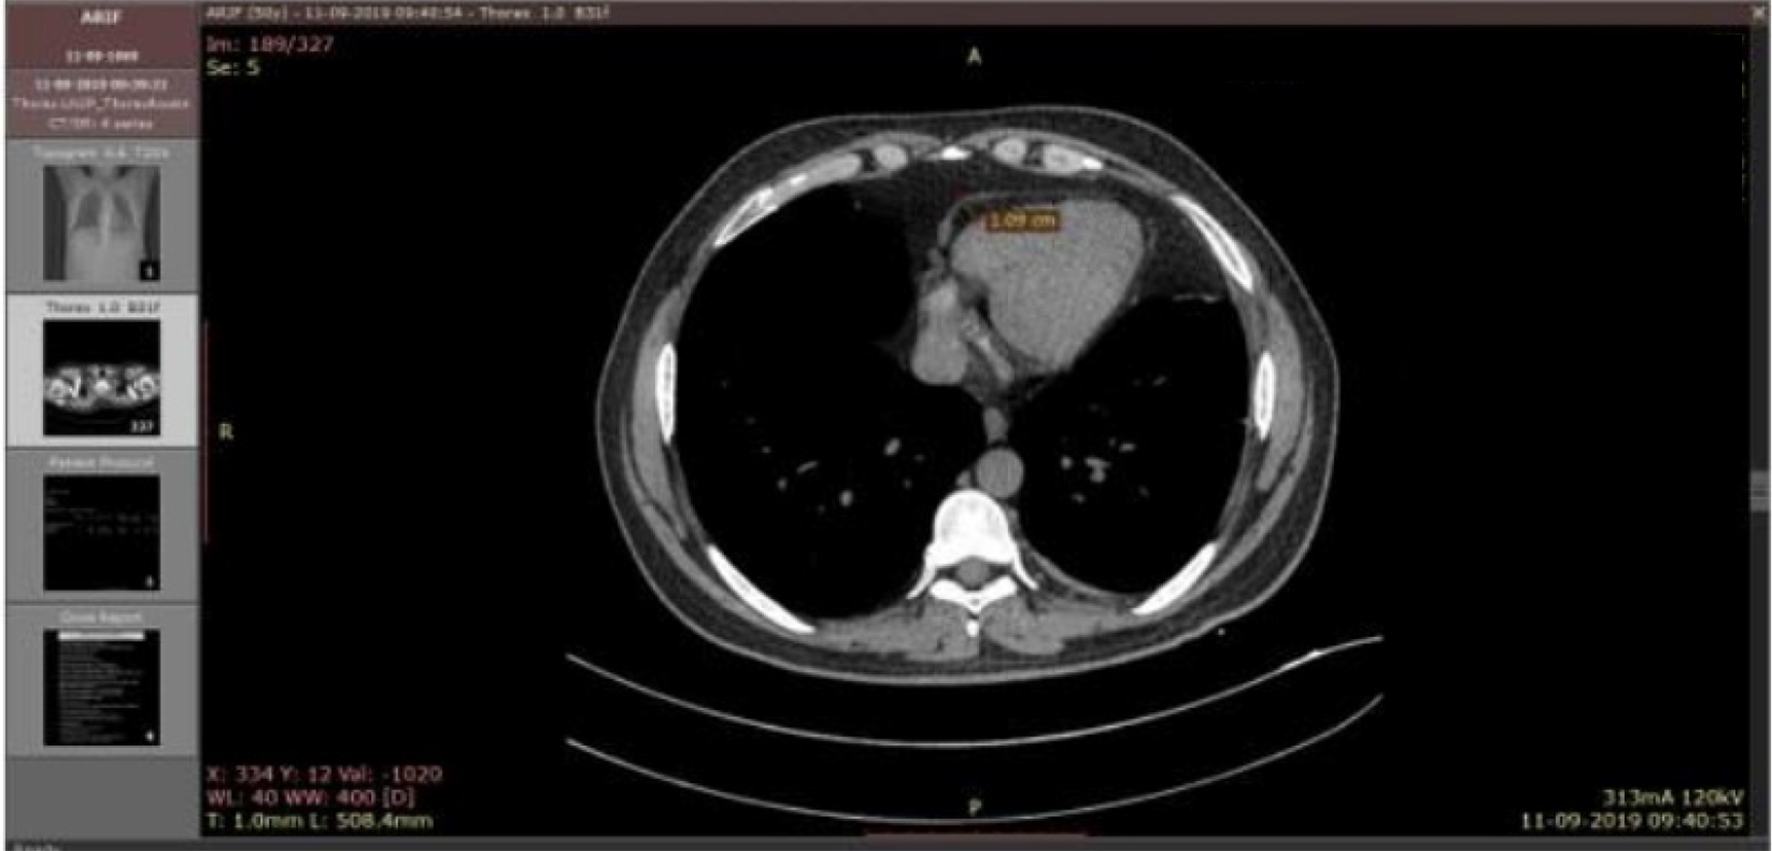
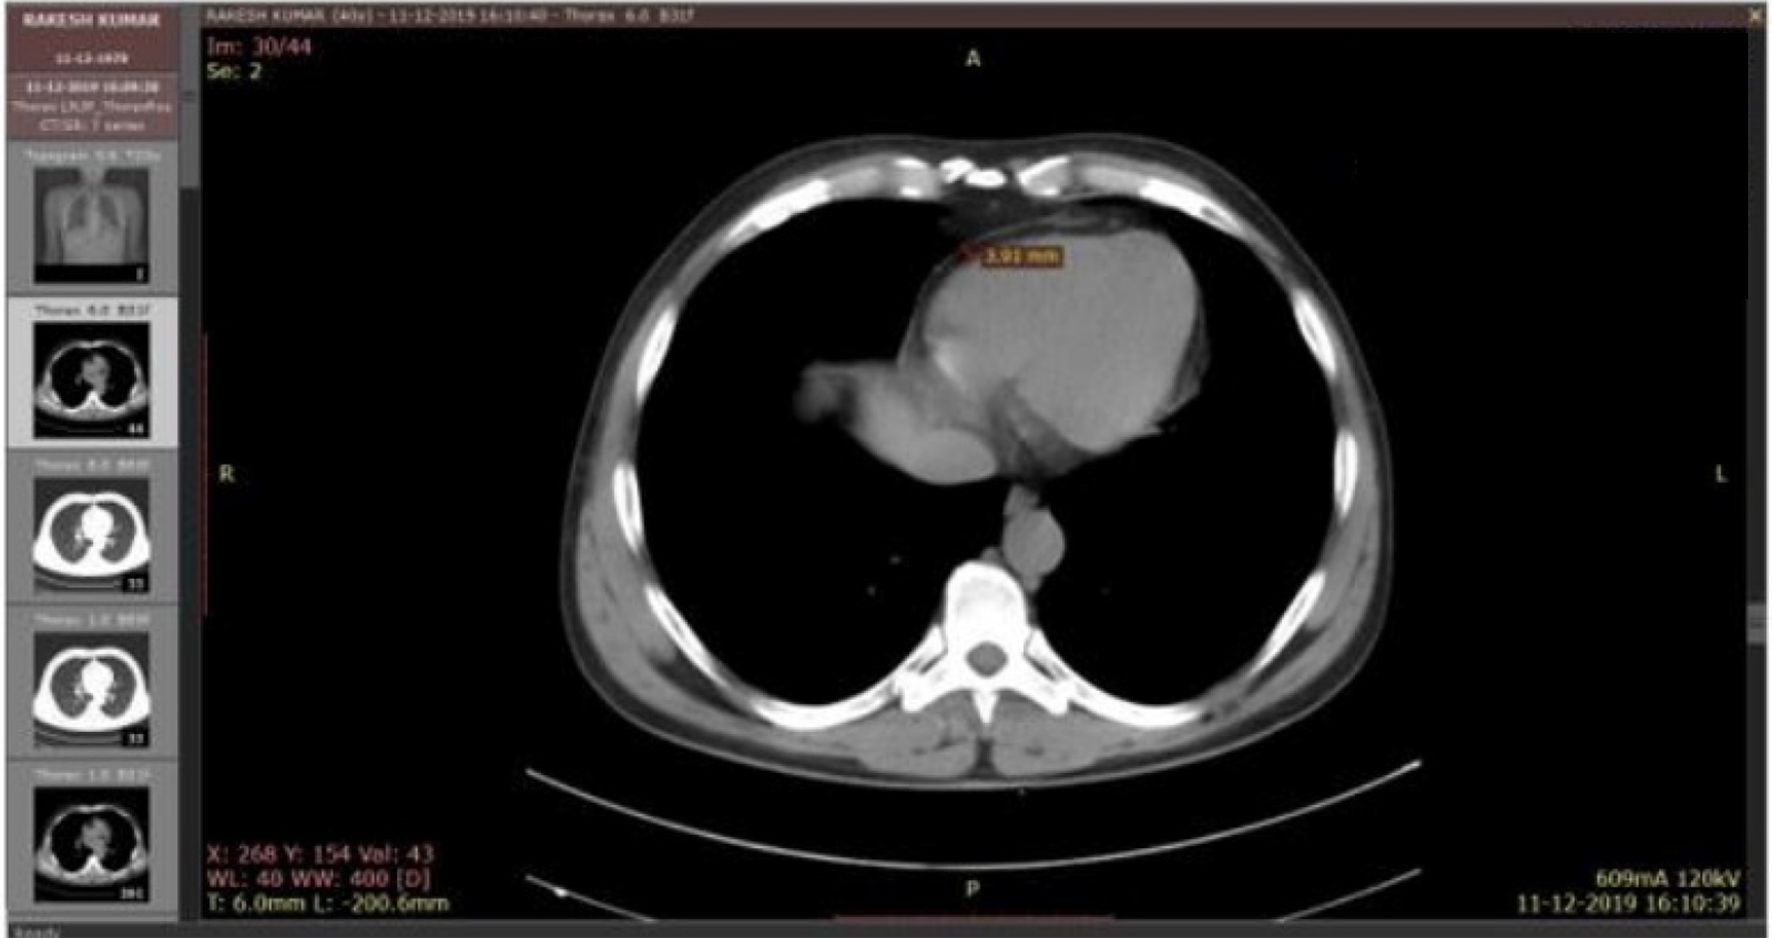
The EAT thickness was measured by NCCT of chest (Figs. 1 and 2) and the CIMT was measured with ultrasound bilateral carotid artery Doppler. The mean EAT thicknesses of the cases and the controls were 8.7 ± 2.94 and 3.48 ± 0.99 mm, respectively (Fig. 3), which were statistically significant (P < 0.001) and the mean CIMTs were 0.65 ± 0.26 and 0.56 ± 0.12 mm in cases and controls, respectively (Fig. 4), which did not come out to be statistically significant (P = 0.17) (Table 2).
 Click for large image | Figure 1. NCCT of chest showing EAT thickness in a case subject. NCCT: non-contrast computed tomography; EAT: epicardial adipose tissue. |
 Click for large image | Figure 2. NCCT of chest showing EAT thickness in a control. NCCT: non-contrast computed tomography; EAT: epicardial adipose tissue. |
 Click for large image | Figure 3. Comparison of EAT thickness between cases and controls. EAT: epicardial adipose tissue. |
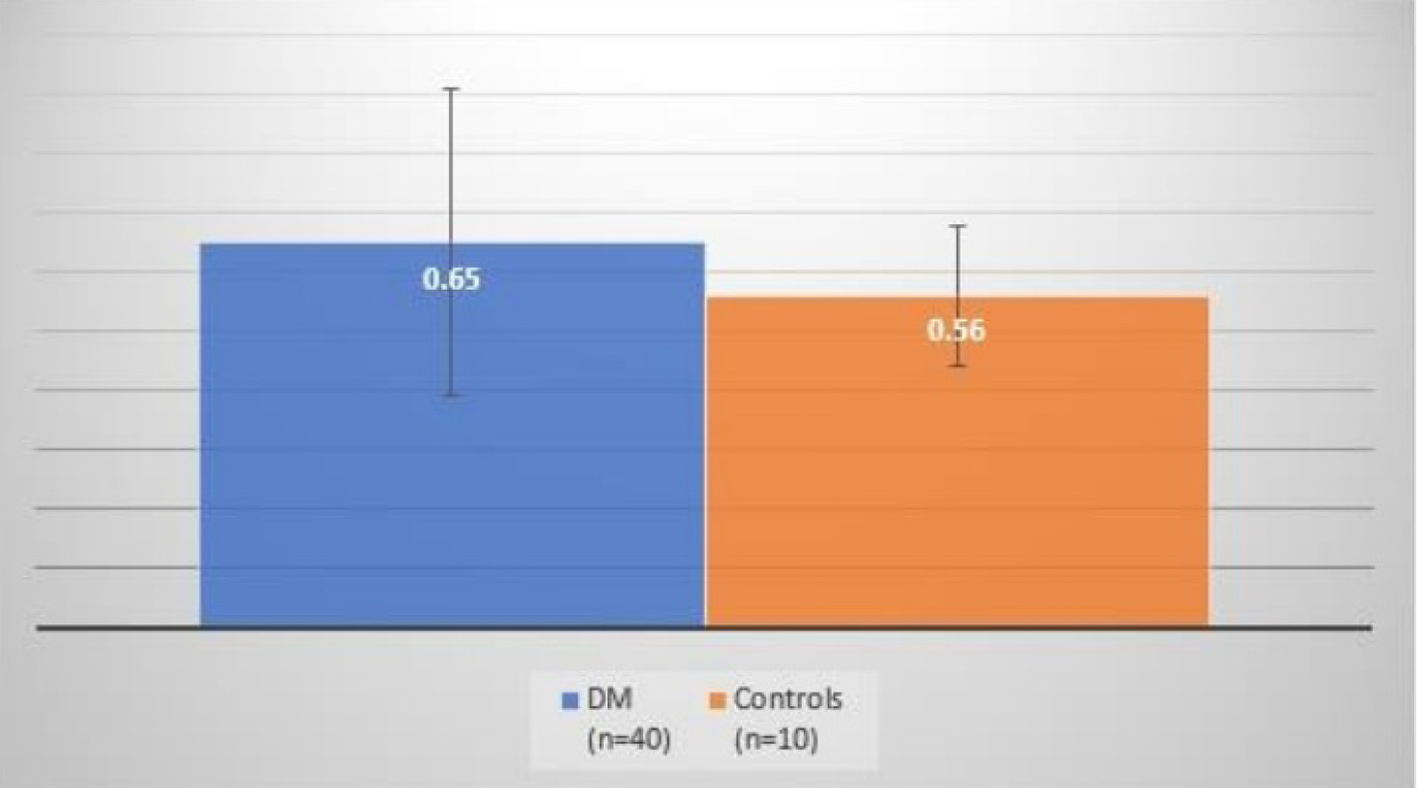 Click for large image | Figure 4. Comparison of CIMT between cases and controls. CIMT: carotid intima-media thickness. |
Click to view | Table 2. Correlations of the Epicardial Adipose Tissue Thickness With Different Variables in Diabetic Patients |
Correlations of the EAT thickness with different variables in diabetic patients
In the case subjects, a positive correlation was observed between the EAT thickness and HbA1c levels (P ≤ 0.001), duration of diabetes (P = 0.02), body mass index (BMI) (P ≤ 0.001), triglyceride (P ≤ 0.001) and the total cholesterol levels (P ≤ 0.001), which was statistically significant. There was also a positive correlation between the EAT thickness and the age of the subjects (P = 0.26) and CIMT (P = 0.17), but it was not statistically significant. However, a negative correlation was observed between the EAT thickness and the FBS (r = -0.23) and PPBS levels (r = -0.22).
Receiver operating characteristics (ROC) curve of the EAT
Area under the curve was 0.99 (95% confidence interval (CI): 0.97 - 1.00). In this study, cutoff value for high-risk EAT thickness obtained was 4.99 mm with sensitivity and specificity of 92.5% and 100.0%, respectively (Fig. 5).
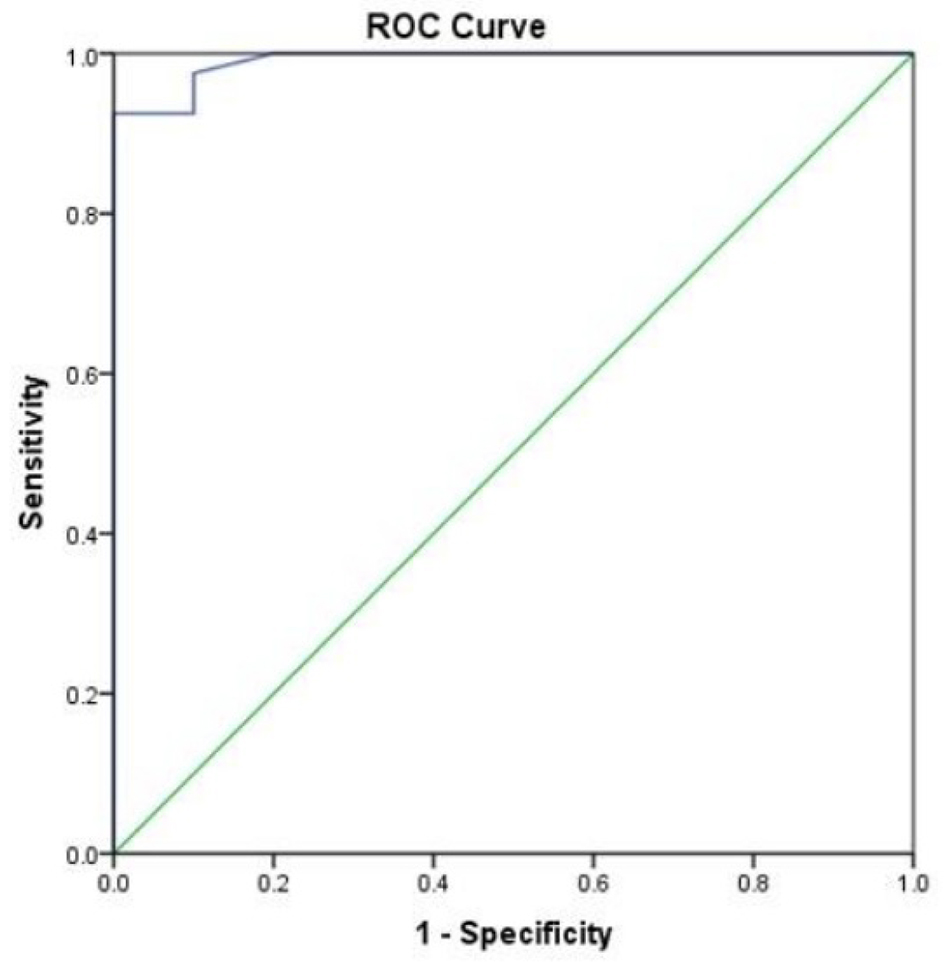 Click for large image | Figure 5. Receiver operating characteristics curve of the EAT thickness to differentiate between diabetic and control group. EAT: epicardial adipose tissue. |
| Discussion | ▴Top |
EAT is a distinct visceral fat surrounding the heart in terms of the adipocyte structure, biochemical and metabolic activity. Structurally, it is composed of adipocytes which are smaller as compared to other visceral fat depots. These adipocytes produce adipokines and cytokines that affect myocardium and coronary arteries through paracrine and vasocrine mechanisms. By paracrine, these released cytokines traverse the coronary wall from outside to inside, interacting with cells in each layer of the vessel wall. By vasocrine, these mediators are released directly into vasa vasorum that carries them downstream into the coronary wall. Both of these mechanisms lead to accelerated atherogenesis. Physiologically, EAT provides mechanical support, has thermoregulatory properties and can be cardioprotective through its anti-atherogenic/anti-inflammatory properties, high FFAs release and uptake and low glucose requirements, which serves as a major source of energy to the heart. Despite these protective roles, an excess of EAT becomes cardio-toxic leading to local inflammation and cardiac dysfunction due to the production of inflammatory mediators such as interleukin (IL)-6, IL-1beta, tumor necrosis factor (TNF)-alfa, monocyte chemotactic protein (MCP-1) and the expression of mRNAs of adiponectin, resistin, leptin and CD45 [12-14].
In this study, the mean ages of the patients in the case and control groups were 47.48 ± 7.37 and 39.70 ± 4.24 years, respectively, with a range of 32 to 58 years and 32 to 45 years in cases and controls, respectively. In a study by Cetin et al, which showed the relation of EAT thickness with CIMT in patients with T2DM, the mean ages of individuals in case and control groups were 54.3 ± 9.2 and 52.1 ± 7.3 years, respectively [15]. In a similar study by Yafei et al, the mean ages of patients in case and control groups were 50.4 ± 8.4 and 48.1 ± 4.6 years, respectively [16]. In a related study by Wang et al, the mean ages of patients in case and control groups were 59.17 ± 9.7 and 58.07 ± 9.2 years, respectively [17]. The differences in the mean age groups of population in these studies could possibly be because our study included case subjects with age ranging between 30 and 59 years. This age group was chosen in our study because firstly, the mean age of presentation of T2DM is 45 years and secondly, the EAT thickness increases per se with age being 22% thicker in individuals older than 65 years [18]. Among the cases, 37.5% of the study population were males and 62.5% were females. The male/female ratios were 0.6:1 and 4:1 in cases and controls, respectively.
The mean duration of T2DM in the case study population was 5.83 ± 4.02 years which is comparable to the mean duration in other similar studies. In a study by Cetin et al, the mean duration of diabetes was 6.5 ± 3.9 years. In other related studies by Yafei et al and Song et al, the mean durations of diabetes were 4.85 ± 4.5 and 6 ± 3 years, respectively.
The mean BMIs of subjects in case and control groups in our study were 19.92 ± 1.48 and 20.82 ± 0.93 kg/m2, respectively. In the study by Cetin et al, the mean BMI of the case group was 27.6 ± 3.1 kg/m2. In other similar studies by Yafei et al and Wang et al, the mean BMIs of the case population were 31 ± 5.2 and 25.3 ± 6.5 kg/m2, respectively. This difference between the mean BMI of case group of our study and other studies could be because our study included only non-obese patients, as the EAT thickness has a direct correlation with obesity [19] and obesity according to BMI in Indian population is defined as a BMI ≥ 25 kg/m2.
In the present study, EAT thickness measured by NCCT of chest showed that patients with T2DM had significantly higher EAT thickness as compared to the non-diabetic controls, with a mean value of 8.7 ± 2.94 and 3.48 ± 0.99 mm, respectively, at a P < 0.001. In the study by Cetin et al also, echocardiographic EAT thickness was significantly higher in patients with T2DM. Similarly, a study by Song et al also concluded that EAT thickness measured with multidetector computed tomography (MDCT) was higher in patients with T2DM. In our study, the CIMT was measured by using bilateral carotid ultrasound Doppler, the mean of which was found to be 0.65 ± 0.26 and 0.56 ± 0.12 mm (P = 0.17) in cases and controls, respectively. The value of CIMT was higher in diabetic patients than in controls but was not statistically significant.
The present study also revealed that increased EAT thickness is associated positively and significantly with the duration of diabetes (P ≤ 0.02), HbA1c (P ≤ 0.001), total cholesterol (P ≤ 0.001), serum triglyceride (P ≤ 0.001) and BMI (P ≤ 0.001) which is corresponding to the previous studies done by Iacobellis et al and Wang et al [17, 20]. Other similar studies including Cetin et al and Yafei et al showed that the CIMT was significantly higher in diabetic patients than in controls. We also found that EAT thickness associated positively but not significantly with age and CIMT. The possible explanation for this could be that firstly, the mean age of the case population in our study was lesser than the mean age of cases of other studies and secondly, the mean duration of diabetes of the case study population was more in other studies than in our study.
However, it was seen in this study that, EAT thickness correlated negatively with the FBS and PPBS levels, the possible explanation of which could be that firstly, the samples taken for these are stat samples, the values of which could have been within the normal range and secondly, these diabetic patients are already on either oral hypoglycemic agents or insulin and hence would have their blood sugar levels within the normal range.
Previous studies by Wang et al, Kumar et al and Kamal et al [17, 21, 22] used echocardiographic estimation of EAT thickness to indicate the presence and severity of atherosclerosis in carotid and coronary arteries. The positive linear correlation between EAT thickness and duration of diabetes and CIMT in the present study support the findings in a study by Sengul et al [23] and also ascertain the usefulness of EAT thickness as a measure of subclinical atherosclerosis in T2DM. Few other studies used magnetic resonance imaging (MRI) or computed tomography (CT) for measurement of EAT thickness and concluded that EAT thickness was an independent risk factor for CAD in asymptomatic T2DM [24]. Results of the present study also support these findings. In a study by Nasri et al [25], a positive correlation was observed between EAT thickness measured by echocardiography and severity of CAD measured by modified Gensini scoring system after angiography. This study also concluded that by evaluation of EAT thickness, we could have an estimation of the severity of CAD before using more invasive techniques.
Iacobellis et al [19] reported that the threshold values of high-risk EAT thickness are median values of 9.5 mm (85% sensitivity and 63% specificity) and 7.5 mm (82% sensitivity and 62% specificity) in white males and females, respectively. In another study on hypertensives conducted by Natale et al [26], patients with EAT thickness > 7 mm showed a significantly higher CIMT (0.84 ± 0.2 mm). In another study performed on patients presenting for cardiovascular preventive care, Nelson et al [27] reported that EAT thickness ≥ 5.0 mm may be used to identify an individual who is at a risk of developing carotid atherosclerosis. In a study by Santosh et al [28], EAT > 4.65 mm was obtained as a threshold value to predict the presence of coronary stenosis with sensitivity and specificity of 71.6% and 73.1%, respectively. They also concluded that EAT thickness measured by transthoracic echocardiography (TTE) significantly correlated with the presence and severity of CAD. In the present study, an EAT thickness of 4.99 mm was found as a high-risk value for the development of subclinical atherosclerosis with sensitivity and specificity of 92.5% and 100%, respectively. Variations in race and patient population in different studies may be the probable cause of the differences in the threshold values of EAT thickness. Irrespective of the threshold values obtained, increased EAT thickness seems to be related to atherosclerotic process.
EAT is considered as a potential risk factor for metabolic syndrome [29, 30]. Due to ethnic variations and variety of methods used in its quantification, there are some difficulties in establishment of a standard cutoff value for high-risk EAT thickness [21, 31]. Different studies reported that increased EAT thickness correlates significantly with the degree and severity of CAD, irrespective of the presence or absence of traditional risk factors [22, 32]. It has been studied that increased EAT thickness is associated with the presence of unstable noncalcified coronary artery plaques, which are the most dangerous type of plaque [33].
In the past, EAT thickness has also been associated with other markers of subclinical atherosclerosis, like apo B/apoA-1 ratio and total cholesterol/high-density lipoprotein (HDL) ratio in symptomatic and asymptomatic adults with high risk of atherosclerosis, in obese children and in non-obese adults [34-37]. EAT thickness is also known to be increased in patients with prediabetes [36].
Our study had some limitations. Firstly, this was a case-control study, and prospective studies are needed to show correlation between EAT thickness and CIMT, HbA1c, duration of T2DM, lipid profile and BMI. Secondly, all values were based on a single stat measurement and hence may not reflect the association of EAT thickness with CIMT, HbA1c, duration of diabetes, lipid profile, BMI, FBS and PPBS levels with time. In order to establish EAT thickness as a high-risk criterion for CAD in T2DM, more studies are necessary on a larger group of population.
Conclusion
The present study concludes that EAT thickness measured by NCCT of chest was significantly increased in patients with T2DM. The results from our study may suggest that the assessment of EAT thickness by NCCT of chest is a reliable marker for atherosclerosis and increased cardiovascular risk in patients with T2DM. It is a sensitive, non-invasive, cost-effective tool which may be used as an additional risk factor for CAD. Further studies are needed to confirm these findings.
Acknowledgments
None to declare.
Financial Disclosure
None to declare.
Conflict of Interest
None to declare.
Informed Consent
An informed consent was taken from all the individuals who were also explained the purpose of the study and their right to exit at any time. Patient’s information was dealt with utmost confidentiality. Any abnormality incidentally detected during screening of individuals was appropriately managed.
Author Contributions
Bhavana Mastebhakti carried out the entire research, collected the samples and the data, performed the analytic calculations and the numerical simulations, analyzed and interpreted the results and wrote the manuscript with support from the below mentioned. Sandeep Garg designed the study and the main conceptual ideas, encouraged to investigate, supervised the findings, verified the analytical methods and supported in writing the manuscript. Naresh Gupta encouraged to investigate, supervised the findings and verified the analytical methods. Sapna Singh encouraged to investigate, supervised the findings and verified the analytical methods. Sunita Aggarwal encouraged to investigate, supervised the findings and verified the analytical methods. Ranvijay Singh contributed to sample collection.
Data Availability
The data supporting the findings of this study are available from the corresponding author upon reasonable request.
| References | ▴Top |
- Iacobellis G, Malavazos AE, Corsi MM. Epicardial fat: from the biomolecular aspects to the clinical practice. Int J Biochem Cell Biol. 2011;43(12):1651-1654.
doi pubmed - Xu Y, Cheng X, Hong K, Huang C, Wan L. How to interpret epicardial adipose tissue as a cause of coronary artery disease: a meta-analysis. Coron Artery Dis. 2012;23(4):227-233.
doi pubmed - Eroglu S, Sade LE, Yildirir A, Bal U, Ozbicer S, Ozgul AS, Bozbas H, et al. Epicardial adipose tissue thickness by echocardiography is a marker for the presence and severity of coronary artery disease. Nutr Metab Cardiovasc Dis. 2009;19(3):211-217.
doi pubmed - Topuz M, Dogan A, Celik A, Can C, Ozdogru I, Kemal Eryol N. Investigation of the relationship between non-alcoholic fatty liver disease and coronary artery disease. Clin Ter. 2014;165(1):e46-51.
- Groves EM, Erande AS, Le C, Salcedo J, Hoang KC, Kumar S, Mohar DS, et al. Comparison of epicardial adipose tissue volume and coronary artery disease severity in asymptomatic adults with versus without diabetes mellitus. Am J Cardiol. 2014;114(5):686-691.
doi pubmed - Mihl C, Loeffen D, Versteylen MO, Takx RA, Nelemans PJ, Nijssen EC, Vega-Higuera F, et al. Automated quantification of epicardial adipose tissue (EAT) in coronary CT angiography; comparison with manual assessment and correlation with coronary artery disease. J Cardiovasc Comput Tomogr. 2014;8(3):215-221.
doi pubmed - Kim SH, Chung JH, Kwon BJ, Song SW, Choi WS. The associations of epicardial adipose tissue with coronary artery disease and coronary atherosclerosis. Int Heart J. 2014;55(3):197-203.
doi pubmed - Matsuzawa Y. Therapy Insight: adipocytokines in metabolic syndrome and related cardiovascular disease. Nat Clin Pract Cardiovasc Med. 2006;3(1):35-42.
doi pubmed - Wang CP, Chung FM, Shin SJ, Lee YJ. Congenital and environmental factors associated with adipocyte dysregulation as defects of insulin resistance. Rev Diabet Stud. 2007;4(2):77-84.
doi pubmed - Taguchi R, Takasu J, Itani Y, Yamamoto R, Yokoyama K, Watanabe S, Masuda Y. Pericardial fat accumulation in men as a risk factor for coronary artery disease. Atherosclerosis. 2001;157(1):203-209.
doi - Gorter PM, van Lindert AS, de Vos AM, Meijs MF, van der Graaf Y, Doevendans PA, Prokop M, et al. Quantification of epicardial and peri-coronary fat using cardiac computed tomography; reproducibility and relation with obesity and metabolic syndrome in patients suspected of coronary artery disease. Atherosclerosis. 2008;197(2):896-903.
doi pubmed - Baker AR, Silva NF, Quinn DW, Harte AL, Pagano D, Bonser RS, Kumar S, et al. Human epicardial adipose tissue expresses a pathogenic profile of adipocytokines in patients with cardiovascular disease. Cardiovasc Diabetol. 2006;5:1.
doi pubmed - Mazurek T, Zhang L, Zalewski A, Mannion JD, Diehl JT, Arafat H, Sarov-Blat L, et al. Human epicardial adipose tissue is a source of inflammatory mediators. Circulation. 2003;108(20):2460-2466.
doi pubmed - de Feyter PJ. Epicardial adipose tissue: an emerging role for the development of coronary atherosclerosis. Clin Cardiol. 2011;34(3):143-144.
doi pubmed - Cetin M, Cakici M, Polat M, Suner A, Zencir C, Ardic I. Relation of epicardial fat thickness with carotid intima-media thickness in patients with type 2 diabetes mellitus. Int J Endocrinol. 2013;2013:769175.
doi pubmed - Yafei S, Elsewy F, Youssef E, Ayman M, Elshafei M, Abayazeed R. Echocardiographic association of epicardial fat with carotid intima-media thickness in patients with type 2 diabetes. Diab Vasc Dis Res. 2019;16(4):378-384.
doi pubmed - Wang Z, Zhang Y, Liu W, Su B. Evaluation of epicardial adipose tissue in patients of type 2 diabetes mellitus by echocardiography and its correlation with intimal medial thickness of carotid artery. Exp Clin Endocrinol Diabetes. 2017;125(9):598-602.
doi pubmed - Abbara S, Desai JC, Cury RC, Butler J, Nieman K, Reddy V. Mapping epicardial fat with multi-detector computed tomography to facilitate percutaneous transepicardial arrhythmia ablation. Eur J Radiol. 2006;57(3):417-422.
doi pubmed - Iacobellis G, Willens HJ, Barbaro G, Sharma AM. Threshold values of high-risk echocardiographic epicardial fat thickness. Obesity (Silver Spring). 2008;16(4):887-892.
doi pubmed - Iacobellis G, Barbaro G, Gerstein HC. Relationship of epicardial fat thickness and fasting glucose. Int J Cardiol. 2008;128(3):424-426.
doi pubmed - Kumar V, Kannan K, Kumar R, Arvind A. Epicardial adipose tissue thickness, carotid intima media thickness and total cholesterol/HDL ratio - A combined cut off for detecting coronary artery disease. J Ind Coll Cardiol. 2018;8(2):73-79.
doi - Kamal D, Abd ElMoteleb AM, Samir R, Saeed M. Epicardial fat thickness can predict severity and multivessel distribution in Egyptian patients with atherosclerotic coronary artery stenosis. Egypt Heart J. 2018;70(4):323-327.
doi pubmed - Sengul C, Cevik C, Ozveren O, Oduncu V, Sunbul A, Akgun T, Can MM, et al. Echocardiographic epicardial fat thickness is associated with carotid intima-media thickness in patients with metabolic syndrome. Echocardiography. 2011;28(8):853-858.
doi pubmed - Kim HM, Kim KJ, Lee HJ, Yu HT, Moon JH, Kang ES, Cha BS, et al. Epicardial adipose tissue thickness is an indicator for coronary artery stenosis in asymptomatic type 2 diabetic patients: its assessment by cardiac magnetic resonance. Cardiovasc Diabetol. 2012;11:83.
doi pubmed - Nasri A, Najafian J, Derakhshandeh SM, Madjlesi F. Epicardial fat thickness and severity of coronary heart disease in patients with diabetes mellitus type II. ARYA Atheroscler. 2018;14(1):32-37.
- Natale F, Tedesco MA, Mocerino R, de Simone V, Di Marco GM, Aronne L, Credendino M, et al. Visceral adiposity and arterial stiffness: echocardiographic epicardial fat thickness reflects, better than waist circumference, carotid arterial stiffness in a large population of hypertensives. Eur J Echocardiogr. 2009;10(4):549-555.
doi pubmed - Nelson MR, Mookadam F, Thota V, Emani U, Al Harthi M, Lester SJ, Cha S, et al. Epicardial fat: an additional measurement for subclinical atherosclerosis and cardiovascular risk stratification? J Am Soc Echocardiogr. 2011;24(3):339-345.
doi pubmed - Sinha SK, Thakur R, Jha MJ, Goel A, Kumar V, Kumar A, Mishra V, et al. Epicardial adipose tissue thickness and its association with the presence and severity of coronary artery disease in clinical setting: a cross-sectional observational study. J Clin Med Res. 2016;8(5):410-419.
doi pubmed - Alexopoulos N, McLean DS, Janik M, Arepalli CD, Stillman AE, Raggi P. Epicardial adipose tissue and coronary artery plaque characteristics. Atherosclerosis. 2010;210(1):150-154.
doi pubmed - Mahabadi AA, Berg MH, Lehmann N, Kalsch H, Bauer M, Kara K, Dragano N, et al. Association of epicardial fat with cardiovascular risk factors and incident myocardial infarction in the general population: the Heinz Nixdorf Recall Study. J Am Coll Cardiol. 2013;61(13):1388-1395.
doi pubmed - Jeong JW, Jeong MH, Yun KH, Oh SK, Park EM, Kim YK, Rhee SJ, et al. Echocardiographic epicardial fat thickness and coronary artery disease. Circ J. 2007;71(4):536-539.
doi pubmed - Manco M, Morandi A, Marigliano M, Rigotti F, Manfredi R, Maffeis C. Epicardial fat, abdominal adiposity and insulin resistance in obese pre-pubertal and early pubertal children. Atherosclerosis. 2013;226(2):490-495.
doi pubmed - De Larochelliere E, Cote J, Gilbert G, Bibeau K, Ross MK, Dion-Roy V, Pibarot P, et al. Visceral/epicardial adiposity in nonobese and apparently healthy young adults: association with the cardiometabolic profile. Atherosclerosis. 2014;234(1):23-29.
doi pubmed - Cheng VY, Dey D, Tamarappoo B, Nakazato R, Gransar H, Miranda-Peats R, Ramesh A, et al. Pericardial fat burden on ECG-gated noncontrast CT in asymptomatic patients who subsequently experience adverse cardiovascular events. JACC Cardiovasc Imaging. 2010;3(4):352-360.
doi pubmed - Chun H, Suh E, Byun AR, Park HR, Shim KW. Epicardial fat thickness is associated to type 2 diabetes mellitus in Korean men: a cross-sectional study. Cardiovasc Diabetol. 2015;14:46.
doi pubmed - Iacobellis G, Leonetti F. Epicardial adipose tissue and insulin resistance in obese subjects. J Clin Endocrinol Metab. 2005;90(11):6300-6302.
doi pubmed - Willens HJ, Gomez-Marin O, Chirinos JA, Goldberg R, Lowery MH, Iacobellis G. Comparison of epicardial and pericardial fat thickness assessed by echocardiography in African American and non-Hispanic White men: a pilot study. Ethn Dis. 2008;18(3):311-316.
This article is distributed under the terms of the Creative Commons Attribution Non-Commercial 4.0 International License, which permits unrestricted non-commercial use, distribution, and reproduction in any medium, provided the original work is properly cited.
Journal of Endocrinology and Metabolism is published by Elmer Press Inc.