

| Journal of Endocrinology and Metabolism, ISSN 1923-2861 print, 1923-287X online, Open Access |
| Article copyright, the authors; Journal compilation copyright, J Endocrinol Metab and Elmer Press Inc |
| Journal website http://www.jofem.org |
Original Article
Volume 2, Number 2, April 2012, pages 88-95
Derivation and Validation of a Risk Index to Predict All-Cause Mortality in Type 2 Diabetes Mellitus
Christine Xia Wua, b, Woan Shin Tana, Matthias Paul Han Sim Toha, Bee Hoon Henga
aHealth Services and Outcomes Research, National Healthcare Group, Singapore
bCorresponding author: Christine Xia Wu, Health Services and Outcomes Research, National Healthcare Group, 6 Commonwealth Lane, #04-01/02 GMTI Building, 149547, Singapore
Manuscript accepted for publication February 3, 2012
Short title: Derivation and Validation of Risk Index
doi: https://doi.org/10.14740/jem67w
| Abstract | ▴Top |
Background: Type 2 Diabetes Mellitus with severe complications have higher risk of mortality. An easy-to-use risk index to quantify the risk of mortality would help clinicians identify patients who might benefit from more intensive therapy. The study aims to develop a risk index to predict all-cause mortality for a cohort of T2DM patients seen at primary care clinics in Singapore.
Methods: In a retrospective cohort study, 28 patient-level variables were extracted from an automated clinical and administrative registry for T2DM who had at least 2 visits to the same National Healthcare Group Polyclinic in 2007. Demographic characteristics, inpatient and outpatient diagnoses, laboratory results and prescription were included. Mortality data were provided by the Ministry of Health. We used a split-sample design to derive and validate an index to predict the risk of death within 2 years of the index attendance. The c-statistic was used to assess model discrimination.
Results: Out of the 59,747 patients in the study, 2,977 (5%) patients died during the 2-year follow up. Age (“A”); diabetes-related complications (Diabetes Complication Severity Index) (“C”); and cancer history (“C”) were found to independently predict all-cause mortality (from which the mnemonic “ACC” was derived). The ACC risk index ranged from 0 to 20 with expected risk of mortality of 0.3% to 80.6%. The discriminatory accuracy of the ACC risk index for the validation data is excellent (c-statistic 0.83, 95% CI 0.82 - 0.84).
Conclusion: A simple risk index for all-cause mortality was successfully developed, and validated using routinely collected registry data. The risk index can be used to stratify T2 DM patients into varying risk of mortality. Further external validation of the risk index is needed before using it in a clinical setting.
Keywords: Type 2 Diabetes Mellitus; Diabetes-related complications; Mortality; Risk index
| Introduction | ▴Top |
The prevalence of diabetes mellitus and the burden of disease have increased rapidly worldwide. Globally, 346 million individuals have diabetes [1], and is the fifth leading cause of death [2]. The excess global mortality attributed to diabetes was estimated to be 2.9 million deaths, equivalent to 5.2% of all deaths [2]. The World Health Organization projects that diabetes deaths will double between 2005 and 2030 [1]. In Singapore, the prevalence of diabetes mellitus in adults aged between 18 and 69 years rose to a high of 11.3% in 2010 from 8.2% in 2004 [3]. Currently, it accounts for 3.0 % of annual total mortality in Singapore and is the 8th leading cause of death [4].
Diabetes mellitus is a complex chronic illness that is strongly associated with increased risk of microvascular and macrovascular complications, and premature death. Cardiovascular diseases account for 65% of mortality from diabetes [5]. Tertiary prevention aimed at treating the late stages can minimize morbidity caused by associated complications. It is therefore logical to utilize information about the stage of diabetes that patients are in to identify mortality risk. Being able to accurately predict this adverse outcome would allow clinicians to focus resources, and to tailor more intensive programs for high-risk groups.
Several studies have examined the association between diabetes complications and mortality [6-7]. These models have sought to specify the factors influencing mortality rather than to predict the outcome of interest with a high degree of accuracy. Other models predicting the mortality risk of patients with T2DM have been published [8-9] but only one prediction algorithm was developed using an Asian population [10]. Although the model discrimination was excellent, the authors drew the study sample from a diabetes registry comprising hospitalized patients, which may limit the generalizability of the model. Additionally, the model has not yet been validated on an external sample.
Currently, there is no widely accepted diabetes risk prediction score ready for use in routine clinical practice in the community. Therefore, we aim to derive and validate a clinically easy-to-use index using data from a large registry to quantify the risk of all-cause mortality for patients diagnosed with Type 2 Diabetes Mellitus (T2DM) in Singapore.
| Methods | ▴Top |
Study design
In Singapore, private practitioners provide 80% of primary healthcare services while government polyclinics provide the remaining 20% at heavily subsidized rates. Currently, low-income elderly individuals are also eligible to receive subsidized treatment for selected chronic diseases at private general practitioner clinics. The National Healthcare Group Polyclinics (NHGP) is a government primary care provider organization with a service load of 3.7million attendances in 2010, which accounted for 60% of all public sector primary care attendances. The NHGP provides primary health care services ranging from management of acute and chronic medical conditions, health education, childhood immunization, health screening and vaccinations, X-ray and laboratory services to minor surgical procedures.
We conducted a retrospective cohort study of T2DM patients receiving care from the nine NHGP clinics. Data were extracted from the National Healthcare Group diabetes registry. The registry was established in 2005 and links administrative and clinical data of patients with diabetes mellitus. Diagnosis of T2DM was based on the International Classification of Diseases Ninth Revision (ICD-9-CM) with diagnostic codes (250.x0, 250.x2, 357.2 or 362.xx) augmented by pharmacy medication records and laboratory records [11].
In Singapore, patients are free to choose providers within the government or private clinics. Due to this non-captive system, eligibility for the study was restricted to patients with at least two attendances at each of the clinics in 2007. This attribution rule was set up to enable the identification of patients at high mortality risk receiving care from the polyclinics who may benefit from customized therapy.
We chose a 2-year time frame for our primary outcome of all-cause mortality to increase the likelihood that it is remediable. To determine whether patients had died within 2 years of their last visit in 2007 to NHGP, data was obtained from the Registry of Deaths, Singapore Ministry of Health (MOH). This was matched with data extracted from the diabetes registry using the National Registration Identification Card (NRIC) number, which is an alphanumeric identifier unique to each individual Singapore resident. Dichotomous dependent variables were created to indicate whether the patient was dead or alive at 2-years. We also report cause-specific deaths classified according to the ICD-9-CM code.
In addition to clinical judgment, predictors found to be significant in literature [8, 10, 12] and which are available in our database were included: demographic characteristics (age, gender and race); blood glucose control (glycosylated hemoglobin); cardiovascular risk control (LDL-cholesterol, high-density lipoprotein cholesterol, triglycerides, systolic and diastolic blood pressure, body mass index, diagnosis of hypertension and dyslipidaemia); kidney function (estimated glomerular filtration rate); and treatment regime (use of insulin or any regimen that includes insulin).
We quantified the severity of diabetes-related complications using the 13-point Disease Complication Severity Index (DCSI) [8]. We chose this index because it has been shown to perform better than using only the number of complications. The DCSI comprises 7 categories of complications and their severity levels (Fig. 1): retinopathy, nephropathy, neuropathy, cerebrovascular, cardiovascular, peripheral vascular disease and metabolic. The DCSI is categorized into 2 or 3 levels for each group (no abnormality = 0, abnormality = 1 and severe abnormality = 2), depending on the presence and severity of the complication. Complications were identified using ICD-9-CM codes and laboratory data based on inpatient and outpatient encounters registered in the diabetes registry. As the DCSI did not include cancer as a co-morbid condition, we have included history of cancer as a candidate predictor. The history of cancer was defined using ICD-9-CM codes with range 140.xx to 239.xx.
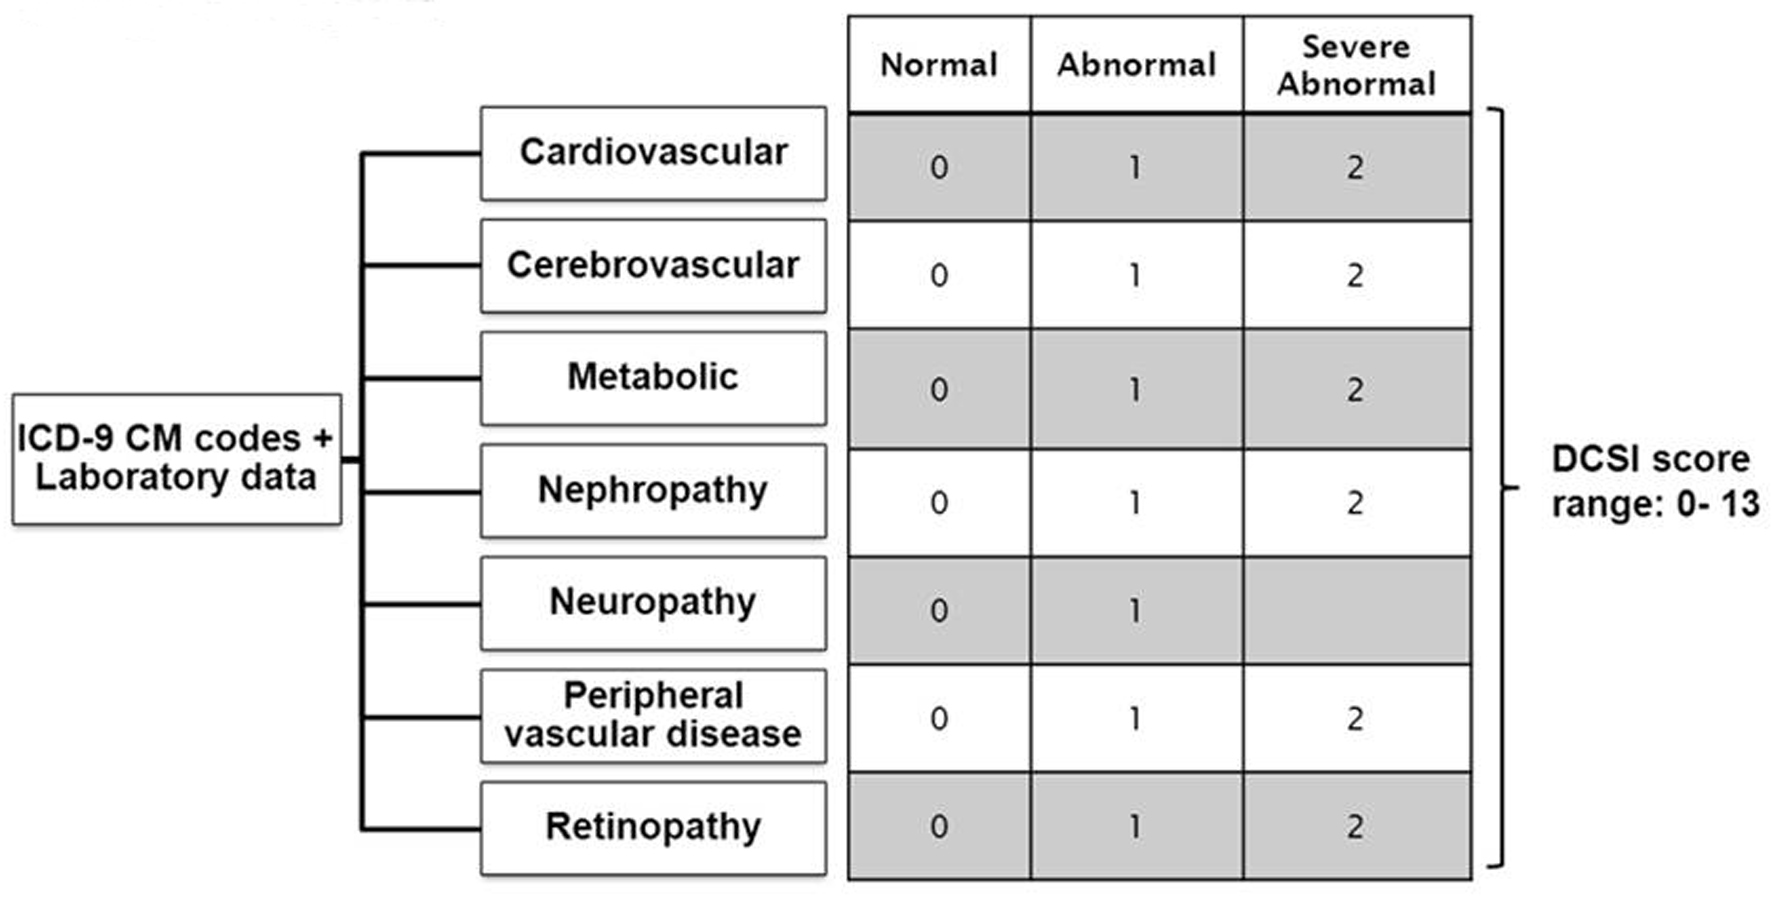 Click for large image | Figure 1. Constructing Diabetes Complication Severity Index in Chronic Disease Management System. *ICD-9 CM codes indicate International Classification of Disease, Ninth Revision, Clinical Modification. *Severity index is based on a severity scale for each complication (ICD-9 CM codes) as follows: 0 = normal, 1 = abnormal, 2 = severe abnormal. *Diabetes complication severity score was developed and validated by Yong et al, 2008 [8]. |
This study was approved by the Institution’s Research Ethics Committee.
Index derivation and internal validation
We divided the sample into 2 groups: training data to derive the risk index for all-cause mortality of T2DM patients and validation data to validate the index. We randomly selected half of the patients for index derivation and used the other half for validation. As missing data is a common problem for routinely collected clinical data and the derived risk index should be applicable to an entire population including those with missing data, a category “missing” was created for several key predictors. Continuous predictors were converted to ordered categorical variables for this purpose [13-14]. We also used fractional polynomial functions to determine the best linear or nonlinear form for the continuous predictors [15-17].
In the derivation data set, we examined the collinearity between the predictors. All remaining predictors were analyzed using multivariable logistic regression. We used backward stepping elimination (p < 0.05 to retain) to determine which predictors remained significant predictors of mortality. This process yielded a model with 9 independent risk factors for mortality. Due to the large sample size, many of the predictors were significantly associated with mortality, but only marginally improved the predictive accuracy of the model. To further simplify the model, while minimizing losses in predictive ability, we used the Schwarz Bayesian Information Criterion (BIC) to select the best model with the minimum BIC value. As the BIC penalizes the log likelihood of a model (a measure of its fit) by a factor related to the number of predictor variables in the model (a measure of its complexity) [18], we obtained a parsimonious final model with 3 predictor variables.
We then transformed the final logistic model into a risk index using the Framingham study risk score method [19]. We organized the final 3 predictors into categories and determined the reference value for each and computed how far each category of each predictor is from the reference value (Wij –WiRef). The number of points equaled its regression coefficient multiplied by (Wij –WiRef) divided by the constant in the model with the smallest absolute value rounded to the nearest whole number. We then calculated each patient’s final score by summing up the points.
To assess the predictive accuracy of the risk index, we used calibration and discrimination to measure the prediction ability. We assessed the calibration of the score by comparing the observed and expected numbers of patients with the outcome for each score. We summarized overall calibration using a Hosmer-Lemeshow goodness-of-fit test. C-statistic with 95% confidence intervals (CIs) was used to measure the ability of the index to discriminate between patients who died or are still alive. We calculated the sensitivity and specificity of the risk score for deaths over the 2-year follow up period. All analyses were performed using PASW version 18.0.
| Results | ▴Top |
The study population comprised 59,767 T2DM patients who had received diabetes care at least twice in the same primary care clinic in 2007. A total of 2,977 (5.0%) patients died during 2-year follow-up period. Of these, 1,123 (37.8%) deaths were due to diseases of circulatory system; 803 (30.0%) deaths were due to diseases of neoplasm; 435 (14.6%) deaths were due to diseases of respiratory system; and 192 (6.5%) deaths were due to diseases of genitourinary system.
Characteristics of the patients
The study cohort is described in Table 1. Patients had a mean age 63 ± standard deviation of 11.9 years. A majority of the patients were Chinese (70.7%), female (53.7%), have hypertension (78.8%) and dyslipidemia (95.5%). Three percent had reported cancer history. The mean DCSI score was 0.9. 33,227 (55.6%) had DCSI score of 0; 12,272 (20.5%) had a DCSI score of 1; 7,970 (13. 3%) had score of 2; 3,123 (5.2%) had DCSI score of 3; 1,783 (3.0%) had DCSI score of 4 and 1,392 (2.3%) had DCSI score of 5 or more.
 Click to view | Table 1. Characteristics of Type 2 Diabetes Mellitus in National Healthcare Group Polyclinics in 2007 |
Patient profiles in the derivation and validation cohorts were similar. The derivation cohort consisted of 29,890 (mortality: 5.0% or 1,490 deaths) patients while the validation cohort consisted of 29,887 (mortality: 5.0% or 1,487 deaths) patients.
Index derivation and internal validation
Age, cancer history, DCSI, HbA1c, hypertension, eGFR, insulin use and hospitalization during previous 1 year were significant predictors. To further simplify the model, while minimizing losses in predictive ability, we used the Schwarz Bayesian Information Criterion (BIC) to select the best model with the minimum BIC value. Only three variables were finally selected in the derivation cohort to predict the risk of all-cause mortality. These predictors in the final logistic model (Table 2) were Age (“A”), cancer history (“C”) and diabetes-related complications (as measured using the DCSI) (“C”). As patient’s age increases, the risk of mortality also grows (odds ratio (OR) = 1.07, 95% CI = 1.06, 1.07). Patients with a history of cancer also have higher risk of mortality than those with no cancer history (OR = 6.97, 95% CI = 5.81, 8.36). Compared with patients who had no complications, those with score 1 or more had a significantly higher risk of death. The calibration of the model was acceptable, with close agreement between the observed mortality in the derivation and validation cohorts (Hosmer-Lemeshow goodness of fit statistic 14.50, 8 degrees of freedom, P = 0.07). The discrimination of the model was excellent with a c-statistic of 0.837 (95% CI = 0.826, 0.847) in the derivation cohort and 0.833 in the validation cohort (95% CI = 0.822, 0.844). C-statistics is 0.72 (95% CI = 0.70, 0.74) with DCSI alone.
Click to view | Table 2. Final Logistic Regression Model for Risk of Mortality (Derivation Group Only, n = 29,877) |
We constructed an index to predict 2-year mortality by assigning scores to each of the three predictors (Table 3). For simplicity, we titled the index using the mnemonic “ACC”. A risk index was calculated for each patient by adding the points for each risks factor present. For example, a 60-year-old (5 points) with cancer history (5 points) with DCSI score 5 (7 points) would have a total risk score of 17 points. The ACC index had a potential score ranging from 0 to 20. The ACC score was strongly associated with the outcome. A 1-point increase in the ACC score increased the odds of mortality by 48% (odds ratio 1.48, 95% CI 1.45 - 1.50). The ACC index had excellent discrimination for predicting mortality (c-statistic 0.827, 95% CI = 0.816, 0.838) in derivation cohort and 0.830 in validation cohort (95% CI = 0.819, 0.840).
Click to view | Table 3. ACC Index for the Quantification of Risk of 2-Year All-Cause Mortality |
The expected probability of 2-year mortality for the validation cohort ranged from 0.3% for an ACC score of 0 to 86.9% for an ACC score of 20 (Table 4). Higher scores indicate greater risk for all-cause death. We identified an optimal cut off (sensitivity is 77.3% and specificity is 73.6%) for defining high-risk patients as those who scored higher than 7 based on the ACC index. Patients at high risk for all-cause death accounted for 29.3% of the cohort. High-risk patients had a mean age 74 ± standard deviation of 8.8 years; of this group, 88.1% had at least one diabetes related-complication and 9.8% had cancer history. Among the low-risk patients, they had mean age of 58 ± standard deviation of 9.9 years, 26.3% had at least one diabetes-related complication and 0.1% had cancer history.
Click to view | Table 4. Sensitivity-Specificity Tradeoff |
| Discussion | ▴Top |
Diabetes mellitus is a complicated chronic condition that raises the risk of mortality for patients. In developed countries, excess mortality attributable to diabetes accounted for 8% of all deaths [2]. Therefore, the outcome of all-cause mortality predicted by the index is highly relevant. The ACC index created has good calibration and excellent discriminatory ability (c-statistic 0.83) for predicting 2-year all cause mortality risk among patients with T2DM. We identified age, history of cancer, and diabetes complication severity index (DCSI) as independent predictors of death.
Diabetes is the leading cause of blindness, end-stage renal failure, non-traumatic limb amputations, and cardiovascular morbidity [20]. Studies have examined the association of mortality with the predictors using individual conditions in their models. A US study showed that macrovascular disease and worsening levels of nephropathy, neuropathy, and retinopathy are individually associated with progressively increasing risks of mortality [6]. Our results corroborated with the findings of Young et al. We found the concurrent risk of diabetes complications measured by the Diabetes Complications Severity Index (DCSI) to strongly predict mortality. Young et al. reported a c-statistic of 0.76 for a 4-year all cause mortality prediction model that incorporated the DCSI in addition to socioeconomic variables, duration of diabetes, smoking habit, body mass index, and insulin therapy.
The ACC index incorporated a history of cancer. A Hong Kong study similarly found cancer to significantly predict 5-year all cause mortality in patients with T2DM with a hazard ratio of 3.81[10]. A large cohort study comprising individuals in the Asia-Pacific region examined the relationship between diabetes mellitus and cancer. The results found diabetes to increase the risk of mortality from all-cause cancer by 23% compared with those without the disorder [21].
The ACC index has several strengths to support its use. Notably, the study included a large sample size (n =59,767). Despite its relatively simple construction, the ACC index demonstrated good discrimination ability in the derivation and validation cohorts. This simple tool has also been developed on a multi-ethnic Asian population. If the prediction tool performs well in other T2DM cohorts, it can be generalized to guide health care providers on resource allocation decisions for the management of T2DM in Asia. Since the majority of patients with diabetes receive routine care from primary care providers, they face the important task of implementing the appropriate standard of care. Complications of diabetes can be preventable by comprehensive risk reduction [22]. As the ACC index was built upon readily available demographic data, clinical history and diabetes complications, it can be easily deployed to support the categorization of patients according to their risk profile as part of clinical care. Tertiary prevention and treatment programs can then be tailored for patients at high-risk of mortality so as to modify the risk factors with the goal of improving survival.
Our study has some limitations. First, government polyclinics account for 20% of all primary care attendances. This may limit the generalizability of the study. However, the representativeness of our sample is supported given that the government polyclinics were found to manage a disproportionately higher share of chronic conditions (43%) [4]. Second, in Singapore, patients are able to transit freely between and within the private and public health care sectors. Baseline variables such as insulin therapy and health services utilization in the last one-year may be biased if they were receiving care outside of the National Healthcare Group system because it is not captured in our diabetes registry. Third, apart from the variables collected routinely in the diabetes registry, other factors such as the duration of diabetes which may predict mortality were excluded. Lastly, the index cannot be used reliably in other patient populations that were not involved in its derivation. Further work is required to externally validate the index before using it in clinical settings.
Conclusion
This study shows that a simple ACC index can use readily available data from a registry to accurately predict the risk of mortality for T2DM patients. This simple ACC index may facilitate risk stratification for T2DM patients. We believe that the ACC index can be used to identify T2DM patients who need more intensive care management to prevent the risk of early death.
Conflict of Interest and Ethics Statements
This manuscript was prepared without any contract or funding from a sponsor. The authors state that the study has been approved by NHG Domain Specific Review Board (DSRB).
| References | ▴Top |
- www.who.int/mediacentre/factsheets/fs312/en of 17 of 30 Nov 2011 0900 hrs.
- Roglic G, Unwin N, Bennett PH, Mathers C, Tuomilehto J, Nag S, Connolly V, et al. The burden of mortality attributable to diabetes: realistic estimates for the year 2000. Diabetes Care. 2005;28(9):2130-2135.
pubmed doi - www.channelnewsasia.com/stories/singaporelocalnews/view/1095709/1/.html of 30 Nov 2011 0930 hrs.
- Integrated Health Service Division, Ministry of Health. Primary Care Survey 2005. Singapore: Ministry of Health.
- Geiss LS, Herman WH, Smith PJ. Mortality in non-insulin-dependent diabetes. In: Harris MI, Cowie CC, Stern MP, et al., eds. Diabetes in America, 2nd ed. Washington, DC: National Diabetes Data Group, National Institutes of Health, National Institute of Diabetes and Digestive and Kidney Diseases 1995:233–257.
- Cusick M, Meleth AD, Agron E, Fisher MR, Reed GF, Knatterud GL, Barton FB, et al. Associations of mortality and diabetes complications in patients with type 1 and type 2 diabetes: early treatment diabetic retinopathy study report no. 27. Diabetes Care. 2005;28(3):617-625.
pubmed doi - Sloan FA, Bethel MA, Ruiz D, Jr., Shea AH, Feinglos MN. The growing burden of diabetes mellitus in the US elderly population. Arch Intern Med. 2008;168(2):192-199.
pubmed doi - Young BA, Lin E, Von Korff M, Simon G, Ciechanowski P, Ludman EJ, Everson-Stewart S, et al. Diabetes complications severity index and risk of mortality, hospitalization, and healthcare utilization. Am J Manag Care. 2008;14(1):15-23.
pubmed - Wells BJ, Jain A, Arrigain S, Yu C, Rosenkrans WA, Jr., Kattan MW. Predicting 6-year mortality risk in patients with type 2 diabetes. Diabetes Care. 2008;31(12):2301-2306.
pubmed doi - Yang X, So WY, Tong PC, Ma RC, Kong AP, Lam CW, Ho CS, et al. Development and validation of an all-cause mortality risk score in type 2 diabetes. Arch Intern Med. 2008;168(5):451-457.
pubmed doi - Toh MP, Leong HS, Lim BK. Development of a diabetes registry to improve quality of care in the National Healthcare Group in Singapore. Ann Acad Med Singapore. 2009;38(6):546-546.
pubmed - Wild SH. Diabetes, treatments for diabetes and their effect on cancer incidence and mortality: attempts to disentangle the web of associations. Diabetologia. 2011;54(7):1589-1592.
pubmed doi - Cohen J, Cohen P, Stephen G. Applied Multiple Regression/Correlation Analysis for the Behavioral Sciences (3rd Ed.). Mahwah, NJ: Lawrence Erlbaum Associates 2003, pp 435-436.
- Selby JV, Karter AJ, Ackerson LM, Ferrara A, Liu J. Developing a prediction rule from automated clinical databases to identify high-risk patients in a large population with diabetes. Diabetes Care. 2001;24(9):1547-1555.
pubmed doi - Royston P, Altman DG. Regression using fractional polynomials of continuous covariates: Parsimonious parametric modelling. Appl Stat 1994; 43:429-467.
- Sauerbrei W, Royston P. Building multivariable prognostic and diagnostic models: transformation of the predictors by using fractional polynomials. J R Stat Soc [Ser A] 1999; 162:71-94.
- Sauerbrei W, Meier-Hirmer C, Benner A, et al. Multivariable regression model building by using fractional polynomials: Description of SAS, STATA and R programs. Comput Stat & Data Anal 2006; 50:3464-3485.
- Hook EB, Regal RR. Validity of methods for model selection, weighting for model uncertainty, and small sample adjustment in capture-recapture estimation. Am J Epidemiol. 1997;145(12):1138-1144.
pubmed - Sullivan LM, Massaro JM, D'Agostino RB, Sr. Presentation of multivariate data for clinical use: The Framingham Study risk score functions. Stat Med. 2004;23(10):1631-1660.
pubmed doi - Greenstein A, Tavakoli M, Mojaddidi M. Microvascular complications: evaluation and monitoring relevance to clinical practice, clinical trials, and drug development. British Journal of Diabetes & Vascular Disease 2007; 7:166.
- Lam EK, Batty GD, Huxley RR, et al. Associations of diabetes mellitus with site-specific cancer mortality in the Asia-Pacific region. Ann Oncol. 2010;10:1093.
- Dagogo-Jack S. Preventing diabetes-related morbidity and mortality in the primary care setting. J Natl Med Assoc. 2002;94(7):549-560.
pubmed
This is an open-access article distributed under the terms of the Creative Commons Attribution License, which permits unrestricted use, distribution, and reproduction in any medium, provided the original work is properly cited.
Journal of Endocrinology and Metabolism is published by Elmer Press Inc.