

| Journal of Endocrinology and Metabolism, ISSN 1923-2861 print, 1923-287X online, Open Access |
| Article copyright, the authors; Journal compilation copyright, J Endocrinol Metab and Elmer Press Inc |
| Journal website http://www.jofem.org |
Original Article
Volume 6, Number 2, April 2016, pages 35-45
Exercise Dose Effects on Insulin Resistance Indicators in Postmenopausal Women: A Randomized Trial
Christine M. Friedenreicha, b, f, Heather K. Neilsona, Qinggang Wanga, Frank Z. Stanczykc, Yutaka Yasuid, Darren R. Brennera, b, Kerry S. Courneyae
aDepartment of Cancer Epidemiology and Prevention Research, CancerControl Alberta, Alberta Health Services, Calgary, Alberta, Canada
bDepartments of Oncology and Community Health Sciences, Cumming School of Medicine, University of Calgary, Calgary, Alberta, Canada
cUniversity of Southern California Keck School of Medicine, Los Angeles, CA, USA
dDepartment of Epidemiology and Cancer Control, St. Jude Children’s Research Hospital, Memphis, TN, USA
eFaculty of Physical Education and Recreation, University of Alberta, Edmonton, Alberta, Canada
fCorresponding Author: Christine Friedenreich, Department of Cancer Epidemiology and Prevention Research, CancerControl Alberta, Alberta Health Services, 2210 2nd St SW, Calgary, Alberta, T2S 3C3, Canada
Manuscript accepted for publication April 07, 2016
Short title: Exercise and Insulin Resistance Indicators
doi: http://dx.doi.org/10.14740/jem341w
| Abstract | ▴Top |
Background: While ≥ 150 minutes/week of moderate-vigorous physical activity is recommended for cancer prevention, the optimal amount for breast cancer prevention is unknown. Insulin resistance is a candidate biomarker of breast cancer risk. The objective of the study was to determine if 300 versus 150 minutes/week of moderate-vigorous aerobic exercise produces stronger improvements in insulin resistance indicators.
Methods: The Breast Cancer and Exercise Trial in Alberta (BETA) was a year-long, two-center, two-armed, randomized controlled exercise trial between June 2010 and June 2013. The setting was a volunteer sample from Calgary and Edmonton, Canada. Participants were 400 inactive, non-diabetic, postmenopausal women with body mass index of 22 - 40 kg/m2. Interventions were 5 days/week aerobic exercise (3 days/week supervised) for 60 minutes/session (high) or 30 minutes/session (moderate) at 65-75% heart rate reserve for ≥ 50% of each session. The main outcome measures were fasting blood concentrations of insulin, glucose, leptin, adiponectin, and resistin measured at baseline, 6 and 12 months.
Results: Dose effects were evaluated using linear mixed models adjusted for baseline biomarker concentrations. High/moderate ratios of geometric mean biomarker concentrations over 12 months ranged from 0.93 to 1.00 (all P-values ≥ 0.05), indicating no dose effect. Among adherent women (n = 137), ratios for insulin, homeostasis model assessment of insulin resistance (HOMA-IR), and leptin were 0.77 - 0.89 (P-values < 0.05), indicating more benefit from the high prescription. There was a significant dose effect (P-value < 0.05) on resistin and leptin in non-obese and younger women, respectively.
Conclusions: Prescribing 300 versus 150 minutes/week of moderate-vigorous aerobic exercise to inactive, non-diabetic, postmenopausal women may not produce stronger changes in insulin resistance indicators. Among exercise-adherers, however, a 300 minutes/week prescription might provide some additional benefit for breast cancer prevention.
Keywords: Breast cancer; Prevention; Exercise; Insulin resistance; Insulin; Adiponectin; Leptin; Resistin; Glucose; HOMA-IR
| Introduction | ▴Top |
In 2015 in Canada, breast cancer was the most commonly diagnosed cancer in females. Of an estimated 25,000 new cases, more than 80% were age 50 or older [1]. Obesity is a known risk factor for postmenopausal breast cancer and also a major risk factor for insulin resistance which may relate causally to breast cancer [2]. Large epidemiologic studies have related insulin resistance indicators in blood to breast cancer incidence [3] and mortality [4].
Overall, epidemiologic research suggests a significantly lower risk of postmenopausal breast cancer in the most versus the least physically active women [5]. While biologic pathways are unclear, insulin sensitivity is commonly proposed [6]. We previously conducted a year-long aerobic exercise trial in non-diabetic, postmenopausal women comparing a 225 min/week prescription to no exercise and found significant decreases in circulating insulin, the homeostasis model assessment of insulin resistance (HOMA-IR) and leptin, but not adiponectin [7], which are proposed biomarkers of postmenopausal breast cancer risk [2, 6]. Few trials have studied exercise effects on resistin [8], which is another candidate biomarker [9].
The optimal amount of physical activity that should be recommended for breast cancer prevention is unknown. The American Cancer Society recommends a minimum of 150 min/week of moderate-intensity activity or 75 min/week of vigorous-intensity activity for cancer prevention overall, with no mention of particular cancer sites [10]. Randomized controlled trials (RCTs) designed specifically to evaluate dose effects would inform cancer prevention guidelines. Such trials have been conducted and measured insulin resistance indicators [11-19]; however, they were limited for informing postmenopausal breast cancer prevention because they were small [12-14], tested lower-intensity exercise [14, 15, 19] or shorter durations of exercise that may be suboptimal for cancer prevention [15, 16], or they did not focus on postmenopausal women [11, 13, 17].
In the Breast Cancer and Exercise Trial in Alberta (BETA), we aimed to determine if a 1-year prescription of 300 versus 150 min/week moderate-vigorous aerobic exercise for inactive, postmenopausal women leads to more favorable changes in proposed biomarkers for breast cancer. The current report focuses on insulin resistance indicators, namely circulating insulin, glucose, HOMA-IR, leptin, adiponectin, and resistin.
| Methods | ▴Top |
Trial overview
Detailed methods for BETA were published previously [20]. BETA was a two-center, two-armed RCT of aerobic exercise in Calgary and Edmonton, Canada between June 2010 and June 2013. The primary outcome was body fat change [21]. Changes in insulin resistance indicators were important secondary outcomes.
Participation
Eligibility criteria were reported previously [20]. In brief, participants were inactive yet able to exercise and demonstrated acceptable heart and lung function in a sub-maximal treadmill test; had no history of cancer except non-melanoma skin cancer, no major co-morbidities (e.g., diabetes), and no recent major reconstructive surgery; were non-users of exogenous hormones, non-smokers, and consumed ≤ 2 drinks of alcohol/day over the past year. Participants were English-speaking, resided in Calgary or Edmonton, not intending to be away > 4 weeks consecutively and 8 weeks total during the year, and not on/starting a weight loss program. The protocol was approved by the Alberta Cancer Research Ethics Committee and Conjoint Health Research Ethics Board, University of Calgary and the Health Research Ethics Board, University of Alberta. All participants provided written informed consent.
Randomization
Four hundred postmenopausal women were randomly assigned 1:1 to 12-month aerobic exercise for 300 (high volume) or 150 (moderate volume) min/week. Randomization was stratified by study center (Calgary/Edmonton) and body mass index (BMI) (< 28.8 or ≥ 28.8 kg/m2 based on the median BMI in our previous trial). Within strata, block sizes of four or six were used to balance the number of participants between arms. The random allocation sequence was generated using R software (version 2.11, 2010, Vienna) and user-defined functions. Allocations were concealed in numbered envelopes prepared by staff unrelated to the study.
Data collection
Data collection methods were described previously [20]. Questionnaires were used to collect demographic and baseline health information at eligibility screening. Eligible participants completed past-year dietary [22] and physical activity [23] questionnaires at baseline and 12 months. For each self-reported activity, we derived MET-hours/week/year using the Compendium of Physical Activities [24]. Sub-maximal fitness tests were conducted at baseline and 12 months using the same protocols and equipment in Calgary and Edmonton. Fitness was assessed using a multistage modified Balke treadmill test [25] until 85% of age-predicted maximum heart rate or volitional exhaustion. VO2max was estimated using the multistage model and American College of Sports Medicine equations for maximum oxygen consumption [26].
On the same day as fitness testing, height and weight were measured by research staff. Full body dual-energy X-ray absorptiometry scans were taken to measure lean mass and total fat mass. Percent body fat was derived as 100% × (fat mass/(fat mass + lean mass)). Computed tomography scans were taken of four single slices at the umbilicus and used by our study radiologist to measure subcutaneous and intra-abdominal fat [21].
Intervention
The intervention began with a 12-week ramp-up to increase exercise volume gradually [20]. The goal was to attain 5 days/week aerobic exercise for 30 (moderate) or 60 min (high) at 65-75% maximum heart rate reserve (“time in zone”) for at least half of each session. To monitor intensity, women were provided Polar® FT4 heart rate monitors (©Polar Electro, Canada) to wear at all sessions. From week 13 to week 52, sessions were supervised by exercise trainers 3 days/week at the Westside Recreation Centre (Calgary) or Behavioural Medicine Fitness Centre, University of Alberta (Edmonton) and were unsupervised/home-based 2 days/week. Weekly logs were maintained by the participants to document exercise type, duration, “time in zone”, average heart rate, and perceived intensity. Trainers kept logs of the same information plus any missed sessions. Participants were asked not to change usual diet.
Blood assays
For each participant, a single blood sample was drawn at baseline, 6, and 12 months after a minimum 10-h fast. The average time between blood sampling and the last exercise session was 2 days. All blood samples were stored at -86 °C in the Alberta Cancer Research Biorepository in Calgary. Insulin and glucose were measured in the laboratory of F.Z.S. (University of Southern California, USA). Insulin was measured by a solid-phase chemiluminescent immunometric assay using the Immulite 2000 analyzer (Siemens Healthcare Diagnostics, Deerfield, IL). The assay sensitivity was 2 µIU/mL. The intra-assay coefficients of variation (CVs) were 5.5% and 3.9% at 7.67 and 26.4 µIU/mL, respectively; inter-assay CVs were 4.2% and 2.9% at 10.0 and 47.8 µIU/mL, respectively. Glucose was measured using a standard procedure on the Vitros Chemistry System. HOMA-IR was calculated as: fasting glucose (mM) × fasting insulin (μIU/mL)/22.5 [27]. Leptin, total adiponectin and resistin were measured at Eve Technologies (Calgary, Canada) using multiplex assays on the Bio-Plex 200 system (Bio-Rad Laboratories Inc., Hercules, CA, USA). Leptin was assessed using the Milliplex® Human Circulating Cancer Biomarker Magnetic Bead Panel (sensitivity, 42.8 pg/mL) and total adiponectin and resistin in the Milliplex® Human Adipokine Magnetic Bead Panel 1 (sensitivity, 21 pg/mL and 4.4 pg/mL, respectively) from EMD Millipore (St. Charles, MO, USA). Intra-assay CVs for leptin, adiponectin and resistin were 6%, 10% and 7%, respectively; inter-assay CVs were 12%, 14% and 12%, respectively. For all assays, quality control samples were included to monitor assay reliability. Blind duplicates were included in and between batches to estimate CVs. Research staff ensured that each participant’s baseline, 6 and 12 months samples were analyzed in the same batch and each batch included an equal number of moderate and high samples. Lab personnel were blinded to intervention assignment.
Statistical analysis
Baseline characteristics were compared between arms using Chi-squared tests for categorical data, t-tests for continuous data, and Wilcoxon rank-sum tests for continuous data that appeared non-normally distributed. Subsequent analyses of biomarker data were performed after logarithmic transformation. Intention-to-treat analyses compared biomarker changes between the two arms using linear mixed models adjusted for baseline biomarker levels. The parameter of interest was “treatment effect ratio”, representing the baseline biomarker-level-adjusted high/moderate ratio of geometric mean biomarker levels over the intervention period (i.e., 6 and 12 months).
For effect modification analyses, these models were stratified by baseline BMI (< or ≥ 30 kg/m2) to identify obesity and baseline age (< or ≥ 60 years) given effect modification in a previous trial [28]. Interaction tests were performed between treatment arm and baseline age and BMI, respectively (as continuous variables) by including cross-products in linear mixed models. Sensitivity analyses excluded women whose past-year caloric intake changed ≥ 500 kcal/day from baseline to 12 months.
A per-protocol analysis was performed including only women who, on average during weeks 13 - 52, were 90-100% adherent in the moderate group (135 - 150 min/week; n = 57) or ≥ 90% adherent in the high group (≥ 270 min/week; n = 79) according to exercise logs.
In separate analyses, we combined intervention arms to examine biomarker changes by quintile of high-intensity minutes/week (“time in zone” from heart rate monitors) averaged over 52 weeks. We fitted a linear model with E (change in logarithm of biomarker value (at 12 months from baseline)) = β1 (logarithm of biomarker value at baseline) + β2kI{high-intensity exercise duration = k-th quintile} as its systematic part, and derived the adjusted mean change in logarithm of biomarker value, β2k, for each quintile of high-intensity exercise duration, adjusted for the logarithm of baseline biomarker value and evaluated at its mean. The percent change in the geometric mean of biomarker values at 12 months from baseline was estimated by (eβ2k - 1) × 100 (%) for the k-th quintile. In tests for linear trend, the quintiles were treated as continuous.
All statistical tests were two-sided with a 0.05 level of significance. Analyses were conducted using SAS version 9.2 (SAS Institute, Cary, NC).
| Results | ▴Top |
Participant recruitment has been described previously [21]. At baseline, all participants were non-diabetic, non-smokers, and hormone therapy non-users. On average participants were overweight and borderline insulin-resistant (Table 1).
 Click to view | Table 1. Baseline Characteristicsa of Randomized Participants in the BETA Trial, Alberta, Canada, 2010 - 2013 |
Median exercise duration (interquartile range) from weeks 13 to 52, after the initial ramp-up period, was 137 (111 - 150) min/week in the moderate group (n = 191) and 254 (166 - 290) min/week in the high group (n = 195); nine and five subjects in the moderate and high groups, respectively, did not complete the trial. On average between baseline and 12 months, estimated VO2max improved significantly more in the high versus moderate group by 1.1 mL/kg/min as well as total body fat by -1.0 kg and subcutaneous abdominal fat area by -10.8 cm2; mean weight loss in the moderate and high group was -1.79 kg (-2.5%) and -2.52 kg (-3.3%), respectively [21]. On average, lean mass did not change in the high group whereas the moderate group experienced a -0.3 kg decrease; intra-abdominal fat area decreased more in the high group by 1.5 cm2; neither difference was statistically significant [21]. Mean changes in energy intake, alcohol, dietary carbohydrate, fat, fiber, and glycemic load did not differ significantly between arms (data not shown).
A number of blood samples were missing or excluded from analyses. Of 400 participants at baseline: 14 were lost to follow-up (n = 9 moderate, n = 5 high); two had insufficient blood volume (n = 1 moderate, glucose/HOMA-IR; n = 1 high, adiponectin/resistin); others were excluded because of extreme outlying values (n = 3 moderate, insulin/HOMA-IR > 40 µIU/mL; n = 3 high, leptin > 200 ng/mL).
In the intention-to-treat analysis, the average 12-month change in insulin, HOMA-IR, leptin, and resistin was slightly more favorable in the high versus moderate group. Yet treatment effect ratios indicated no statistically significant dose effects (Table 2). Average biomarker changes ranged from < 2% for glucose and adiponectin to -21.4% and -23.5% for leptin for the moderate and high groups, respectively. Average changes in HOMA-IR (-10.4%, -11.3%) reflected those of insulin (-8.0%, -10.4%) rather than glucose (-1.7%, -1.0%). Excluding women non-compliant with dietary instructions (caloric intake change ≥ 500 kcal/day) resulted in 163 moderate and 166 high participants and treatment effect ratios (not shown) similar to Table 2.
Click to view | Table 2. High/Moderate Ratio of Geometric Mean Biomarker Levels Over 12 Months, Intention-to-Treat Analysis in the BETA Trial, Alberta, Canada, 2010 - 2013 |
Stratifying by BMI or age revealed dose effects. There was a significant dose effect on resistin (P = 0.04) in non-obese women, with the high group experiencing an average -5.5% decrease in resistin and the moderate group a 3.6% increase (Table 3). A borderline-significant dose effect (P = 0.09) was found for leptin in obese women, such that the high group on average experienced a larger decrease (-25.0% versus -16.4%; Table 3). A statistically significant dose effect was found for leptin in younger women (-27.8% versus -8.7% high versus moderate, P = 0.01; Table 4).
Click to view | Table 3. Intention-to-Treat Analysis Stratified by Categories of Baseline Body Mass Index, BETA Trial, Alberta, Canada, 2010 - 2013 |
Click to view | Table 4. Intention-to-Treat Analysis Stratified by Categories of Baseline Age, BETA Trial, Alberta, Canada, 2010 - 2013 |
Table 5 shows per-protocol analysis results (n = 137 total). Significant dose effects were found for insulin (P = 0.03), glucose (P = 0.03), HOMA-IR (P = 0.02), and leptin (P = 0.002), but not adiponectin or resistin. Average 12-month changes in insulin, HOMA-IR and leptin were 8.5%, 8.5% and 12.0% greater, respectively, for high and moderate adherent groups.
Click to view | Table 5. High/Moderate Ratio of Geometric Mean Biomarker Levels Over 12 Months, Per-Protocol Analysisa in the BETA Trial, Alberta, Canada, 2010 - 2013 |
Significant linear dose-response trends related “time in zone” quintiles to changes in insulin (P-trend = 0.0009), HOMA-IR (P-trend = 0.002), leptin (P-trend < 0.0001), and adiponectin (P-trend = 0.02) but not glucose or resistin. In Figure 1, percent changes in insulin, glucose, HOMA-IR, and leptin were favorable (decreased) for women with average “time in zone” ≥ 57 min/week, whereas for adiponectin and resistin, more “time in zone” was needed for favorable change, i.e., ≥ 111 min/week (adiponectin) or ≥ 143 min/week (resistin).
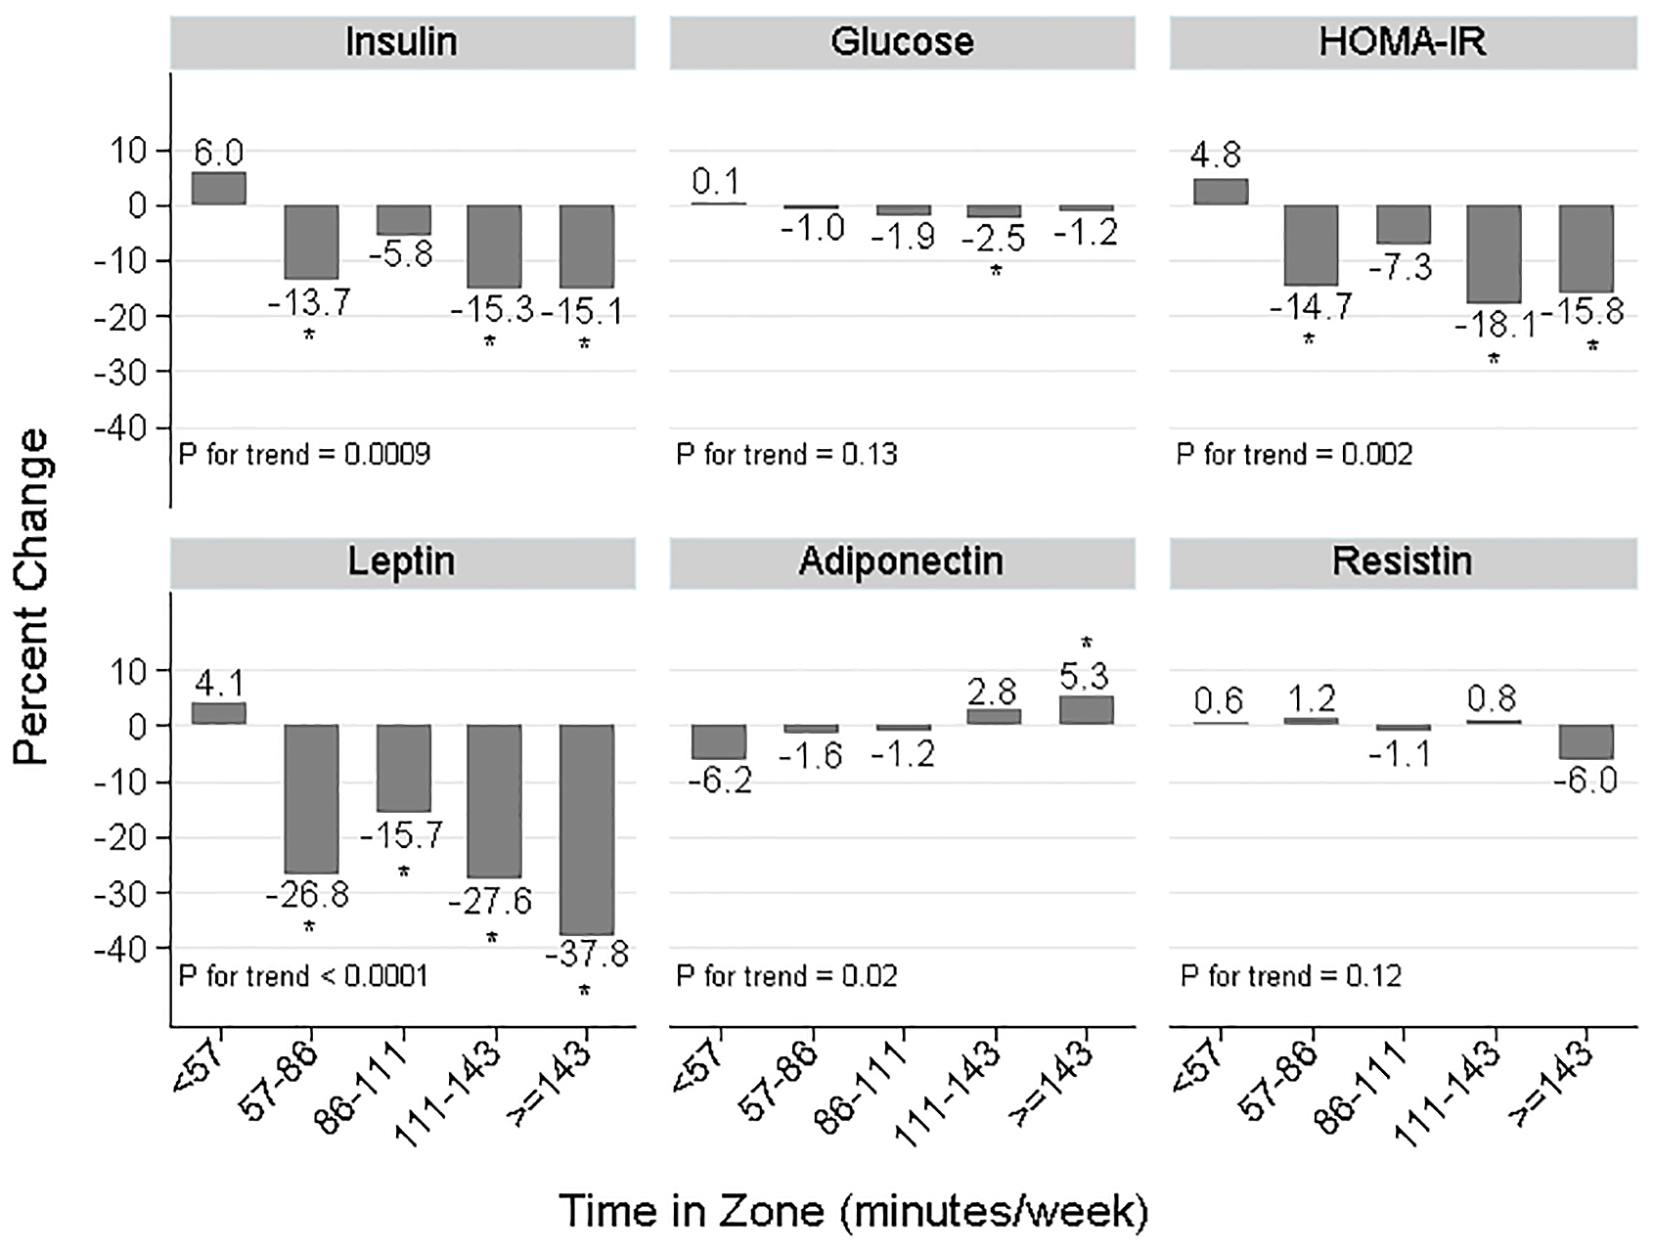 Click for large image | Figure 1. Change in biomarker concentrations across five levels of “time in zone” averaged over 52 weeks, BETA Trial, Alberta, Canada, 2010 - 2013, treatment arms combined. Sample sizes were: n = 77, n = 78, n = 76, n = 77, n = 78 for quintiles 1 to 5, respectively. HOMA-IR: homeostasis model assessment of insulin resistance = fasting glucose (mM) × fasting insulin (μIU/mL)/22.5; “time in zone”: time spent exercising at an intensity of 65-75% maximum heart rate reserve. Statistical testing: *P < 0.05 comparing the least-squares mean biomarker change at that “time in zone” to < 57 min/week, adjusted for baseline biomarker level. P for trend reflects the statistical significance of a linear trend with quintiles of “time in zone” treated as a continuous variable, adjusted for baseline biomarker level. |
| Discussion | ▴Top |
Prescribing 300 min/week of moderate-vigorous aerobic exercise over 12 months to inactive, non-diabetic, postmenopausal women did not improve insulin resistance biomarker concentrations more than prescribing 150 min/week. Both led to average decreases of 8-11% in insulin and HOMA-IR, 21-23% decreases in leptin, and approximately 1-3% changes in glucose, adiponectin, and resistin. When limited to adherent women, however, there were significant dose effects on insulin, HOMA-IR, and leptin concentrations, with 8-12% greater changes occurring with the 300 min/week prescription, on average. There was a borderline-significant dose effect in obese women (BMI ≥ 30 kg/m2) with respect to leptin and a significant dose effect for resistin in non-obese women (BMI < 30 kg/m2) and leptin in younger women (age < 60 years). There were favorable dose-response trends relating minutes/week of vigorous-intensity exercise to changes in insulin, HOMA-IR, leptin, and adiponectin.
Thus far, nine intervention trials in non-diabetic populations were designed to compare weekly durations of exercise and assessed changes in insulin resistance indicators [11-14, 16-19, 29]. However, for reasons described above, these trials were limited for informing postmenopausal breast cancer prevention. Their results overall did not support dose effects on fasting insulin [13, 17-19, 29] or fasting glucose [13, 14, 16, 18, 19], although some findings were suggestive [12, 16, 29]. Only one trial [13] tested an exercise volume as high as BETA. In Project Four-IN-onE (FINE), 11 weeks of aerobic exercise was prescribed to young, overweight men for 7 days/week at 300 kcal/day (n = 18) or 600 kcal/day (n = 18) versus no-exercise controls (n = 17); intensity 3 days/week was > 70% VO2max and 4 days/week was recommended at 50-70% VO2max. While HOMA-IR decreased by 17-18% on average in both exercise groups, peripheral insulin sensitivity (determined using the hyperinsulinemic isoglycemic clamp technique) improved more with the high versus moderate prescription (by 36% versus 28%). Adherence was reported as about 2,000 kcal/week and about 3,800 kcal/week, respectively [13]. Project FINE also included glucose tolerance tests, as did two other RCTs [11, 13, 19]. With these tests, dose effects were observed in FINE [13] and in a four-armed, 24-week trial of men and women by Ross et al [11] in which the highest dose group, averaging 168 min/week aerobic exercise (40.0 min/session × 4.2 days/week) at 75% VO2max experienced the greatest reduction in 2-h glucose. The third RCT (with no dose effect) was a walking intervention [19].
The magnitude of biomarker changes we observed in BETA is comparable to a previous RCT we conducted using similar methods. In that trial, prescribing aerobic exercise for 225 min/week (adherence was 178 min/week [30] targeting 70-80% heart rate reserve) over 12 months to 160 postmenopausal women resulted in average changes of -10.3% in insulin, -11.4% in HOMA-IR, -18.9% in leptin and, as in BETA, no change in glucose or adiponectin [7]. The dose-response to exercise in postmenopausal women (DREW) trial is also noteworthy because it included a large number of postmenopausal women (n = 464). Participants were randomized to a no-exercise control group or to 4, 8, or 12 kcal/kg/week aerobic exercise, 3 - 4 days/week at 50% VO2max for 6 months. Adherence was about 72, 136, and 192 min/week, respectively. On average, fasting insulin and glucose decreased < 2% in each exercise group (derived from [29]) while adiponectin levels pooled across exercise groups, on average, did not change [15]. We are unaware of previous long-term (> 4 weeks) dose-response exercise RCTs that measured leptin or resistin, although exercise RCTs have demonstrated larger leptin decreases for postmenopausal women with higher adherence (e.g., -12% with > 190 min/week, n = 28 [31]; -29.6% with > 225 min/week, n = 47 [7]). We are aware of two walking intervention trials that studied resistin in postmenopausal women. One trial (n = 34) demonstrated an average decrease in resistin concentrations [8]; whereas the other, in type 2 diabetics, showed no change with exercise alone (n = 11) [32].
Understanding how exercise improves insulin sensitivity may help interpret these findings. Exercise can reduce oxidative stress, inflammatory mediators, and the accumulation of lipid intermediates in skeletal muscle, all of which impair insulin signaling [33]. Furthermore contracting skeletal muscle induces GLUT-4 translocation and depletes skeletal muscle glycogen stores, which increase glucose uptake [33]. Exercise can improve pancreatic β-cell function [34]. Exercise effects on body fat are noteworthy since over one-third of BETA participants were obese (BMI ≥ 30 kg/m2) [21]. Obesity is characterized as a chronic, low-level inflammatory state in which adipose tissue is infiltrated with macrophages that release pro-inflammatory cytokines which, in turn, disrupt insulin signaling [35]. White adipose tissue displays endocrine activity producing adipokines such as resistin, leptin, and adiponectin. In humans, resistin is produced mainly by macrophages and monocytes in response to pro-inflammatory cytokines, and itself is pro-inflammatory [35] although in some studies [9, 36] resistin concentrations do not correlate with total body fat. Leptin is an adipocyte-derived hormone involved in energy regulation and is insulin-sensitizing [37]. Leptin concentrations correlate positively with total fat [36] and higher levels are believed to reflect leptin resistance. Leptin production is regulated by insulin and glucose metabolism in adipocytes [37] and activity is enhanced with hyperinsulinemia [2]. Adiponectin is broadly insulin-sensitizing and anti-inflammatory [37] and thus, higher concentrations are desirable. Its production by adipocytes is inhibited by pro-inflammatory factors (e.g., TNF-α, IL-6), hypoxia, and oxidative stress [35]. Low adiponectin concentrations are associated with visceral fatness, which is a risk factor for insulin resistance [36, 38].
There are several possible reasons why we did not observe dose effects in intention-to-treat analyses. First, our per-protocol analyses (Table 5) suggested that the lack of dose effect for insulin, HOMA-IR and leptin was due partly to modest adherence in the high group. The exception was glucose, for which a significant dose effect (treatment effect ratio = 0.98, P = 0.02; Table 5) probably resulted from imbalanced baseline concentrations between arms. Second, fat loss in BETA may have been too low. For instance, the negligible difference in intra-abdominal fat change between groups (mean difference in change, -1.5 cm2 [21]) could explain the lack of dose effect on adiponectin, in particular. The dose-response trend between adiponectin change and “time in zone” (Fig. 1) might reflect visceral fat changes that are only possible with high-intensity exercise, or when weight loss is sufficiently high [39]. The stronger dose effect we observed for leptin in obese women (Table 3) is consistent with this hypothesis since obese women had more fat (and leptin) to lose. Similarly, in women ≥ 60 years, the moderate group had higher baseline leptin concentrations than other subgroups (mean: 40 ng/mL versus 32 - 36 ng/mL) which probably explains the larger decrease (-35.5%; Table 4). Third, Figure 1 suggests the exercise intensity tested in BETA may have been too low to modify resistin levels. Similarly in Table 3, in the high group, average “time in zone” was greater for non-obese versus obese women (131.5 versus 107.3 min/week) which might explain the associated decrease in resistin (-5.5%).
Relative to previous dose-response exercise trials, strengths of BETA include its large sample size, long intervention, close supervision, and excellent retention. BETA was the first RCT designed to compare exercise doses for cancer prevention. There were also limitations. For instance, we did not measure high-molecular weight adiponectin which may be more etiologically relevant than total adiponectin [40]. Furthermore, the timing of blood sampling relative to the last exercise session was not standardized, which could explain some between-subject variability in the biomarker changes we observed; although only 20 participants had blood draws within 24 h of exercise (at baseline, 6, or 12 months) and these participants were represented equally between groups (n = 11 high, n = 9 moderate). Moreover, we did not measure peripheral insulin resistance in muscle or fat, which may be relevant to breast cancer etiology. HOMA-IR reflects hepatic insulin sensitivity and pancreatic β-cell function under basal conditions [27]. While there is good correlation between HOMA-IR and “gold standard” clamp methods for assessing whole-body insulin sensitivity [27], Project FINE [13] demonstrated that dose effects can be found using dynamic measures of insulin resistance, but not fasting blood glucose and insulin.
Conclusions
For inactive, postmenopausal women, prescribing 300 versus 150 min/week of moderate-vigorous aerobic exercise did not lead to stronger changes in circulating insulin resistance indicators. However, there may be dose effects among women who adhere to these exercise prescriptions leading possibly to greater decreases in breast cancer risk. Furthermore, longer durations of vigorous-intensity exercise - perhaps up to twice the amount recommended by the American Cancer Society (75 min/week) - may be necessary to improve adiponectin and resistin concentrations. Yet the associated magnitude of breast cancer risk reduction is unclear, particularly for resistin which is a newly hypothesized biomarker. The 8.5% difference in insulin change between groups in our per-protocol analysis might provide only modest benefit for breast cancer risk, or perhaps more benefit if maintained over many years. For effective disease prevention, this evidence must be weighed carefully against the risk of exercise non-adherence. Future studies could examine the efficacy of resistance exercise or high-intensity aerobic interval training on insulin resistance indicators relative to the higher duration aerobic prescription in BETA.
Acknowledgement
The authors thank Dr Ron Sigal of University of Calgary for assisting with data interpretation and also Mark Fritzler, of Eve Technologies in Calgary, who assisted with data interpretation and conducted blood assays for leptin, resistin, and adiponectin. Calgary Study Coordinators were: Krista Carlson, Sana Fakih, Megan Farris, Quinn Harris, Erica Roberts, and Kristen Simone. Edmonton Study Coordinators were: Natalie Ilkiw and Dr Amy Speed Andrews. Assistance with information sessions was provided in Calgary by Drs Brigid Lynch and Fabiola Aparicio-Ting. Calgary Exercise Trainers were: Carrie Anderson, Alia Bharwani, Shannon Brown, Ashley Cuthbert, Sue Daniel, Julie Gowans, Margo Graham, Erin Korsbrek, Kathleen Kranenburg, Jessica Morrison, Jason Ng, Nicole Slot, Tania White, and Kaila Wright. Edmonton Exercise Trainers were: Arne Anderson, Lisa Belanger, Jennifer Crawford, Cindy Forbes, Alyssa Hindle, Corey Kuzik, Erin McGowan, Mary Norris, Janel Park, Julianne Symons, Linda Trinh, Stephanie Voaklander, and Lynne Wong. Study recruiters were: Jennie Duke, Jasdeep Hayer, Trisha Kelly, Jasmine Lee, and Lilly Mah. Data entry was done by: Sinead Boyle, Barbara Mercer, Carla Quesnel, and Trish Kelly. Biospecimen support was provided by Catherine Munro. Data management, including database creation, questionnaire design, data integrity and quality control, was done by: Dr Steven Szarka, Farit Vakhetov, Wendy Walroth, and Rachel O’Reilly. Abdominal fat was quantified by Dr Aalo Duha, our study radiologist.
Funding
Research relating to this analysis was funded by a research grant from the Alberta Cancer Foundation (#24404). Dr Friedenreich holds a Health Senior Scholar Award from Alberta Innovates-Health Solutions and the Alberta Cancer Foundation Weekend to End Women’s Cancers Breast Cancer Chair. Drs Courneya and Yasui are supported by the Canada Research Chairs Program.
Disclosure Statement
The authors have nothing to disclose.
| References | ▴Top |
- Canadian Cancer Society's Advisory Committee on Cancer Statistics. Canadian Cancer Statistics 2015. Toronto, ON: Canadian Cancer Society; 2015.
- Rose DP, Vona-Davis L. The cellular and molecular mechanisms by which insulin influences breast cancer risk and progression. Endocr Relat Cancer. 2012;19(6):R225-241.
doi pubmed - Gunter MJ, Hoover DR, Yu H, Wassertheil-Smoller S, Rohan TE, Manson JE, Li J, et al. Insulin, insulin-like growth factor-I, and risk of breast cancer in postmenopausal women. J Natl Cancer Inst. 2009;101(1):48-60.
doi pubmed - Goodwin PJ, Ennis M, Pritchard KI, Trudeau ME, Koo J, Madarnas Y, Hartwick W, et al. Fasting insulin and outcome in early-stage breast cancer: results of a prospective cohort study. J Clin Oncol. 2002;20(1):42-51.
doi pubmed - World Cancer Research Fund and American Institute for Cancer Research. Continuous Update Project Report. Food, Nutrition, Physical Activity, and the Prevention of Breast Cancer. World Cancer Research Fund / American Institute for Cancer Research; 2010.
- Patterson RE, Rock CL, Kerr J, Natarajan L, Marshall SJ, Pakiz B, Cadmus-Bertram LA. Metabolism and breast cancer risk: frontiers in research and practice. J Acad Nutr Diet. 2013;113(2):288-296.
doi pubmed - Friedenreich CM, Neilson HK, Woolcott CG, McTiernan A, Wang Q, Ballard-Barbash R, Jones CA, et al. Changes in insulin resistance indicators, IGFs, and adipokines in a year-long trial of aerobic exercise in postmenopausal women. Endocr Relat Cancer. 2011;18(3):357-369.
doi pubmed - Di Blasio A, Ripari P, Bucci I, Di Donato F, Izzicupo P, D'Angelo E, Di Nenno B, et al. Walking training in postmenopause: effects on both spontaneous physical activity and training-induced body adaptations. Menopause. 2012;19(1):23-32.
doi pubmed - Dalamaga M, Karmaniolas K, Papadavid E, Pelekanos N, Sotiropoulos G, Lekka A. Hyperresistinemia is associated with postmenopausal breast cancer. Menopause. 2013;20(8):845-851.
doi pubmed - Kushi LH, Doyle C, McCullough M, Rock CL, Demark-Wahnefried W, Bandera EV, Gapstur S, et al. American Cancer Society Guidelines on nutrition and physical activity for cancer prevention: reducing the risk of cancer with healthy food choices and physical activity. CA Cancer J Clin. 2012;62(1):30-67.
doi pubmed - Ross R, Hudson R, Stotz PJ, Lam M. Effects of exercise amount and intensity on abdominal obesity and glucose tolerance in obese adults: a randomized trial. Ann Intern Med. 2015;162(5):325-334.
doi pubmed - Lera Orsatti F, Nahas EA, Maesta N, Nahas Neto J, Lera Orsatti C, Vannucchi Portari G, Burini RC. Effects of resistance training frequency on body composition and metabolics and inflammatory markers in overweight postmenopausal women. J Sports Med Phys Fitness. 2014;54(3):317-325.
pubmed - Reichkendler MH, Rosenkilde M, Auerbach PL, Agerschou J, Nielsen MB, Kjaer A, Hoejgaard L, et al. Only minor additional metabolic health benefits of high as opposed to moderate dose physical exercise in young, moderately overweight men. Obesity (Silver Spring). 2014;22(5):1220-1232.
doi pubmed - Dalleck LC, Allen BA, Hanson BA, Borresen EC, Erickson ME, De Lap SL. Dose-response relationship between moderate-intensity exercise duration and coronary heart disease risk factors in postmenopausal women. J Womens Health (Larchmt). 2009;18(1):105-113.
doi pubmed - Arsenault BJ, Cote M, Cartier A, Lemieux I, Despres JP, Ross R, Earnest CP, et al. Effect of exercise training on cardiometabolic risk markers among sedentary, but metabolically healthy overweight or obese post-menopausal women with elevated blood pressure. Atherosclerosis. 2009;207(2):530-533.
doi pubmed - Johnson JL, Slentz CA, Houmard JA, Samsa GP, Duscha BD, Aiken LB, McCartney JS, et al. Exercise training amount and intensity effects on metabolic syndrome (from Studies of a Targeted Risk Reduction Intervention through Defined Exercise). Am J Cardiol. 2007;100(12):1759-1766.
doi pubmed - Duncan GE, Perri MG, Anton SD, Limacher MC, Martin AD, Lowenthal DT, Arning E, et al. Effects of exercise on emerging and traditional cardiovascular risk factors. Prev Med. 2004;39(5):894-902.
doi pubmed - Asikainen TM, Miilunpalo S, Oja P, Rinne M, Pasanen M, Uusi-Rasi K, Vuori I. Randomised, controlled walking trials in postmenopausal women: the minimum dose to improve aerobic fitness? Br J Sports Med. 2002;36(3):189-194.
doi pubmed - Asikainen TM, Miilunpalo S, Kukkonen-Harjula K, Nenonen A, Pasanen M, Rinne M, Uusi-Rasi K, et al. Walking trials in postmenopausal women: effect of low doses of exercise and exercise fractionization on coronary risk factors. Scand J Med Sci Sports. 2003;13(5):284-292.
doi pubmed - Friedenreich CM, MacLaughlin S, Neilson HK, Stanczyk FZ, Yasui Y, Duha A, Lynch BM, et al. Study design and methods for the Breast Cancer and Exercise Trial in Alberta (BETA). BMC Cancer. 2014;14:919.
doi pubmed - Friedenreich CM, Neilson HK, O'Reilly R, Duha A, Yasui Y, Morielli AR, Adams SC, et al. Effects of a High vs Moderate Volume of Aerobic Exercise on Adiposity Outcomes in Postmenopausal Women: A Randomized Clinical Trial. JAMA Oncol. 2015;1(6):766-776.
doi pubmed - Csizmadi I, Kahle L, Ullman R, Dawe U, Zimmerman TP, Friedenreich CM, Bryant H, et al. Adaptation and evaluation of the National Cancer Institute's Diet History Questionnaire and nutrient database for Canadian populations. Public Health Nutr. 2007;10(1):88-96.
doi pubmed - Friedenreich CM, Courneya KS, Neilson HK, Matthews CE, Willis G, Irwin M, Troiano R, et al. Reliability and validity of the Past Year Total Physical Activity Questionnaire. Am J Epidemiol. 2006;163(10):959-970.
doi pubmed - Ainsworth BE, Haskell WL, Herrmann SD, Meckes N, Bassett DR, Jr., Tudor-Locke C, Greer JL, et al. 2011 Compendium of Physical Activities: a second update of codes and MET values. Med Sci Sports Exerc. 2011;43(8):1575-1581.
doi pubmed - Pollock ML, Foster C, Schmidt D, Hellman C, Linnerud AC, Ward A. Comparative analysis of physiologic responses to three different maximal graded exercise test protocols in healthy women. Am Heart J. 1982;103(3):363-373.
doi - American College of Sports Medicine. ACSM's Guidelines for Exercise Testing and Prescription. Vol 6. Philadelphia, PA: Lippincott Williams & Wilkins.
- Wallace TM, Levy JC, Matthews DR. Use and abuse of HOMA modeling. Diabetes Care. 2004;27(6):1487-1495.
doi pubmed - Mason C, Foster-Schubert KE, Imayama I, Kong A, Xiao L, Bain C, Campbell KL, et al. Dietary weight loss and exercise effects on insulin resistance in postmenopausal women. Am J Prev Med. 2011;41(4):366-375.
doi pubmed - Earnest CP, Johannsen NM, Swift DL, Lavie CJ, Blair SN, Church TS. Dose effect of cardiorespiratory exercise on metabolic syndrome in postmenopausal women. Am J Cardiol. 2013;111(12):1805-1811.
doi pubmed - Courneya KS, Karvinen KH, McNeely ML, Campbell KL, Brar S, Woolcott CG, McTiernan A, et al. Predictors of adherence to supervised and unsupervised exercise in the Alberta Physical Activity and Breast Cancer Prevention Trial. J Phys Act Health. 2012;9(6):857-866.
pubmed - Frank LL, Sorensen BE, Yasui Y, Tworoger SS, Schwartz RS, Ulrich CM, Irwin ML, et al. Effects of exercise on metabolic risk variables in overweight postmenopausal women: a randomized clinical trial. Obes Res. 2005;13(3):615-625.
doi pubmed - Giannopoulou I, Fernhall B, Carhart R, Weinstock RS, Baynard T, Figueroa A, Kanaley JA. Effects of diet and/or exercise on the adipocytokine and inflammatory cytokine levels of postmenopausal women with type 2 diabetes. Metabolism. 2005;54(7):866-875.
doi pubmed - Buresh R. Exercise and glucose control. J Sports Med Phys Fitness. 2014;54(4):373-382.
pubmed - Solomon TP, Malin SK, Karstoft K, Kashyap SR, Haus JM, Kirwan JP. Pancreatic beta-cell function is a stronger predictor of changes in glycemic control after an aerobic exercise intervention than insulin sensitivity. J Clin Endocrinol Metab. 2013;98(10):4176-4186.
doi pubmed - Ouchi N, Parker JL, Lugus JJ, Walsh K. Adipokines in inflammation and metabolic disease. Nat Rev Immunol. 2011;11(2):85-97.
doi pubmed - Hsieh CJ, Wang PW, Chen TY. The relationship between regional abdominal fat distribution and both insulin resistance and subclinical chronic inflammation in non-diabetic adults. Diabetol Metab Syndr. 2014;6(1):49.
doi pubmed - Havel PJ. Control of energy homeostasis and insulin action by adipocyte hormones: leptin, acylation stimulating protein, and adiponectin. Curr Opin Lipidol. 2002;13(1):51-59.
doi pubmed - Medina-Urrutia A, Posadas-Romero C, Posadas-Sanchez R, Jorge-Galarza E, Villarreal-Molina T, Gonzalez-Salazar Mdel C, Cardoso-Saldana G, et al. Role of adiponectin and free fatty acids on the association between abdominal visceral fat and insulin resistance. Cardiovasc Diabetol. 2015;14:20.
doi pubmed - Wang X, You T, Murphy K, Lyles MF, Nicklas BJ. Addition of Exercise Increases Plasma Adiponectin and Release from Adipose Tissue. Med Sci Sports Exerc. 2015;47(11):2450-2455.
doi pubmed - Guo MM, Duan XN, Cui SD, Tian FG, Cao XC, Geng CZ, Fan ZM, et al. Circulating High-Molecular-Weight (HMW) Adiponectin Level Is Related with Breast Cancer Risk Better than Total Adiponectin: A Case-Control Study. PLoS One. 2015;10(6):e0129246.
doi pubmed
This is an open-access article distributed under the terms of the Creative Commons Attribution-NonCommercial 4.0 International License, which permits unrestricted non-commercial use, distribution, and reproduction in any medium, provided the original work is properly cited.
Journal of Endocrinology and Metabolism is published by Elmer Press Inc.