


| Journal of Endocrinology and Metabolism, ISSN 1923-2861 print, 1923-287X online, Open Access |
| Article copyright, the authors; Journal compilation copyright, J Endocrinol Metab and Elmer Press Inc |
| Journal website http://www.jofem.org |
Original Article
Volume 7, Number 1, February 2017, pages 31-43
Circulating Betatrophin and Hepatocyte Growth Factor in Type 2 Diabetic Patients: Their Relationship With Disease Prognosis
Abdulrahman Abdulwahab Alduraywish
Department of Internal Medicine, College of Medicine, Aljouf University, Sakaka, Al-Jouf, Saudi Arabia
Manuscript accepted for publication February 20, 2017
Short title: Betatrophin and HGF in T2DM
doi: https://doi.org/10.14740/jem405w
| Abstract | ▴Top |
Background: In Saudi Arabia, diabetes established itself as an epidemic that necessitates dissection of its predisposing factors and pathogenesis to set appropriate preventive measures. In a cross-sectional study, relationships between plasma betatrophin (BetaT) and hepatocyte growth factor (HGF) on one side, and, glycemic control, lipogram, anthropometric indices, treatment and prognosis on the other side were assessed in Saudi patients with type 2 diabetes mellitus (T2DM) vs. healthy controls.
Methods: The study voluntarily enrolled 202 T2DM patients (44 males and 158 females) and socioeconomically, age- and body mass index (BMI)-matched 106 healthy participants (71 males and 35 females). All participants were subgrouped according to gender and BMI (< 25 and ≥ 25) and patients were also subgrouped according to disease duration (≤ 5 and > 5 years) and treatment (insulin/non-insulin). Demographic and anthropometric data were anonymously collected. EDTA whole blood for HbA1c and its plasma for bioassays were frozen at -80 °C. Standard procedures and specific immunoassays were employed for biomarkers.
Results: Plasma insulin paralleled BMI and disease duration and was highly significantly different comparing patients and healthy controls. As expected glycemic control and lipogram indices were also highly significantly different comparing patients and healthy controls. Because of the massive individual variation in the plasma levels of each of betatrophin (except for a higher level in patients with lower BMI) and HGF (except for a higher level in females and those with higher BMI among controls), there were non-significant differences comparing patients and healthy controls. Males were more inclined to have more insulin treatment. Surprisingly, the later doubled the disease severity complication score and correlated negatively with plasma HDL-cholesterol. Betatrophin did not show much correlation among controls but correlated negatively with age and cholesterol and positively with BMI and HbA1c in patients. HGF showed very clear negative correlation with age and plasma insulin in patients.
Conclusion: The massive individual variation in plasma content of betatrophin and HGF did allow specific diagnostic/pathogenetic classification for these two hepato-/adipokines. This may reflect gene polymorphism at their gene regulatory sequences and/or resistance correlating insulin resistance. The former is being pursued in our laboratory for patients with distinctly higher and lower levels.
Keywords: Betatrophin; Hepatocyte growth factor; Type 2 diabetes mellitus; Disease prognosis; Saudi Arabia
| Introduction | ▴Top |
Diabetes has reached an epidemic stage as most common endocrine disease with progressive incidence worldwide. In the major type 2 diabetes mellitus (T2DM), improper blood glucose metabolism is caused by impaired insulin secretion and/or insulin resistance (IR). The progressive decline in insulin production by the pancreatic β cells ultimately leading to T2DM is instigated by obesity-associated IR [1, 2]. Actually, T2DM is a magnitude of diseases since it involves abnormalities in 57 genes and 136 single nucleotide polymorphisms that afflict insulin secretion, resistance, signaling, and β-cell dysfunction, along with epigenetic changes due to environmental factors encompassing ethnicity, nutrition, intrauterine surroundings, and obesity. Therefore, personalizing T2DM medication requires detailed genotypic information that considers the ethnicity and environmental background to ensure better management [3]. Moreover, increased saturated fats in cellular membranes were suggested to impair insulin secretion and signaling and glucose uptake [4].
Betatrophin, angiopoietin-like protein (ANGPTL)-8 or lipasin secreted from the liver and adipose tissue controversially was reported to modulate pancreatic β-cell mass and glucose homeostasis reflectable on lipid metabolism. However, it does not have an effect on β-cell replication in human pancreatic islets. Serum betatrophin levels in humans correlate with improved adipose tissue lipid storage and lower serum triglyceride (TAGs) levels in the fed state, but do not correlate with IR or carbohydrate tolerance in humans [5-10]. Lipoprotein lipase (LPL) is determining in the disposal of plasma TAGs where its dysregulation increased incidents of cardiovascular disease and T2DM. One of the key regulators of LPL is betatrophin [11, 12]. Betatrophin may be responsible for the increased plasma TAGs levels in obese and T2DM [13].
Hepatocyte growth factor (HGF) is a mesenchymal-derived pleiotropic factor that regulates growth, motility, and morphogenesis of various cells [14]. HGF is highly expressed in white adipose tissue [15, 16], where it exerts insulin-like effects and stimulates glucose uptake in cultured adipocytes by augmenting the activity of phosphatidylinositol 3-kinase-dependent protein kinase B [17]. In humans, circulating HGF positively correlated with insulin and glucose [18] and is reported to be elevated in obesity [19], metabolic syndrome [18], hypertension [20], and coronary heart disease [21]. HGF may also be involved in the pathogenesis of diabetes [22-24]. However, the biological mechanisms linking HGF to the development of diabetes are not well understood.
We planned to measure plasma levels of betatrophin and HGF in Saudi T2DM patients and correlate them with the glycemic control indices, lipid profile, body mass index (BMI), body shape index (ABSI), gender, disease duration, complication score, and treatment regimen, compared to healthy controls, hoping to highlight their possible pathogenetic/prognostic roles.
| Patients and Methods | ▴Top |
This cross-sectional study was conducted in the College of Medicine, Aljouf University, Sakaka, Saudi Arabia in the period from November 1, 2015 to November 20, 2016. The study enrolled patients and their healthy companions from Prince Meteb General Hospital, Sakaka, Saudi Arabia. For that, it earned an ethical clearance both from Ministry of Health Directorate and from Aljouf University Bioethics Committees. The study voluntarily enrolled consented socioeconomically, age- and BMI-matched normal healthy participants (n = 106) aged 25 - 83 years (42.57 ± 19.53) and T2DM patients (n = 202) aged 23 - 85 years (48.13 ± 26.06). Controls and patients were subdivided according to their gender (male/female; n = 71/35 vs. 44/158) and BMI (˂ 25/≥ 25; n = 32/74 vs. 38/164), respectively. Patients were further subdivided according to their treatment (non-insulin/insulin; 82/120) and disease duration (< 5/≥ 5 years; n = 100/102), respectively. Demographic data, anthropometric indices and disease history were anonymously recorded for each participant. Patients with renal or hepatic failure, immobilization for any reason, acute infections, autoimmune diseases, congenital and hemolytic anemias or with systemic inflammatory diseases were excluded. Patients’ biomarkers were correlated also to their disease severity complication score, where no complications = 0, one complication = 1, two complications = 2, three complications = 3, and, four complications or more = 4 [25], and treatment score, where no treatment = 0, metformin = 1, hypoglycemic/± = 2, and, insulin/± = 3.
Morning fasting blood samples were collected on EDTA. A whole blood aliquot of 100 μL was separated for HbA1c measurement and rest were centrifuged to recover plasma that was frozen in aliquots at -80 °C till used. Age- and gender-stratified BMI (https://www.cdc.gov/healthyweight/assessing/bmi/adult_bmi/metric_bmi_calculator/bmi_calculator.html) and ABSI (http://absi-calc.appspot.com; based on Krakauer and Krakauer, 2012) were calculated from weight, height and waist circumference (WC) of each participant [26].
Fasting lipid profile, TAGs, total cholesterol, LDL-cholesterol (LDL-C), HDL-cholesterol (HDL-C) and glucose were assayed quantitatively using enzymatic colorimetric kits (Human, Gesellschaft fur Biochemica und Diagnostica mbH, Wiesbaden, Germany). ELISA-based quantitative kits with specific standards and antibodies were used to assay human HbA1c and insulin (CEA190Hu/CEA448Hu; Cloud-Clone Corp., Wuhan, Hubei, China), and betatrophin and HGF (SK00528-08/SK00331-02; Aviscera Bioscience, Inc., Santa Clara, CA, USA).
Data were presented as number, range and mean ± SEM. Statistical analysis used Prism 6.0 GraphPad (GraphPad Software, Inc., La Jolla, CA, USA) applying Student’s t-test and one-way ANOVA with Newman-Keuls multiple comparison test. Correlation among parameters within groups was analyzed using Spearman’s non-parametric correlation analysis and r and P values were presented. Significance limit was set at P value of ≤ 0.05.
| Results | ▴Top |
Data of age, ABSI and BMI distribution among all participants
Age
There were no significant differences among all subgroups in age among normal participants except for the two BMI subgroups (BMI ˂ 25 vs. BMI ≥ 25; P ˂ 0.01). Within T2DM patients, comparing the two gender (male vs. female), the two BMI, the two disease duration (≤ 5 vs. ˃ 5 years), or the two treatment (insulin vs. non-insulin) subgroups, there were significant differences in age (P ˂ 0.001). Differences were significant also comparing the whole T2DM group vs. each of the two disease duration subgroups (P ˂ 0.001) and vs. patients on insulin treatment (P ˂ 0.05). Comparing the healthy participants and T2DM patients as whole groups showed non-significant difference; however, their respective males (P ˂ 0.001), their respective females (P ˂ 0.05) and their respective BMI ≥ 25 subgroups (P ˂ 0.05) showed significant differences in age (Fig. 1).
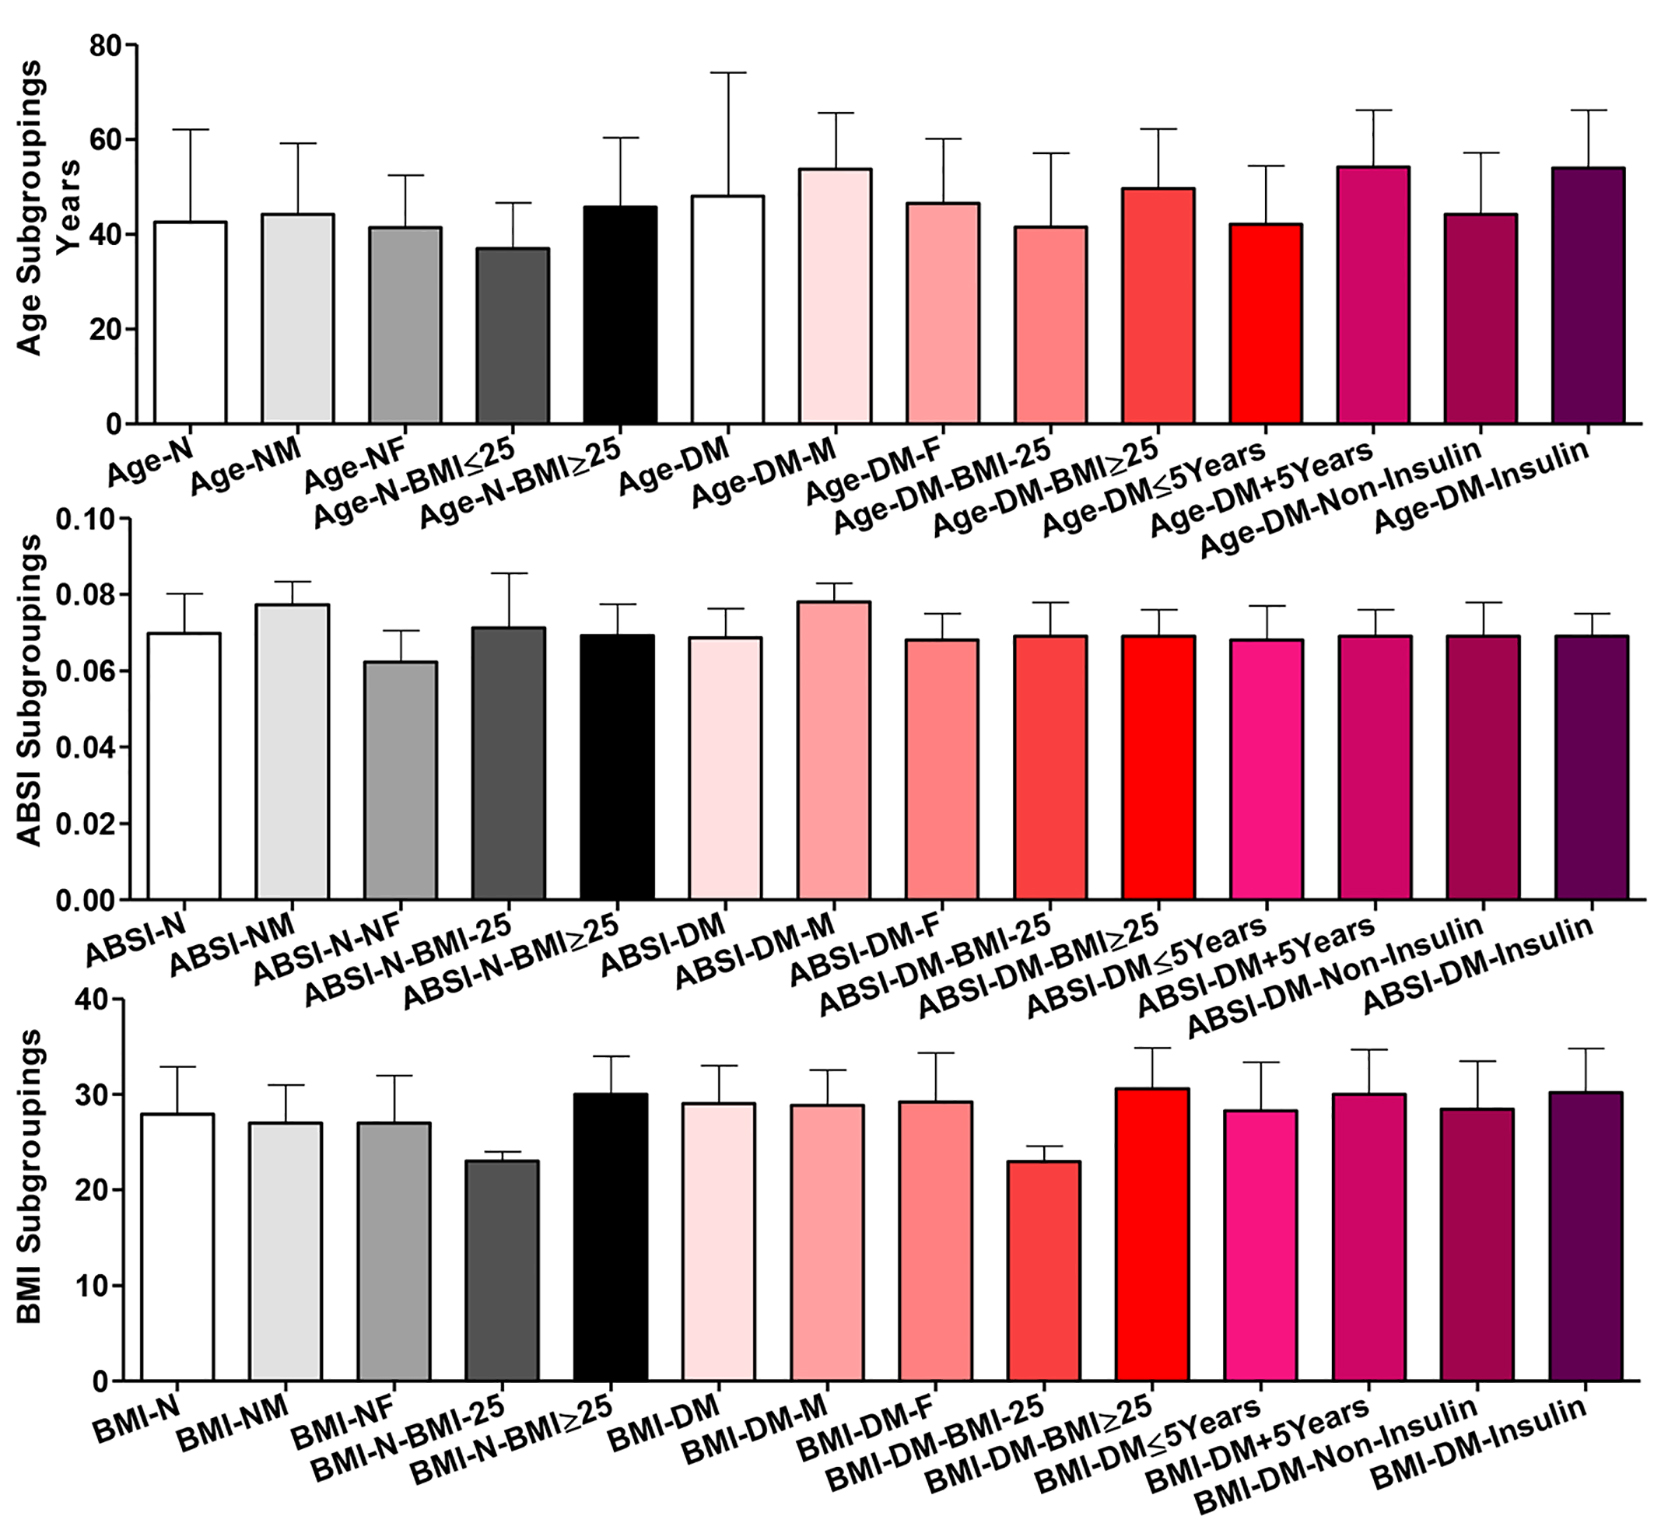 Click for large image | Figure 1. Age, body shape index (ABSI) and body mass index (BMI) distribution among all participants (normal healthy controls = N in black shades and diabetic patients = T2DM in red shades). Participants were subgrouped according to gender (M: male; F: female) and BMI (˂ 25 and ≥ 25). T2DM patients were further subgrouped according to disease duration (≤ 5 and ˃ 5 years) and treatment received (non-insulin and insulin). Data are shown as mean ± SEM. For significance of differences, see the text. |
ABSI
Within normal participants, comparing the whole group and the two BMI subgroups, there were non-significant differences in ABSI, but, comparing the whole group and the two gender subgroups, there were significant differences (whole vs. each of males and females and males vs. females, P ˂ 0.001). Among T2DM patients, only comparing the whole and the two gender subgroups of patients, there were significant differences in ABSI (whole vs. males and males vs. females, P ˂ 0.001). Comparing the two whole groups of healthy participants vs. T2DM patients, their respective males or their respective two BMI subgroups, there were non-significant differences. But their respective females were significantly different in ABSI (P ˂ 0.001).
BMI
Among healthy controls, only comparing the whole and the two BMI subgroups, there were significant differences (whole vs. each of those with BMI ˂ 25, P ˂ 0.001, those with BMI ≥ 25, P ˂ 0.01 and the two BMI subgroups, P ˂ 0.001). Among patients, comparing the whole and the two BMI subgroups of T2DM patients, there were highly significant differences amongst three of them (P ˂ 0.001). For the two disease duration (≤ 5 vs. ˃ 5 years) and the two treatment (insulin vs. non-insulin) subgroups, there was a significant difference in their BMI (P ˂ 0.05). Comparing the whole T2DM patients vs. those on insulin, there was a significant difference (P ˂ 0.05). Comparing the whole normal participants vs. the whole of T2DM patients or their respective BMI subgroups, there were non-significant differences and their respective gender subgroups were mildly significantly different (P ˂ 0.05).
Plasma lipid profile findings among all participants
Fasting plasma total cholesterol
There were non-significant differences among the whole group of healthy participants and their subgroups for gender and BMI in total cholesterol. Similar results were shown among T2DM patients for gender, disease duration and treatment subgroupings. But T2DM patients with BMI ˂ 25 were significantly lower than those with BMI ≥ 25 (P ˂ 0.05) in total cholesterol. Comparing healthy controls vs. T2DM patients as whole groups and as respective gender and BMI subgroups showed highly significant increases in total cholesterol (P ˂ 0.001 for all except the two BMI ˂ 25, P ˂ 0.01).
Fasting plasma LDL-C
Among the whole normal participants and their two gender and BMI subgroups, there were non-significant differences in plasma LDL-C. Similarly, comparing the whole group of T2DM patients and their respective gender, disease duration, or treatment subgroups, there were non-significant differences. But comparing the whole T2DM group vs. the two T2DM BMI subgroups, there were significant differences (whole vs. BMI ˂ 25 and BMI ˂ 25 vs. BMI ≥ 25; P ˂ 0.05). Comparing T2DM patients vs. normal controls and their respective gender or BMI subgroups, there were significant increases in LDL-C (P ˂ 0.001) (Fig. 2).
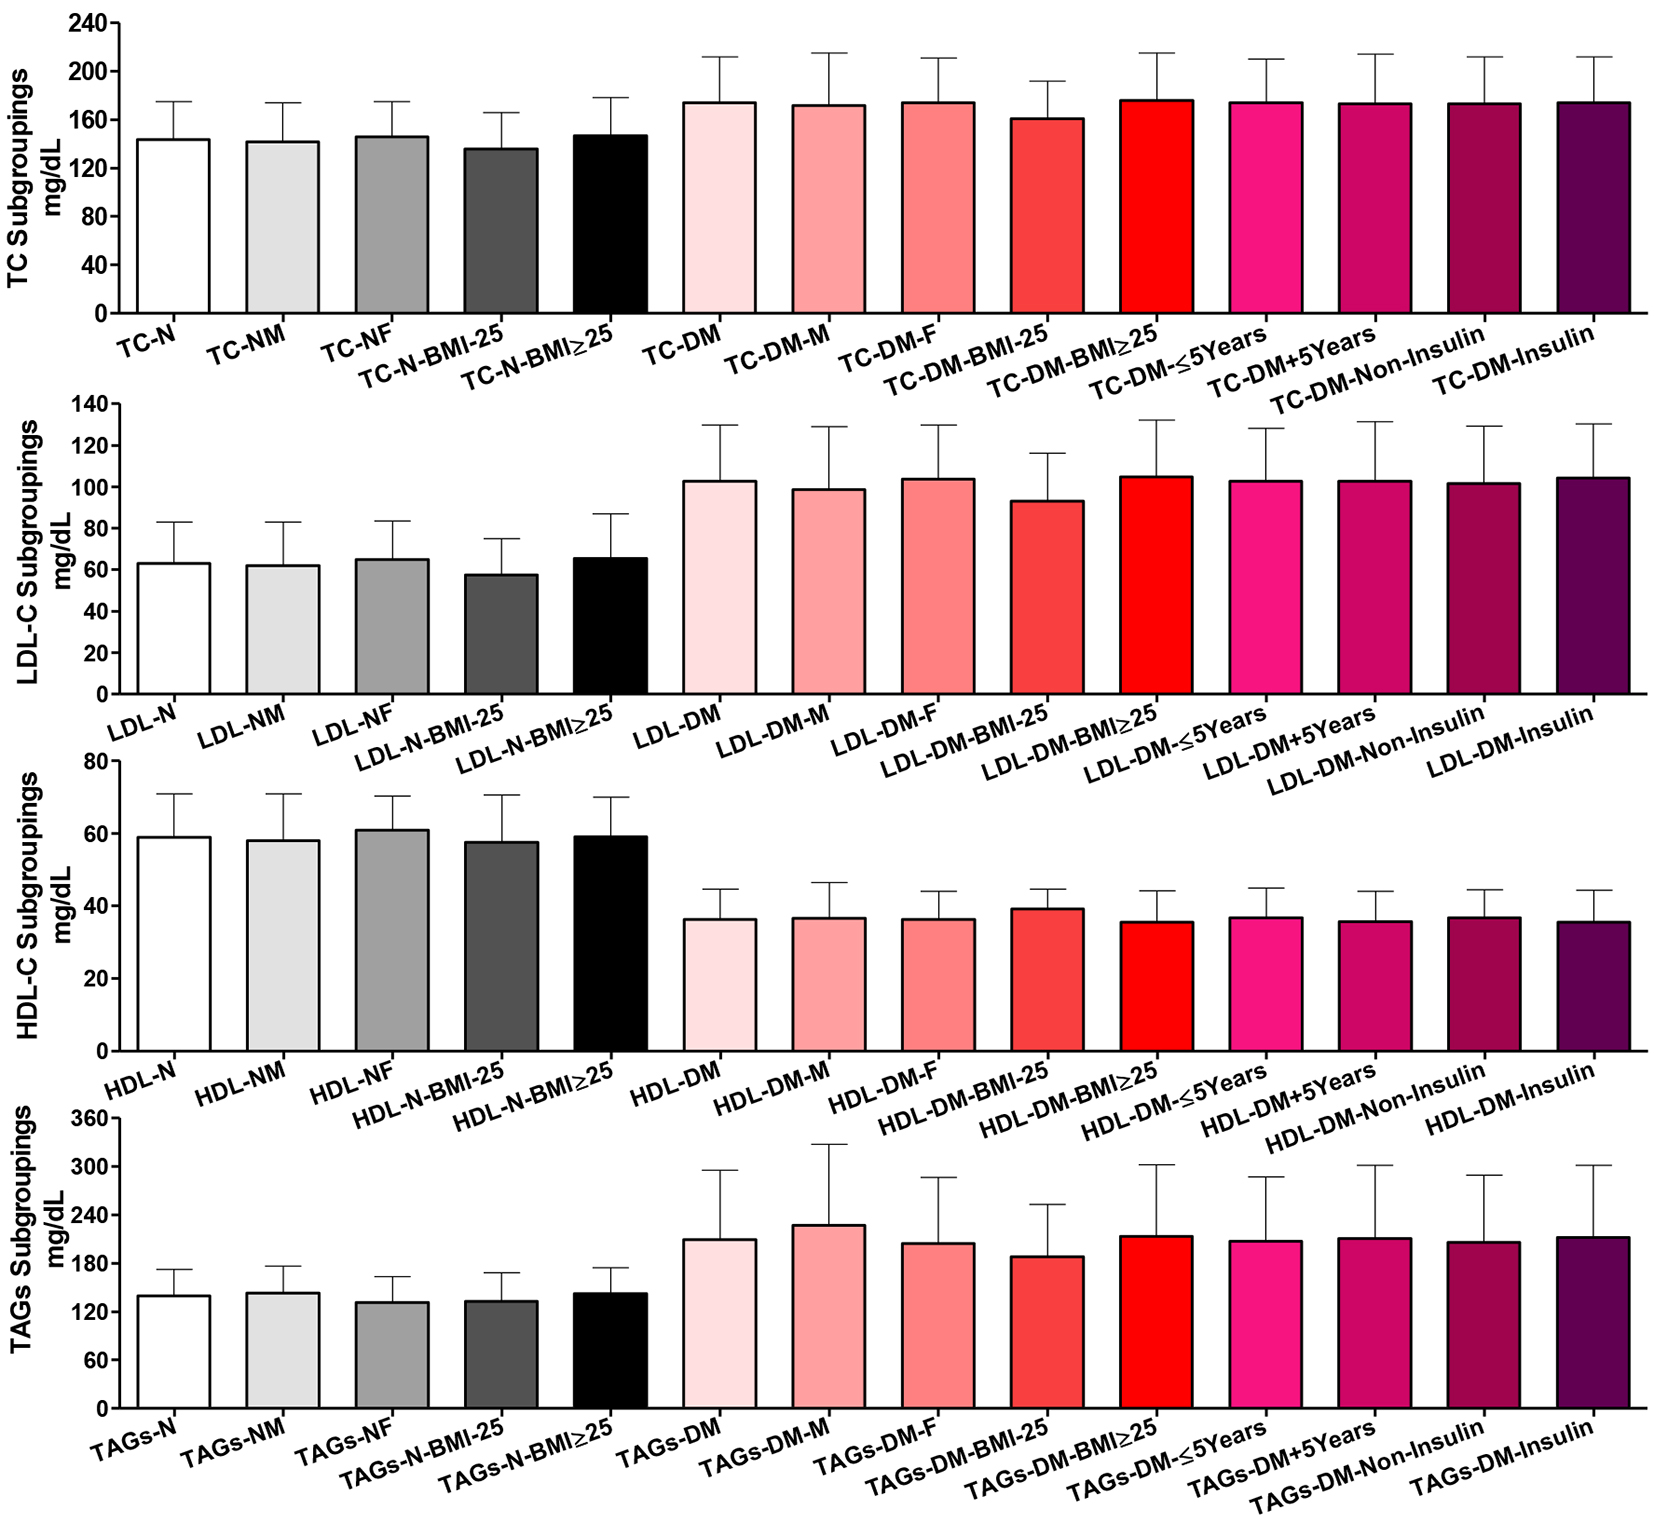 Click for large image | Figure 2. Plasma lipogram findings among all participants. Participants’ subgroups, abbreviations and color indication are the same as in Figure 1. TC: serum total cholesterol, LDL-C: LDL-cholesterol, HDL-C: HDL-cholesterol; TAGs: triacylglycerols. Data are shown as mean ± SEM. |
Fasting plasma HDL-C
Comparing the whole normal participants and their two gender and BMI subgroups, there were non-significant differences in plasma HDL-C. Similarly, T2DM patients did not show significant differences comparing the whole group and their two gender, disease duration and treatment subgroups. The T2DM patients’ BMI subgroups showed slightly significant difference in plasma HDL-C (P ˂ 0.05). Plasma HDL-C was highly significantly reduced in the whole group of patients than the whole normal controls, comparing their respective gender and BMI subgroups (P ˂ 0.001).
Fasting plasma TAGs
There were non-significant differences comparing the whole group of healthy participants and their subgroups for gender and BMI in total plasma TAGs. Similar results were shown among T2DM patients not only for gender and BMI but also for disease duration and treatment subgroupings. Comparing healthy controls vs. T2DM patients as whole groups and as respective gender and BMI subgroups, there were highly significant increases in total plasma TAGs (P ˂ 0.001).
Glycemic control indices among all participants in plasma and whole blood
Fasting plasma glucose
There were non-significant differences comparing the whole group of healthy participants and their subgroups for gender and BMI in plasma glucose. Comparing T2DM patients as a whole group vs. their males and comparing their two gender subgroups, there were significant differences (P ˂ 0.01). Comparing the whole group of T2DM patients vs. their BMI or their treatment subgroups did not show significant differences, but their two BMI subgroups (P ˂ 0.05), the two disease duration (P ˂ 0.01), and the two gender (P ˂ 0.01) subgroups were significantly different in plasma glucose. Comparing the normal and patients’ whole groups and their respective gender and BMI subgroups showed significantly higher blood glucose (P ˂ 0.001) (Fig. 3).
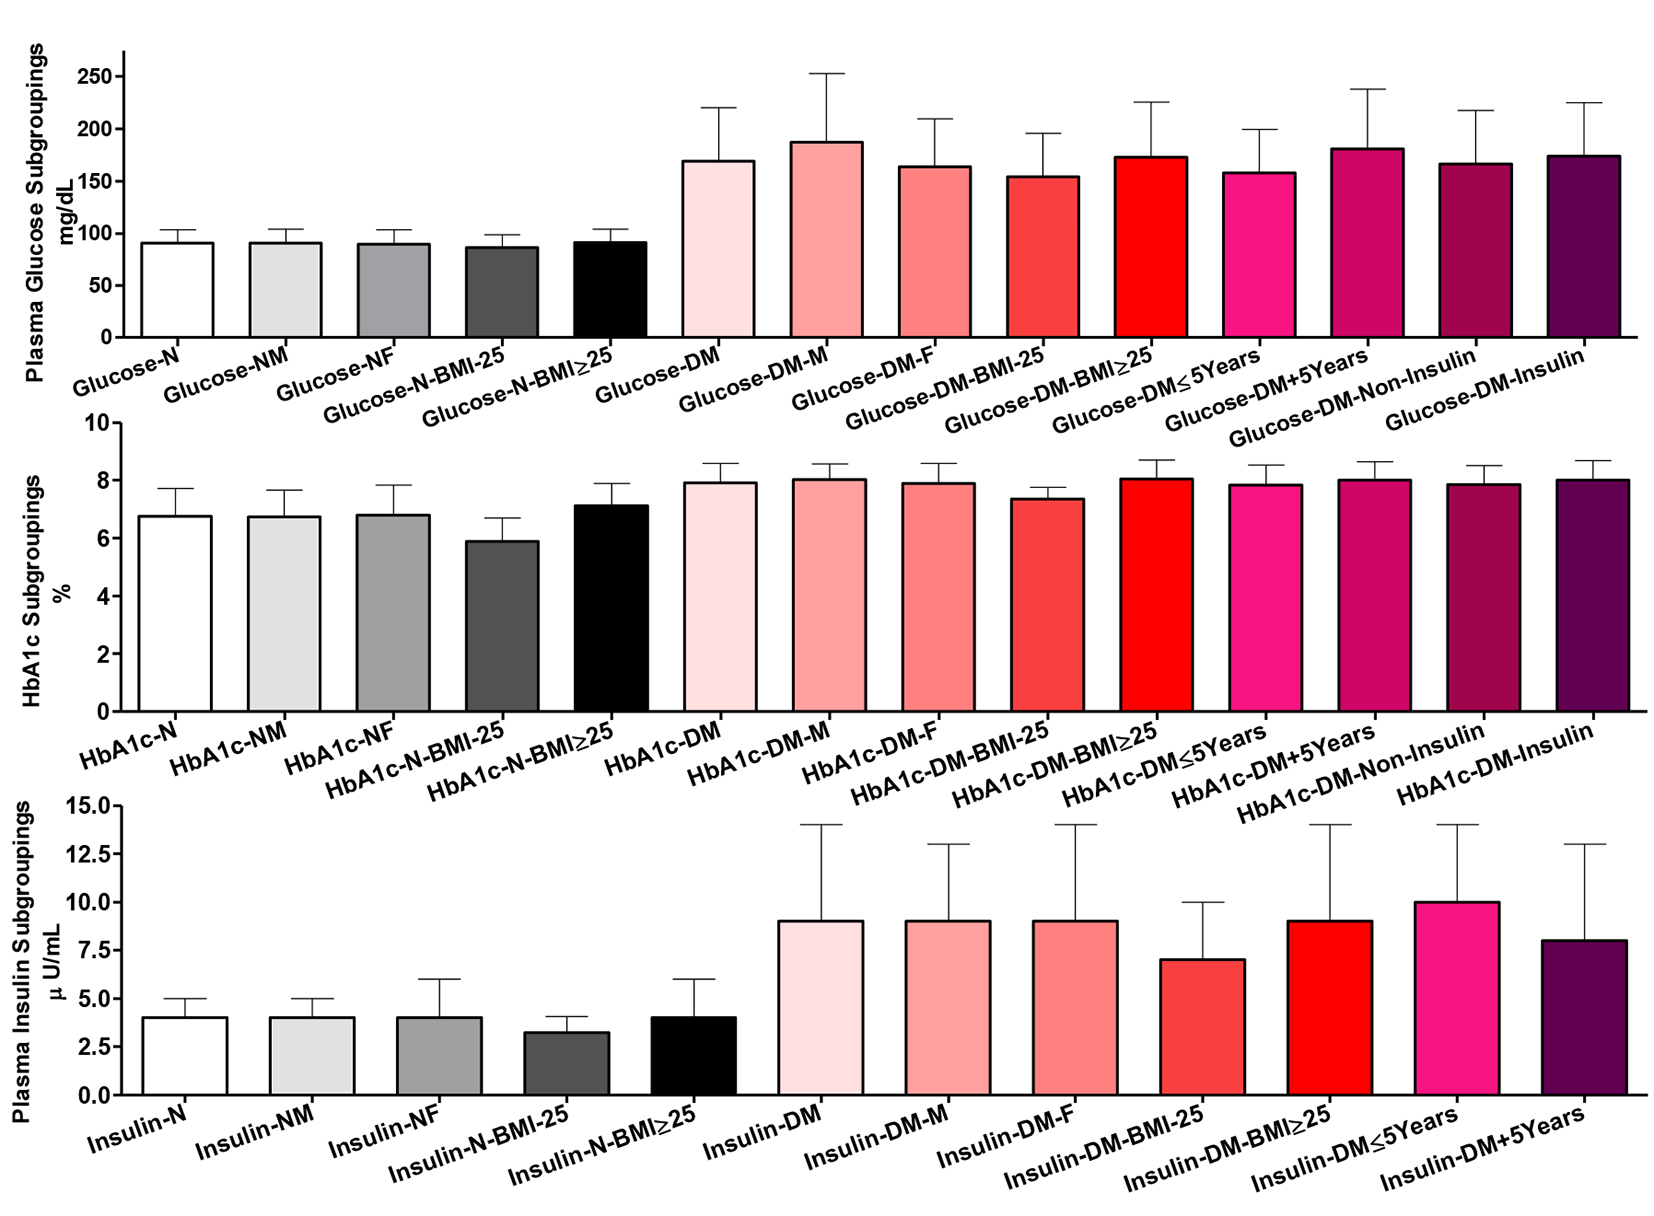 Click for large image | Figure 3. Glycemic control indices among all participants in plasma and whole blood. Participants’ subgroups, abbreviations and color indication are the same as in Figure 1. Data shown are mean ± SEM. |
Whole blood HbA1c
Comparing whole group of healthy participants and their gender subgroups, there were non-significant differences in HbA1c %. However, their BMI subgroupings were significantly different (P ˂ 0.001). Likewise, comparing the whole group of T2DM patients and their gender, disease duration and treatment subgroups, there was non-significant difference. However, their two BMI subgroups showed significant difference in HbA1c (P ˂ 0.001). Comparing the whole groups of healthy controls and patients and their respective gender and BMI subgroups, there were highly significant increases in HbA1c (P ˂ 0.001).
Plasma insulin level
Comparing the whole group of healthy participants and their gender subgroups, there were non-significant differences in plasma insulin content. However, the two normal BMI subgroups showed significant differences (the two subgroups vs. each other, P ˂ 0.05 and comparing the whole group vs. those with BMI ˂ 25, P ˂ 0.01). Among patients, only the comparison between the two BMI (P ˂ 0.05) and disease duration (P ˂ 0.01) subgroups showed significant differences. There were highly significant increases in plasma insulin comparing patients and healthy controls as whole groups and as gender and BMI subgroups (P ˂ 0.001) (Fig. 3).
In healthy control, plasma insulin correlated positively with each of age (in whole and females; r = 0.502 and P ˂ 0.01), BMI (in all except those with lower BMI; r = 0.601 and P ˂ 0.001), TAGs (in females; r = 0.376 and P ˂ 0.05), and HbA1c (r = 0.327 and P ˂ 0.001), and, negatively with ABSI (in males; r = -0.466 and P ˂ 0.01). In patients, insulin correlated negatively with HDL-C (r = -0.353 and P ˂ 0.05), and positively with each of age (in those on non-insulin treatment and shorter disease duration; r = 0.232 and P ˂ 0.05), BMI (except those with lower BMI; r = 0.448 and P ˂ 0.001), ABSI (in those with lower BMI, longer disease duration and on insulin treatment; r = 0.318 and P ˂ 0.01), glucose and HbA1c (strongest correlation in those on non-insulin treatment and shorter disease duration; r = 0.346 and P ˂ 0.001, and, r = 0.331 and P ˂ 0.001, respectively). In patients, also HbA1c correlated negatively with HDL-C (r = -0.345 and P ˂ 0.05).
Plasma betatrophin and HGFs among all participants
Plasma betatrophin level
Comparing the whole group of healthy participants and their gender and BMI subgroups, there were non-significant differences in plasma betatrophin content. Likewise, T2DM patients as whole group and as gender and disease duration and treatment subgroups did show significant differences in plasma betatrophin. Comparing patients BMI subgroups showed higher betatrophin in those with lower BMI (P ˂ 0.05). Comparing the whole group of patients vs. the whole group of healthy participants and all of their respective subgroups, there were non-significant differences in plasma betatrophin (Fig. 4).
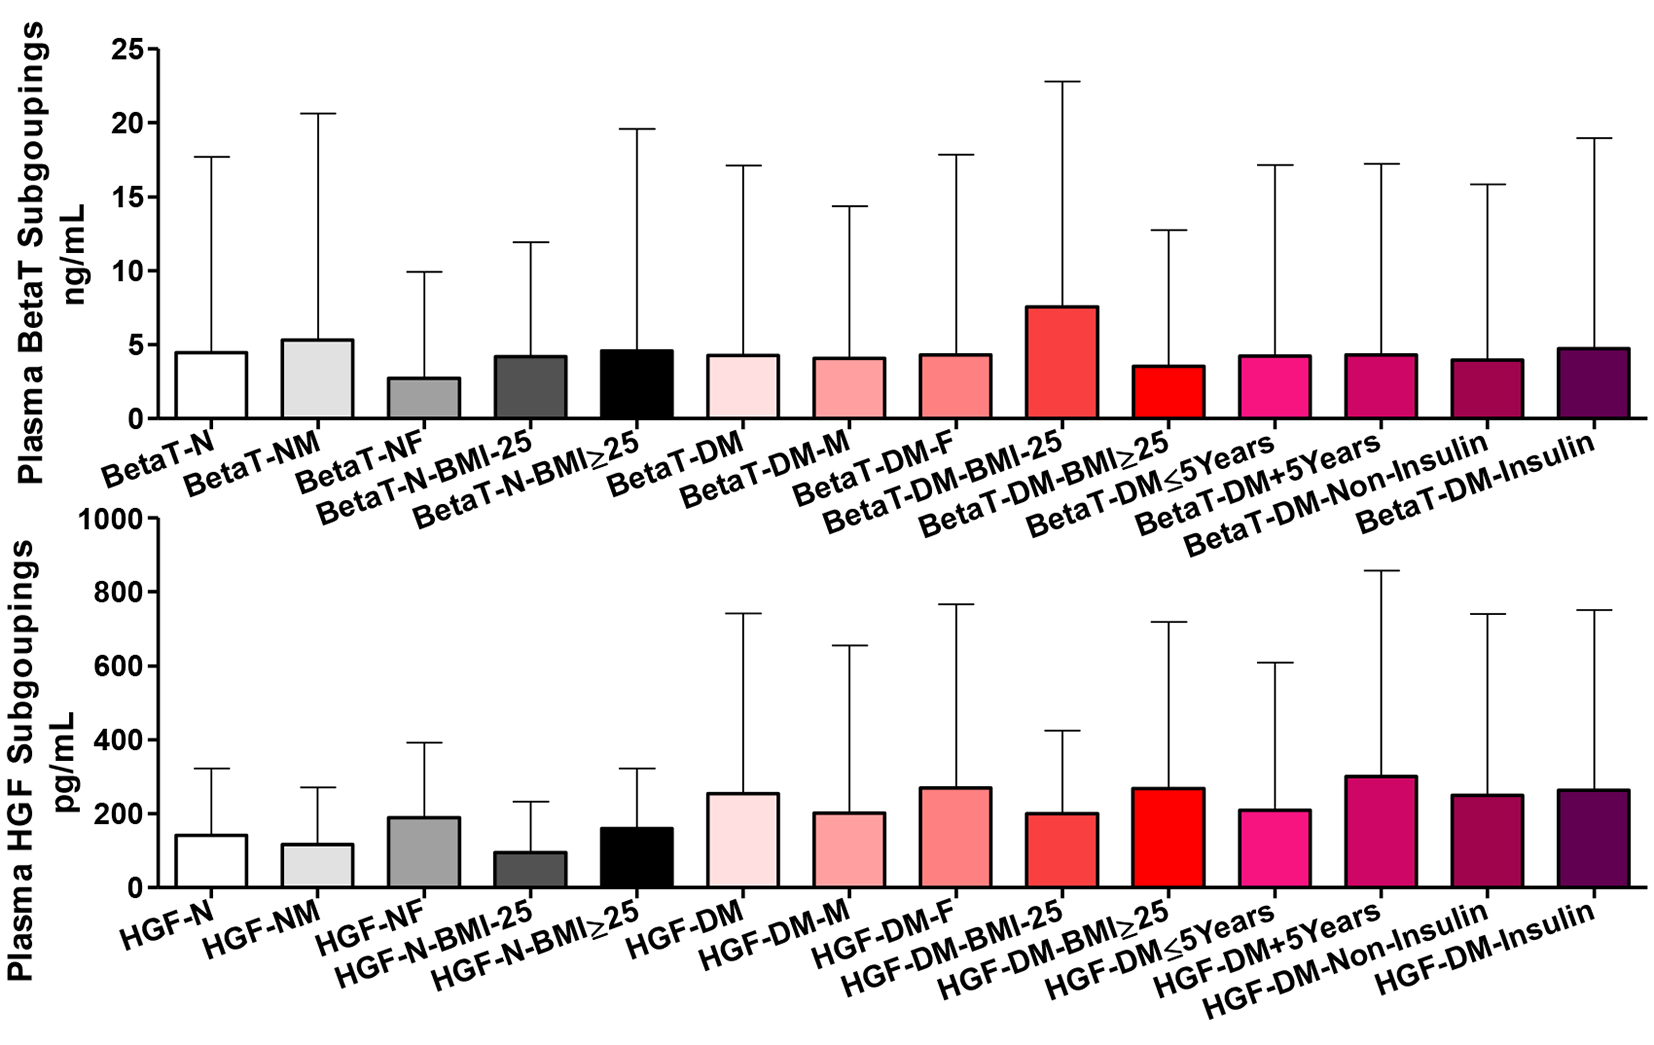 Click for large image | Figure 4. Plasma betatrophin (BetaT) and hepatocyte growth factors (HGF) among all participants. Participants’ subgroups, abbreviations and color indication are the same as in Figure 1. Data are shown as mean ± SEM. |
Plasma HGF level
Comparing the whole group of healthy participants vs. their gender and BMI subgroups, there were non-significant differences in plasma HGF content. However, comparing their gender and BMI subgroups, there were significantly higher HGF in females and those with higher BMI (P ˂ 0.05). T2DM patients as a whole and all types of subgroups did not show significant differences in plasma HGF. Comparing the whole group of patients vs. the whole group of healthy participants and all of their respective gender and BMI subgroups, there were non-significant differences in plasma HGF.
In healthy control, plasma betatrophin correlated positively with ABSI in those with higher BMI (r = 0.368 and P ˂ 0.05) and negatively with HbA1c (in females; r = -0.340 and P ˂ 0.05). In patients, betatrophin correlated negatively with age (in whole and all subgroupings except males, higher BMI and shorter disease duration; r = -0.300 and P ˂ 0.001), total cholesterol and LDL-C (in those on non-insulin treatment and those with longer disease duration; r = -0.257 and P ˂ 0.01, and, r = -0.163 and P ˂ 0.05, respectively). In patients, betatrophin correlated positively with each of BMI (in those on insulin treatment, with BMI ≥ 25 and longer disease duration; r = 0.245 and P ˂ 0.05), glucose and HbA1c (in those on insulin treatment and those with higher BMI; r = 0.184 and P ˂ 0.05, and, r = 0.242 and P ˂ 0.05, respectively). In patients, also betatrophin correlated positively and negatively with ABSI (in those on non-insulin treatment and shorter disease duration; r = 0.225 and P ˂ 0.05 vs. those on insulin treatment; r = -0.219 and P ˂ 0.05, respectively).
In healthy control, plasma HGF correlated positively with each of BMI, glucose and HbA1c, and, negatively with ABSI (in the whole group, those with higher BMI and males; r/P value, r = 0.416 and P ˂ 0.001, r = 0.240 and P ˂ 0.05, r = 0.325 and P ˂ 0.01, and, r = -0.420 and P ˂ 0.05, respectively). In patients, HGF correlated negatively with each of age (in females, those on insulin treatment, and shorter disease duration; r = -0.223 and P ˂ 0.05), ABSI (in those on insulin treatment; r = -0.189 and P ˂ 0.05), HbA1c (in those on insulin treatment and shorter disease duration; r = -0.195 and P ˂ 0.05), and, insulin (in whole and all subgroups except those with lower BMI; r = -0.234 and P ˂ 0.001). In patients, HGF also correlated positively with each of total cholesterol and LDL-C (in females, in those on insulin treatment and with longer disease duration; r = 0.196 and P ˂ 0.05, and, r = 0.203 and P ˂ 0.05, respectively) and betatrophin (in those on insulin treatment; r = 0.235 and P ˂ 0.05).
The treatment score and disease complication severity score of T2DM patients
Treatment score
Comparing T2DM patients as whole group and their disease duration subgroups, there were highly significant differences (P ˂ 0.001) in the nature of their treatment scores with progressive dependence on insulin treatment. The score was also significantly higher comparing males vs. females (P ˂ 0.01) and the whole patients’ group vs. males (P ˂ 0.05) (Fig. 5).
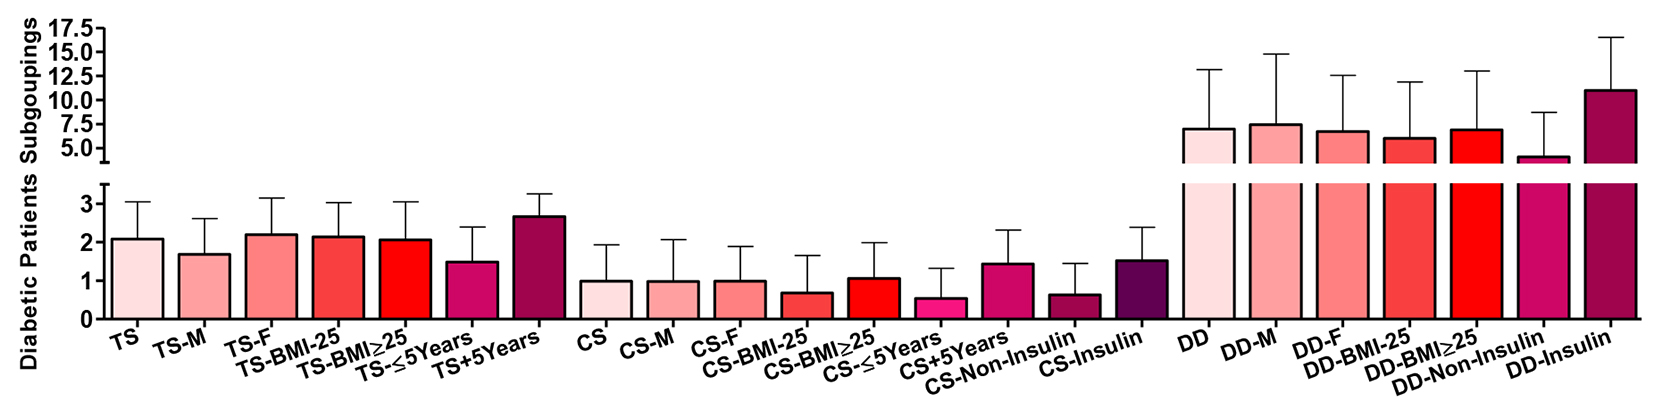 Click for large image | Figure 5. Subgroup of the type 2 diabetic patients according to their treatment score (TS), complication/severity score (CS) and their disease duration (DD). Data are shown as mean ± SEM. |
Disease complication score
Comparing T2DM patients as whole group and their disease duration and treatment subgroups, there were highly significant differences (P ˂ 0.001) in the nature of their disease complications scores tending to increase with insulin treatment and longer disease duration. The score was also significantly different comparing their BMI subgroups (P ˂ 0.05).
Disease duration
Comparing T2DM patients as whole group and their treatment subgroups, there were highly significant differences (P ˂ 0.001) in the duration of the disease in years. Disease severity complication score correlated positively with each of age (r = 0.524 and P ˂ 0.001), ABSI (strongest in those with higher BMI; r = 0.299 and P ˂ 0.001), BMI (r = 0.328 and P ˂ 0.001), total cholesterol and LDL-C (in those with shorter disease duration; r = 0.0195 and P ˂ 0.05, and, r = 0.210 and P ˂ 0.05, respectively), TAGs (in females; r = 0.195 and P ˂ 0.05), glucose and HbA1c (strongest in females; r = 0.266 and P ˂ 0.001, and, r = 0.229 and P ˂ 0.01, respectively), and treatment score (r = 0.478 and P ˂ 0.001), and, negatively only with HDL-C (in females; r = -0.217 and P ˂ 0.01).
| Discussion | ▴Top |
I am very keen in participating in the national research efforts to characterize and combat the current diabetes epidemic costing the country enormously socially and economically [27-29]. Among the anthropometric indices, ABSI was weakest anthropometric discriminator of T2DM across all race gender groups, except for blacks [30]. However, ABSI is applied in population level risk assessment [31]. In the present study, diabetic subgroups for gender, BMI, disease duration, or treatment showed highly significant differences in age. The whole T2DM group was also significantly different in age compared to each of the two disease duration subgroups and insulin treatment. Comparing the whole and the two gender and BMI subgroups of T2DM patients, there were significant differences in ABSI. It is known that ABSI may be of importance in risk prognosis of T2DM and/or atherogenesis [32, 33]. In young and otherwise healthy sedentary men, ABSI is a better predictor than BMI of variability in biochemical parameters due to disturbance in metabolic processes [34]. ABSI predicted all-cause mortality independent of BMI in a large cohort of American adults during an average 4.8-year follow-up [26, 31]. ABSI was significantly associated with the incidence of diabetes and dyslipidemia even after adjustment for BMI, where it is predictively superior to WC after sex- and age-adjustment in Japanese adults [35]. ABSI is a weaker predictor of cardiovascular disease mortality among White Americans [36], cardiovascular disease risk factors among Asians [35] and stroke risk among Spanish European men [37]. In our controls and patients, ABSI correlated negatively with BMI and HGF. In patients, it correlated negatively also with betatrophin and LDL-C but positively with disease complications, duration and insulin treatment.
In the present study, T2DM patients with BMI ˂ 25 were significantly lower than those with BMI ≥ 25 in total plasma cholesterol. Comparing healthy controls vs. T2DM patients as whole groups and as respective gender and BMI subgroups, there were highly significant increases in total cholesterol for all except the two BMI ˂ 25 subgroups. Comparing T2DM patients vs. normal controls and their respective gender or BMI subgroups, there were highly significant differences in LDL-C. Plasma HDL-C was highly significantly reduced in the whole group of patients than normal controls, comparing their respective gender and BMI subgroups. Comparing healthy controls vs. T2DM patients as whole groups and as respective gender and BMI subgroups, there were highly significant increases in total plasma TAGs. In comparison, patients with T2DM exhibit hypertriglyceridemia and low HDL-C levels, whereas levels of LDL-C have been reported to be normal, higher or lower [38, 39] than those in non-diabetic controls. Such dyslipidemia is a result of resistance to the antilipolytic effect of insulin with an exaggerated flux of free fatty acids into the liver [40] and a resistance of the hepatic very LDL secretion to the inhibitory effects of insulin [41-43]. Low HDL-C/high TAGs of T2DM significantly predicted the incidence of vascular events [44]. Ahmed et al (2013) claimed that glycemic control and dyslipidemia in diabetic patients correlate each other and are interdependent [45].
Comparing T2DM patients as a whole group vs. their males and comparing their two gender subgroups, there were significant differences in plasma glucose. Plasma glucose was significantly different between whole group of T2DM patients and their BMI, disease duration, and gender subgroups. Also, plasma glucose was highly significant between normal and patients and their respective gender and BMI subgroups. Among patients, plasma insulin showed a significant difference between the two BMI and disease duration subgroups. Also, when comparing patients and healthy controls as whole group and as gender and BMI subgroups, there were significant differences. HbA1c showed significant difference comparing the two BMI subgroups of healthy participants and T2DM patients. Comparing the whole groups of healthy controls and patients and their respective gender and BMI subgroups, there were highly significant increases in HbA1c. Reportedly, irrespective of the diabetes type and BMI, HbA1c is a good indicator for the disease control [46, 47]. However, Kale and Rawat (2006) found that HbA1c does not correlate circulating insulin or BMI [48]. On the contrary, HbA1c is higher in obese diabetes than the non-obese [49]. HbA1c measurements can be better interpreted in the early weeks of anti-diabetic treatment [50]. The highest frequency of abnormal glycemic control in DM was present in age group of 41 - 60 years and it was lowest in group of 27 - 40 years. Moreover, HbA1c was higher in males as compared to females [51]. HbA1c, fasting insulin, HOMA-IR, inflammation and hyperglycemia jointly contribute to the cardiovascular risk in T2DM men [52].
Betatrophin, as a hepato-/adipokine hormone, correlates body adiposity. The notion that betatrophin may interfere with the compensatory response to IR has raised hope for new diabetes therapeutic in humans. However, in mouse, betatrophin overexpression has no effect on β-cell proliferation and differentiation but rather it increased blood TAGs [53, 54]. This led to the retraction of the original hypothesis propagating its β-cell trophic effect [8, 55]. Meanwhile, opinions regarding the associations of betatrophin with T2DM and obesity in humans are also discrepant. Circulating betatrophin level is elevated in T2DM and obesity [56] and correlated with lipid profiles. Guo et al (2015) found that betatrophin is associated only with lipid metabolism and has nothing to do with glucose homeostasis [57]. In the present study, there is a very different conclusion because comparing the whole group of healthy participants and their gender and BMI subgroups, there were non-significant differences in plasma betatrophin content. Likewise, T2DM patients as whole group and as gender and disease duration and treatment subgroups did show significant differences in plasma betatrophin except for their BMI subgroups that showed slightly higher betatrophin in those with lower BMI. Comparing the whole group of patients vs. the whole group of healthy participants and all of their respective subgroups, there were non-significant differences in plasma betatrophin. Previous reports showed higher betatrophin levels in T2DM patients than healthy controls [58-62]. Other investigators found that level of betatrophin in T2DM was significantly lower than healthy control [63, 64]. Still, others found no change in the levels of betatrophin [57, 65].
Many investigators showed that the circulating levels of betatrophin in individuals without diabetes were positively correlated only with age [58, 59]. Others showed that betatrophin in healthy controls was negatively correlated with age in lean and obese group, and, with total cholesterol and LDL-C in obese group [65]. In our T2DM patients, betatrophin negatively correlated with age in each of the whole group, females and those with lower BMI, the two treatments, and those with longer disease duration subgroups. Betatrophin positively correlated with BMI in patients with higher BMI, insulin-treated and those with longer disease duration. Betatrophin positively correlated with ABSI in non-insulin-treated patients and patients with shorter disease duration but negatively with ABSI in insulin-treated patients. Betatrophin positively correlated with glucose and HbA1c in insulin-treated patients and those with higher BMI. However, it negatively correlated with LDL-C and total cholesterol in non-insulin-treated patients. Betatrophin negatively correlated with total cholesterol in patients with longer disease duration. In this aspect, Abu-Farha et al (2015) showed that betatrophin healthy controls negatively correlated with age, BMI, waist/hip ratio, blood glucose, HbA1c, insulin levels, HOMA-IR, and plasma TAGs [62]. Fu et al (2014) showed that in healthy participants, betatrophin negatively correlated with BMI [66]. Gomez-Ambrosi et al (2014) complicated the picture more by showing that betatrophin in healthy controls was negatively correlated with HDL-C, but positively correlated with BMI and WC [63]. Wang et al (2016) found a positive correlation between betatrophin and age but an inverse association with BMI in normal participants and HDL-C in females. However, there was no correlation between betatrophin and fasting glucose, insulin, HbA1c, TAGs, total cholesterol or LDL-C [67]. In T2DM, many investigators showed that level of betatrophin was positively correlated with age [60, 68], diabetes duration [62, 68], HbA1c [56, 58, 60], total cholesterol and LDL-C [59, 65], HDL-C [59, 63], TAGs [60], BMI in female only [61], glucose [60, 66], and HOMA-IR [57, 59]. Contrarily, Abu-Farha et al (2015) found a negative correlation between betatrophin and total cholesterol and LDL-C [62]. Xie et al (2015) found a negative correlation between betatrophin and fasting plasma glucose and HOMA-IR in females only [61].
Ghasemi et al (2015) found that circulating betatrophin level was significantly higher in patients with T2DM than in the normal subjects and positively correlated with age, glucose, TAGs, total cholesterol, and HbA1c in patients. They postulated that betatrophin may be involved in the generation of an atherogenic lipid profile [69]. Disparity in the literature may be due to the duration of disease, patient genetic and environmental background and medications, and differences in sensitivity of the immunoassay applied and targeted epitope [66]. However, in our study different disease durations and treatment approaches were assessed. The mechanism of modulating betatrophin level in T2DM patients is largely unknown. Yi et al (2015) found a negative correlation between betatrophin and HDL-C [70]. Our results also showed a positive correlation of blood glucose and HbA1c with circulating betatrophin in T2DM in subgroups treated with insulin and having higher BMI which is supported by the results of Fu et al (2014) [66]. Glucose through activating carbohydrate response element binding protein may control the promoter of betatrophin gene [71, 72]. Therefore, a positive relationship between betatrophin, blood glucose and HbA1c in T2DM is not unexpected. In our patient, betatrophin was negatively correlated with age in patients, particularly females, those with lower BMI, insulin-treated, and with longer disease duration. Contrarily, Ghasemi et al (2015) showed that in T2DM and normal controls, age was positively correlated with circulating betatrophin [69]. Based on the association of T2DM with an atherogenic lipid profile and the risk of cardiovascular disorders in these patients, we studied the relationship between betatrophin and the lipid profile. In the present study, betatrophin was negatively correlated with LDL-C and total cholesterol in non-insulin-treated patients. Betatrophin negatively correlated with total cholesterol in patients with longer disease duration. Contrarily, Ghasemi et al (2015) showed that circulating betatrophin positively correlated with TAGs and total cholesterol [69].
HGF is a pleiotropic cytokine involved in tissue protection and repair of the endothelium as an angiogenic mitogen [73, 74]. HGF levels are increased in patients with T2DM who had hypertensive complications such as arteriosclerosis [74]. In the present study, comparing the whole group of healthy participants vs. their gender and BMI subgroups, there were non-significant differences in HGF content. However, comparing their gender and BMI subgroups, there was significantly higher HGF in females and those with higher BMI. All types of subgroups of T2DM patients did not show significant differences in plasma HGF. There were no differences also comparing the whole group of patients vs. the whole group of healthy participants and all of their respective gender and BMI subgroups. In the correlation analysis, HGF negatively correlated with ABSI, but positively with BMI and HbA1c in the whole normal participants and their males. HGF positively correlated glucose in normal participants and their BMI ≥ 25 subgroup. In our study patients, HGF negatively correlated with age in females, insulin-treatment and shorter disease duration. HGF negatively correlated ABSI and HbA1c in insulin-treated subgroup. HGF negatively correlated HbA1c in shorter disease duration. HGF negatively correlated plasma insulin in all patients those with higher BMI. HGF positively correlated with HDL-C and total cholesterol in female patients, insulin-treated and longer disease duration. HGF positively correlated betatrophin in insulin-treated patients. Satani et al (2006) found markedly higher serum HGF in T2DM patients than the normal range [75]. High HGF level is associated with prevalence of T2DM [76] and with depressed cardiovascular autonomic function and IR in T2DM patients [77]. Blood HGF is up to threefold elevated in obese individuals demonstrating a strong correlation with BMI and was substantially declined following weight loss [16]. Cao (2007) reported a significant association of visceral adiposity index with HGF [78]. Circulating HGF levels are also associated with metabolic syndrome [18] and hypertension [20] implicating it in the cardiometabolic disease and diabetes. It is possible that obese individuals exhibit HGF resistance, much like IR, leading to disturbed glucose metabolism and endothelial dysfunction with or without hepatic dysfunction [18, 79].
HGF-diabetes association is independent of obesity since control for both of BMI and WC did not abolish it. However, HGF production by adipocytes is positively correlated with BMI, and concentrations are elevated in mouse and human obesity [76]. HGF possibly regulates β-cell replication during obesity, since the increase in HGF concentrations in high-fat-diet-induced obesity precedes the expansion of β-cell mass and the increase in insulin secretion and may act as an early signal of obesity/IR [16, 23]. Hyperglycemia increases renal expression of HGF and c-Met and may contribute to the renal hypertrophy of diabetes [80]. In contrast, Nakamura et al (1998) found a decrease in circulating and renal HGF levels in a mouse model of T2DM with an inverse correlation with HbA1c [20]. In our study, serum HGF was higher in T2DM patients than healthy controls and unexplainablely female patients were always higher than male patients and healthy controls. The contrast between increased serum HGF in hypertensive and its decrease in T2DM, while tissue HGF levels are decreased in both diseases is interesting [81]. Indeed, activation of serum TGF-β, a strong negative regulator of HGF, is increased in T2DM patients [82]. Contrarily, Konya et al (2014) found that serum HGF in T2DM patients with hypertension was markedly more elevated than that in the normal controls or normotensive T2DM patients. Also, they found no remarkable relationship between serum HGF with neither total cholesterol nor HbA1c. However, they considered increases of serum HGF as an indicator of diabetes severeness particularly towards macroangiopathy [81]. In our patients, correlation of insulin with worse prognostic markers particularly in insulin-treated patients supports the hypothesis raised by Nolan et al (2015) that IR is a natural protective strategy by cells to avoid metabolic stress and gaining more body fats due to energy surplus [83].
Conclusions and future directions
Our findings indicate that blood betatrophin and HGF levels massively differ among adults - healthy and succumbing T2DM, giving no room for their classification as diagnostic and/or pathogenetic effectors and that plasma insulin and treatment correlates worse disease severity complication score pointing to a defensive IR strategy. Gene polymorphism and/or resistance to physiological inducers could explain these results that mandated our current molecular studies.
Acknowledgments
The author is highly indebted to the kind help of Professor Tarek H. El-Metwally (College of Medicine, Aljouf University, Sakaka, Saudi Arabia) for supervising the laboratory assessment of biomarkers, and, of Professor Abdul-Rahim M. Meki (Faculty of Medicine, Assiut University, Assiut, Egypt) for his invaluable inputs editing the final version of the manuscript.
Funding
This project was generously supported with a fund (35/309) from the Deanship for Post-graduate Studies and Research, Aljouf University, Sakaka, Saudi Arabia.
Conflicts of Interest
The author declares absence of any conflicts of interest.
| References | ▴Top |
- O'Rahilly S. Human obesity and insulin resistance: lessons from experiments of nature. Biochem Soc Trans. 2007;35(Pt 1):33-36.
doi pubmed - DeFronzo RA, Ferrannini E, Groop L, Henry RR, Herman WH, Holst JJ, Hu FB, et al. Type 2 diabetes mellitus. Nature Reviews Disease Primers. 2015;1(15019):1-22.
doi - Kaul N, Ali S. Genes, Genetics, and Environment in Type 2 Diabetes: Implication in Personalized Medicine. DNA Cell Biol. 2016;35(1):1-12.
doi pubmed - Pilon M. Revisiting the membrane-centric view of diabetes. Lipids Health Dis. 2016;15(1):167.
doi pubmed - Zhang R. Lipasin, a novel nutritionally-regulated liver-enriched factor that regulates serum triglyceride levels. Biochem Biophys Res Commun. 2012;424(4):786-792.
doi pubmed - Quagliarini F, Wang Y, Kozlitina J, Grishin NV, Hyde R, Boerwinkle E, Valenzuela DM, et al. Atypical angiopoietin-like protein that regulates ANGPTL3. Proc Natl Acad Sci U S A. 2012;109(48):19751-19756.
doi pubmed - Ren G, Kim JY, Smas CM. Identification of RIFL, a novel adipocyte-enriched insulin target gene with a role in lipid metabolism. Am J Physiol Endocrinol Metab. 2012;303(3):E334-351.
doi pubmed - Yi P, Park JS, Melton DA. Betatrophin: a hormone that controls pancreatic beta cell proliferation. Cell. 2013;153(4):747-758.
doi pubmed - Levitsky LL, Ardestani G, Rhoads DB. Role of growth factors in control of pancreatic beta cell mass: focus on betatrophin. Curr Opin Pediatr. 2014;26(4):475-479.
doi pubmed - Iroz A, Couty JP, Postic C. Hepatokines: unlocking the multi-organ network in metabolic diseases. Diabetologia. 2015;58(8):1699-1703.
doi pubmed - Dijk W, Kersten S. Regulation of lipoprotein lipase by Angptl4. Trends Endocrinol Metab. 2014;25(3):146-155.
doi pubmed - Kersten S. Physiological regulation of lipoprotein lipase. Biochim Biophys Acta. 2014;1841(7):919-933.
doi pubmed - Abu-Farha M, Al-Khairi I, Cherian P, Chandy B, Sriraman D, Alhubail A, Al-Refaei F, et al. Increased ANGPTL3, 4 and ANGPTL8/betatrophin expression levels in obesity and T2D. Lipids Health Dis. 2016;15(1):181.
doi pubmed - Zarnegar R, Michalopoulos GK. The many faces of hepatocyte growth factor: from hepatopoiesis to hematopoiesis. J Cell Biol. 1995;129(5):1177-1180.
doi pubmed - Fain JN, Madan AK, Hiler ML, Cheema P, Bahouth SW. Comparison of the release of adipokines by adipose tissue, adipose tissue matrix, and adipocytes from visceral and subcutaneous abdominal adipose tissues of obese humans. Endocrinology. 2004;145(5):2273-2282.
doi pubmed - Bell LN, Ward JL, Degawa-Yamauchi M, Bovenkerk JE, Jones R, Cacucci BM, Gupta CE, et al. Adipose tissue production of hepatocyte growth factor contributes to elevated serum HGF in obesity. Am J Physiol Endocrinol Metab. 2006;291(4):E843-848.
doi pubmed - Bertola A, Bonnafous S, Cormont M, Anty R, Tanti JF, Tran A, Le Marchand-Brustel Y, et al. Hepatocyte growth factor induces glucose uptake in 3T3-L1 adipocytes through A Gab1/phosphatidylinositol 3-kinase/Glut4 pathway. J Biol Chem. 2007;282(14):10325-10332.
doi pubmed - Hiratsuka A, Adachi H, Fujiura Y, Yamagishi S, Hirai Y, Enomoto M, Satoh A, et al. Strong association between serum hepatocyte growth factor and metabolic syndrome. J Clin Endocrinol Metab. 2005;90(5):2927-2931.
doi pubmed - Rehman J, Considine RV, Bovenkerk JE, Li J, Slavens CA, Jones RM, March KL. Obesity is associated with increased levels of circulating hepatocyte growth factor. J Am Coll Cardiol. 2003;41(8):1408-1413.
doi - Nakamura S, Morishita R, Moriguchi A, Yo Y, Nakamura Y, Hayashi S, Matsumoto K, et al. Hepatocyte growth factor as a potential index of complication in diabetes mellitus. J Hypertens. 1998;16(12 Pt 2):2019-2026.
doi pubmed - Matsumori A, Furukawa Y, Hashimoto T, Ono K, Shioi T, Okada M, Iwasaki A, et al. Increased circulating hepatocyte growth factor in the early stage of acute myocardial infarction. Biochem Biophys Res Commun. 1996;221(2):391-395.
doi pubmed - Gaddy DF, Riedel MJ, Pejawar-Gaddy S, Kieffer TJ, Robbins PD. In vivo expression of HGF/NK1 and GLP-1 From dsAAV vectors enhances pancreatic ss-cell proliferation and improves pathology in the db/db mouse model of diabetes. Diabetes. 2010;59(12):3108-3116.
doi pubmed - Araujo TG, Oliveira AG, Carvalho BM, Guadagnini D, Protzek AO, Carvalheira JB, Boschero AC, et al. Hepatocyte growth factor plays a key role in insulin resistance-associated compensatory mechanisms. Endocrinology. 2012;153(12):5760-5769.
doi pubmed - Bancks MP, Bielinski SJ, Decker PA, Hanson NQ, Larson NB, Sicotte H, Wassel CL, et al. Circulating level of hepatocyte growth factor predicts incidence of type 2 diabetes mellitus: The Multi-Ethnic Study of Atherosclerosis (MESA). Metabolism. 2016;65(3):64-72.
doi pubmed - Chang HY, Weiner JP, Richards TM, Bleich SN, Segal JB. Validating the adapted Diabetes Complications Severity Index in claims data. Am J Manag Care. 2012;18(11):721-726.
pubmed - Krakauer NY, Krakauer JC. A new body shape index predicts mortality hazard independently of body mass index. PLoS One. 2012;7(7):e39504.
doi pubmed - Abdel Moneim M, Abd-Eltawab A, Mostafa-Hedeab G, Zaki KA, Mohamed AA, Alduraywish AA, Ibrahim MA. Plasma prolactin level in type 2 diabetic patients with and without retinopathy. Aljouf University Medical Journal. 2015;2(4):1-6.
- Alduraywish AA, AlAnazi FM, Alharbi MA, Al-rasheed FM, Alaithan LT. Correlation among the glycemic control and lipid profile indices with chronic complications in Saudi diabetic patients: Al-Jouf Status. AUMJ. 2015;2(3):9-24.
doi - Alduraywish AA, Nail A. Assessment of the primary and intermediate school staffs’ knowledge, attitude and practice on care of children with type 1 diabetes at school, Al-Jouf, Saudi Arabia. Sudan J Med. 2017 (ahead of print).
- Hardy DS, Stallings DT, Garvin JT, Gachupin FC, Xu H, Racette SB. Anthropometric discriminators of type 2 diabetes among White and Black American adults. J Diabetes. 2017;9(3):296-307.
doi pubmed - Krakauer NY, Krakauer JC. Dynamic association of mortality hazard with body shape. PLoS One. 2014;9(2):e88793.
doi pubmed - Reaven GM. Insulin resistance: the link between obesity and cardiovascular disease. Med Clin North Am. 2011;95(5):875-892.
doi pubmed - Maessen MF, Eijsvogels TM, Verheggen RJ, Hopman MT, Verbeek AL, de Vegt F. Entering a new era of body indices: the feasibility of a body shape index and body roundness index to identify cardiovascular health status. PLoS One. 2014;9(9):e107212.
doi pubmed - Malara M, Keska A, Tkaczyk J, Lutoslawska G. Body shape index versus body mass index as correlates of health risk in young healthy sedentary men. J Transl Med. 2015;13:75.
doi pubmed - Fujita M, Sato Y, Nagashima K, Takahashi S, Hata A. Predictive power of a body shape index for development of diabetes, hypertension, and dyslipidemia in Japanese adults: a retrospective cohort study. PLoS One. 2015;10(6):e0128972.
doi pubmed - Song X, Jousilahti P, Stehouwer CD, Soderberg S, Onat A, Laatikainen T, Yudkin JS, et al. Comparison of various surrogate obesity indicators as predictors of cardiovascular mortality in four European populations. Eur J Clin Nutr. 2013;67(12):1298-1302.
doi pubmed - Abete I, Arriola L, Etxezarreta N, Mozo I, Moreno-Iribas C, Amiano P, Egues N, et al. Association between different obesity measures and the risk of stroke in the EPIC Spanish cohort. Eur J Nutr. 2015;54(3):365-375.
doi pubmed - Collins R, Armitage J, Parish S, Sleigh P, Peto R. MRC/BHF Heart Protection Study of cholesterol-lowering with simvastatin in 5963 people with diabetes: a randomised placebo-controlled trial. Lancet. 2003;361(9374):2005-2016.
doi - Bitzur R, Cohen H, Kamari Y, Shaish A, Harats D. Triglycerides and HDL cholesterol: stars or second leads in diabetes? Diabetes Care. 2009;32(Suppl 2):S373-377.
doi pubmed - Lewis GF, Carpentier A, Adeli K, Giacca A. Disordered fat storage and mobilization in the pathogenesis of insulin resistance and type 2 diabetes. Endocr Rev. 2002;23(2):201-229.
doi pubmed - Kwiterovich PO, Jr. Clinical relevance of the biochemical, metabolic, and genetic factors that influence low-density lipoprotein heterogeneity. Am J Cardiol. 2002;90(8A):30i-47i.
doi - Krauss RM, Siri PW. Dyslipidemia in type 2 diabetes. Med Clin North Am. 2004;88(4):897-909, x.
doi pubmed - Taskinen MR. Pathogenesis of dyslipidemia in type 2 diabetes. Exp Clin Endocrinol Diabetes. 2001;109(Suppl 2):S180-188.
doi pubmed - Rexel DH, Czel SA, Marte T, Benzer W, Langer P, Moll W, Saely CH. Atherosclerosis in diabetes and impaired fasting glucose driven by elevated LDL cholesterol or by decreased HDL cholesterol? Diabetes Care. 2005;28:108-114.
- Ahmed OG, El-Mottaleb NA. Renal function and arterial blood pressure alterations after exposure to acetaminophen with a potential role of Nigella sativa oil in adult male rats. J Physiol Biochem. 2013;69(1):1-13.
doi pubmed - d'Emden MC, Shaw JE, Colman PG, Colagiuri S, Twigg SM, Jones GR, Goodall I, et al. The role of HbA1c in the diagnosis of diabetes mellitus in Australia. Med J Aust. 2012;197(4):220-221.
doi pubmed - Ketema EB, Kibret KT. Correlation of fasting and postprandial plasma glucose with HbA1c in assessing glycemic control; systematic review and meta-analysis. Arch Public Health. 2015;73:43.
doi pubmed - Kale K, Rawat DK. Effect of obesity and insulin resistance on diabetic control. Indian J Clin Biochem. 2006;21(1):83-88.
doi pubmed - Souissi S, Rakotoambinina B, Foussier V, Lienhardt A, Laborde K, Jos J, Robert JJ. Insulin resistance and excess weight in adolescent insulin-dependent diabetic girls. Diabete Metab. 1993;19(1):52-57.
pubmed - Barua A, Acharya J, Ghaskadbi S, Goel P. The relationship between fasting plasma glucose and HbA1c during intensive periods of glucose control in antidiabetic therapy. J Theor Biol. 2014;363:158-163.
doi pubmed - Farasat T, Cheema AM, Khan MN. Correlation among BMI, fasting plasma glucose and HbA1c levels in subjects with glycemic anomalies visiting diabetic clinics of Lahore. Pakistan J Zool. 2009;41(3):173-178.
- Bahceci M, Tuzcu A, Ogun C, Canoruc N, Iltimur K, Aslan C. Is serum C-reactive protein concentration correlated with HbA1c and insulin resistance in Type 2 diabetic men with or without coronary heart disease? J Endocrinol Invest. 2005;28(2):145-150.
doi pubmed - Gusarova V, Alexa CA, Na E, Stevis PE, Xin Y, Bonner-Weir S, Cohen JC, et al. ANGPTL8/betatrophin does not control pancreatic beta cell expansion. Cell. 2014;159(3):691-696.
doi pubmed - Jiao Y, Le Lay J, Yu M, Naji A, Kaestner KH. Elevated mouse hepatic betatrophin expression does not increase human beta-cell replication in the transplant setting. Diabetes. 2014;63(4):1283-1288.
doi pubmed - Yi P, Park JS, Melton DA. Retraction Notice to: Betatrophin: A Hormone that Controls Pancreatic beta Cell Proliferation. Cell. 2017;168(1-2):326.
doi pubmed - Espes D, Martinell M, Carlsson PO. Increased circulating betatrophin concentrations in patients with type 2 diabetes. Int J Endocrinol. 2014;2014:323407.
- Guo K, Lu J, Yu H, Zhao F, Pan P, Zhang L, Chen H, et al. Serum betatrophin concentrations are significantly increased in overweight but not in obese or type 2 diabetic individuals. Obesity (Silver Spring). 2015;23(4):793-797.
doi pubmed - Hu H, Sun W, Yu S, Hong X, Qian W, Tang B, Wang D, et al. Increased circulating levels of betatrophin in newly diagnosed type 2 diabetic patients. Diabetes Care. 2014;37(10):2718-2722.
doi pubmed - Chen X, Lu P, He W, Zhang J, Liu L, Yang Y, Liu Z, et al. Circulating betatrophin levels are increased in patients with type 2 diabetes and associated with insulin resistance. J Clin Endocrinol Metab. 2015;100(1):E96-100.
doi pubmed - Yamada H, Saito T, Aoki A, Asano T, Yoshida M, Ikoma A, Kusaka I, et al. Circulating betatrophin is elevated in patients with type 1 and type 2 diabetes. Endocr J. 2015;62(5):417-421.
doi pubmed - Xie X, Gao T, Yang M, Chen P, Jin H, Yang L, Yu X. Associations of betatrophin levels with irisin in Chinese women with normal glucose tolerance. Diabetol Metab Syndr. 2015;7:26.
- Abu-Farha M, Abubaker J, Al-Khairi I, Cherian P, Noronha F, Hu FB, Behbehani K, et al. Higher plasma betatrophin/ANGPTL8 level in Type 2 Diabetes subjects does not correlate with blood glucose or insulin resistance. Sci Rep. 2015;5:10949.
- Gomez-Ambrosi J, Pascual E, Catalan V, Rodriguez A, Ramirez B, Silva C, Gil MJ, et al. Circulating betatrophin concentrations are decreased in human obesity and type 2 diabetes. J Clin Endocrinol Metab. 2014;99(10):E2004-2009.
doi pubmed - Gokulakrishnan K, Manokaran K, Pandey GK, Amutha A, Ranjani H, Anjana RM, Mohan V. Relationship of betatrophin with youth onset type 2 diabetes among Asian Indians. Diabetes Res Clin Pract. 2015;109(1):71-76.
doi pubmed - Fenzl A, Itariu BK, Kosi L, Fritzer-Szekeres M, Kautzky-Willer A, Stulnig TM, Kiefer FW. Circulating betatrophin correlates with atherogenic lipid profiles but not with glucose and insulin levels in insulin-resistant individuals. Diabetologia. 2014;57(6):1204-1208.
doi pubmed - Fu Z, Berhane F, Fite A, Seyoum B, Abou-Samra AB, Zhang R. Elevated circulating lipasin/betatrophin in human type 2 diabetes and obesity. Sci Rep. 2014;4:5013.
- Wang H, Lai Y, Han C, Liu A, Fan C, Zhang H, Ding S, et al. The Effects of Serum ANGPTL8/betatrophin on the Risk of Developing the Metabolic Syndrome - A Prospective Study. Sci Rep. 2016;6:28431.
- Tokumoto S, Hamamoto Y, Fujimoto K, Yamaguchi E, Okamura E, Honjo S, Ikeda H, et al. Correlation of circulating betatrophin concentrations with insulin secretion capacity, evaluated by glucagon stimulation tests. Diabet Med. 2015;32(5):653-656.
doi pubmed - Ghasemi H, Tavilani H, Khodadadi I, Saidijam M, Karimi J. Circulating Betatrophin Levels Are Associated with the Lipid Profile in Type 2 Diabetes. Chonnam Med J. 2015;51(3):115-119.
doi pubmed - Yi M, Chen RP, Yang R, Guo XF, Zhang JC, Chen H. Betatrophin Acts as a Diagnostic Biomarker in Type 2 Diabetes Mellitus and Is Negatively Associated with HDL-Cholesterol. Int J Endocrinol. 2015;2015:479157.
- Jeong YS, Kim D, Lee YS, Kim HJ, Han JY, Im SS, Chong HK, et al. Integrated expression profiling and genome-wide analysis of ChREBP targets reveals the dual role for ChREBP in glucose-regulated gene expression. PLoS One. 2011;6(7):e22544.
doi pubmed - Filhoulaud G, Guilmeau S, Dentin R, Girard J, Postic C. Novel insights into ChREBP regulation and function. Trends Endocrinol Metab. 2013;24(5):257-268.
doi pubmed - Van Belle E, Witzenbichler B, Chen D, Silver M, Chang L, Schwall R, Isner JM. Potentiated angiogenic effect of scatter factor/hepatocyte growth factor via induction of vascular endothelial growth factor: the case for paracrine amplification of angiogenesis. Circulation. 1998;97(4):381-390.
doi pubmed - Morishita R, Aoki M, Yo Y, Ogihara T. Hepatocyte growth factor as cardiovascular hormone: role of HGF in the pathogenesis of cardiovascular disease. Endocrine J. 2002;49:273-284.
doi - Satani K, Konya H, Hamaguchi T, Umehara A, Katsuno T, Ishikawa T, Kohri K, et al. Clinical significance of circulating hepatocyte growth factor, a new risk marker of carotid atherosclerosis in patients with Type 2 diabetes. Diabet Med. 2006;23(6):617-622.
doi pubmed - Rajpathak SN, Wassertheil-Smoller S, Crandall J, Liu S, Ho GY. Hepatocyte growth factor and clinical diabetes in postmenopausal women. Diabetes Care. 2010;33(9):2013-2015.
doi pubmed - Anan F, Masaki T, Yonemochi H, Takahashi N, Nakagawa M, Eshima N, Saikawa T, et al. Hepatocyte growth factor levels are associated with the results of 123I-metaiodobenzylguanidine myocardial scintigraphy in patients with type 2 diabetes mellitus. Metabolism. 2009;58(2):167-173.
doi pubmed - Cao Y. Angiogenesis modulates adipogenesis and obesity. J Clin Invest. 2007;117(9):2362-2368.
doi pubmed - Balaban YH, Sumer H, Simsek H, Us D, Tatar G. Metabolic syndrome, non-alcoholic steatohepatitis (NASH), and hepatocyte growth factor (HGF). Ann Hepatol. 2006;5(2):109-114.
pubmed - Liu Y, Tolbert EM, Sun AM, Dworkin LD. In vivo and in vitro evidence for increased expression of HGF receptor in kidney of diabetic rat. Am J Physiol. 1996;271(6 Pt 2):F1202-1210.
pubmed - Konya H, Miuchi M, Satani K, Matsutani S, Tsunoda T, Yano Y, Katsuno T, et al. Hepatocyte growth factor, a biomarker of macroangiopathy in diabetes mellitus. World J Diabetes. 2014;5(5):678-688.
doi pubmed - Pfeiffer A, Middelberg-Bisping K, Drewes C, Schatz H. Elevated plasma levels of transforming growth factor-beta 1 in NIDDM. Diabetes Care. 1996;19(10):1113-1117.
doi pubmed - Nolan CJ, Ruderman NB, Kahn SE, Pedersen O, Prentki M. Insulin resistance as a physiological defense against metabolic stress: implications for the management of subsets of type 2 diabetes. Diabetes. 2015;64(3):673-686.
doi pubmed
This article is distributed under the terms of the Creative Commons Attribution Non-Commercial 4.0 International License, which permits unrestricted non-commercial use, distribution, and reproduction in any medium, provided the original work is properly cited.
Journal of Endocrinology and Metabolism is published by Elmer Press Inc.