Journal of Endocrinology and Metabolism, ISSN 1923-2861 print, 1923-287X online, Open Access
Article copyright, the authors; Journal compilation copyright, J Endocrinol Metab and Elmer Press Inc
Journal website https://www.jofem.org

Review

Volume 14, Number 3, June 2024, pages 89-102


Pharmacological Treatment of Diabetes Mellitus: An Overview of New Sodium-Glucose Cotransporter 2 Inhibitors for the Treatment of Diabetes Mellitus

Figures

Figure 1.
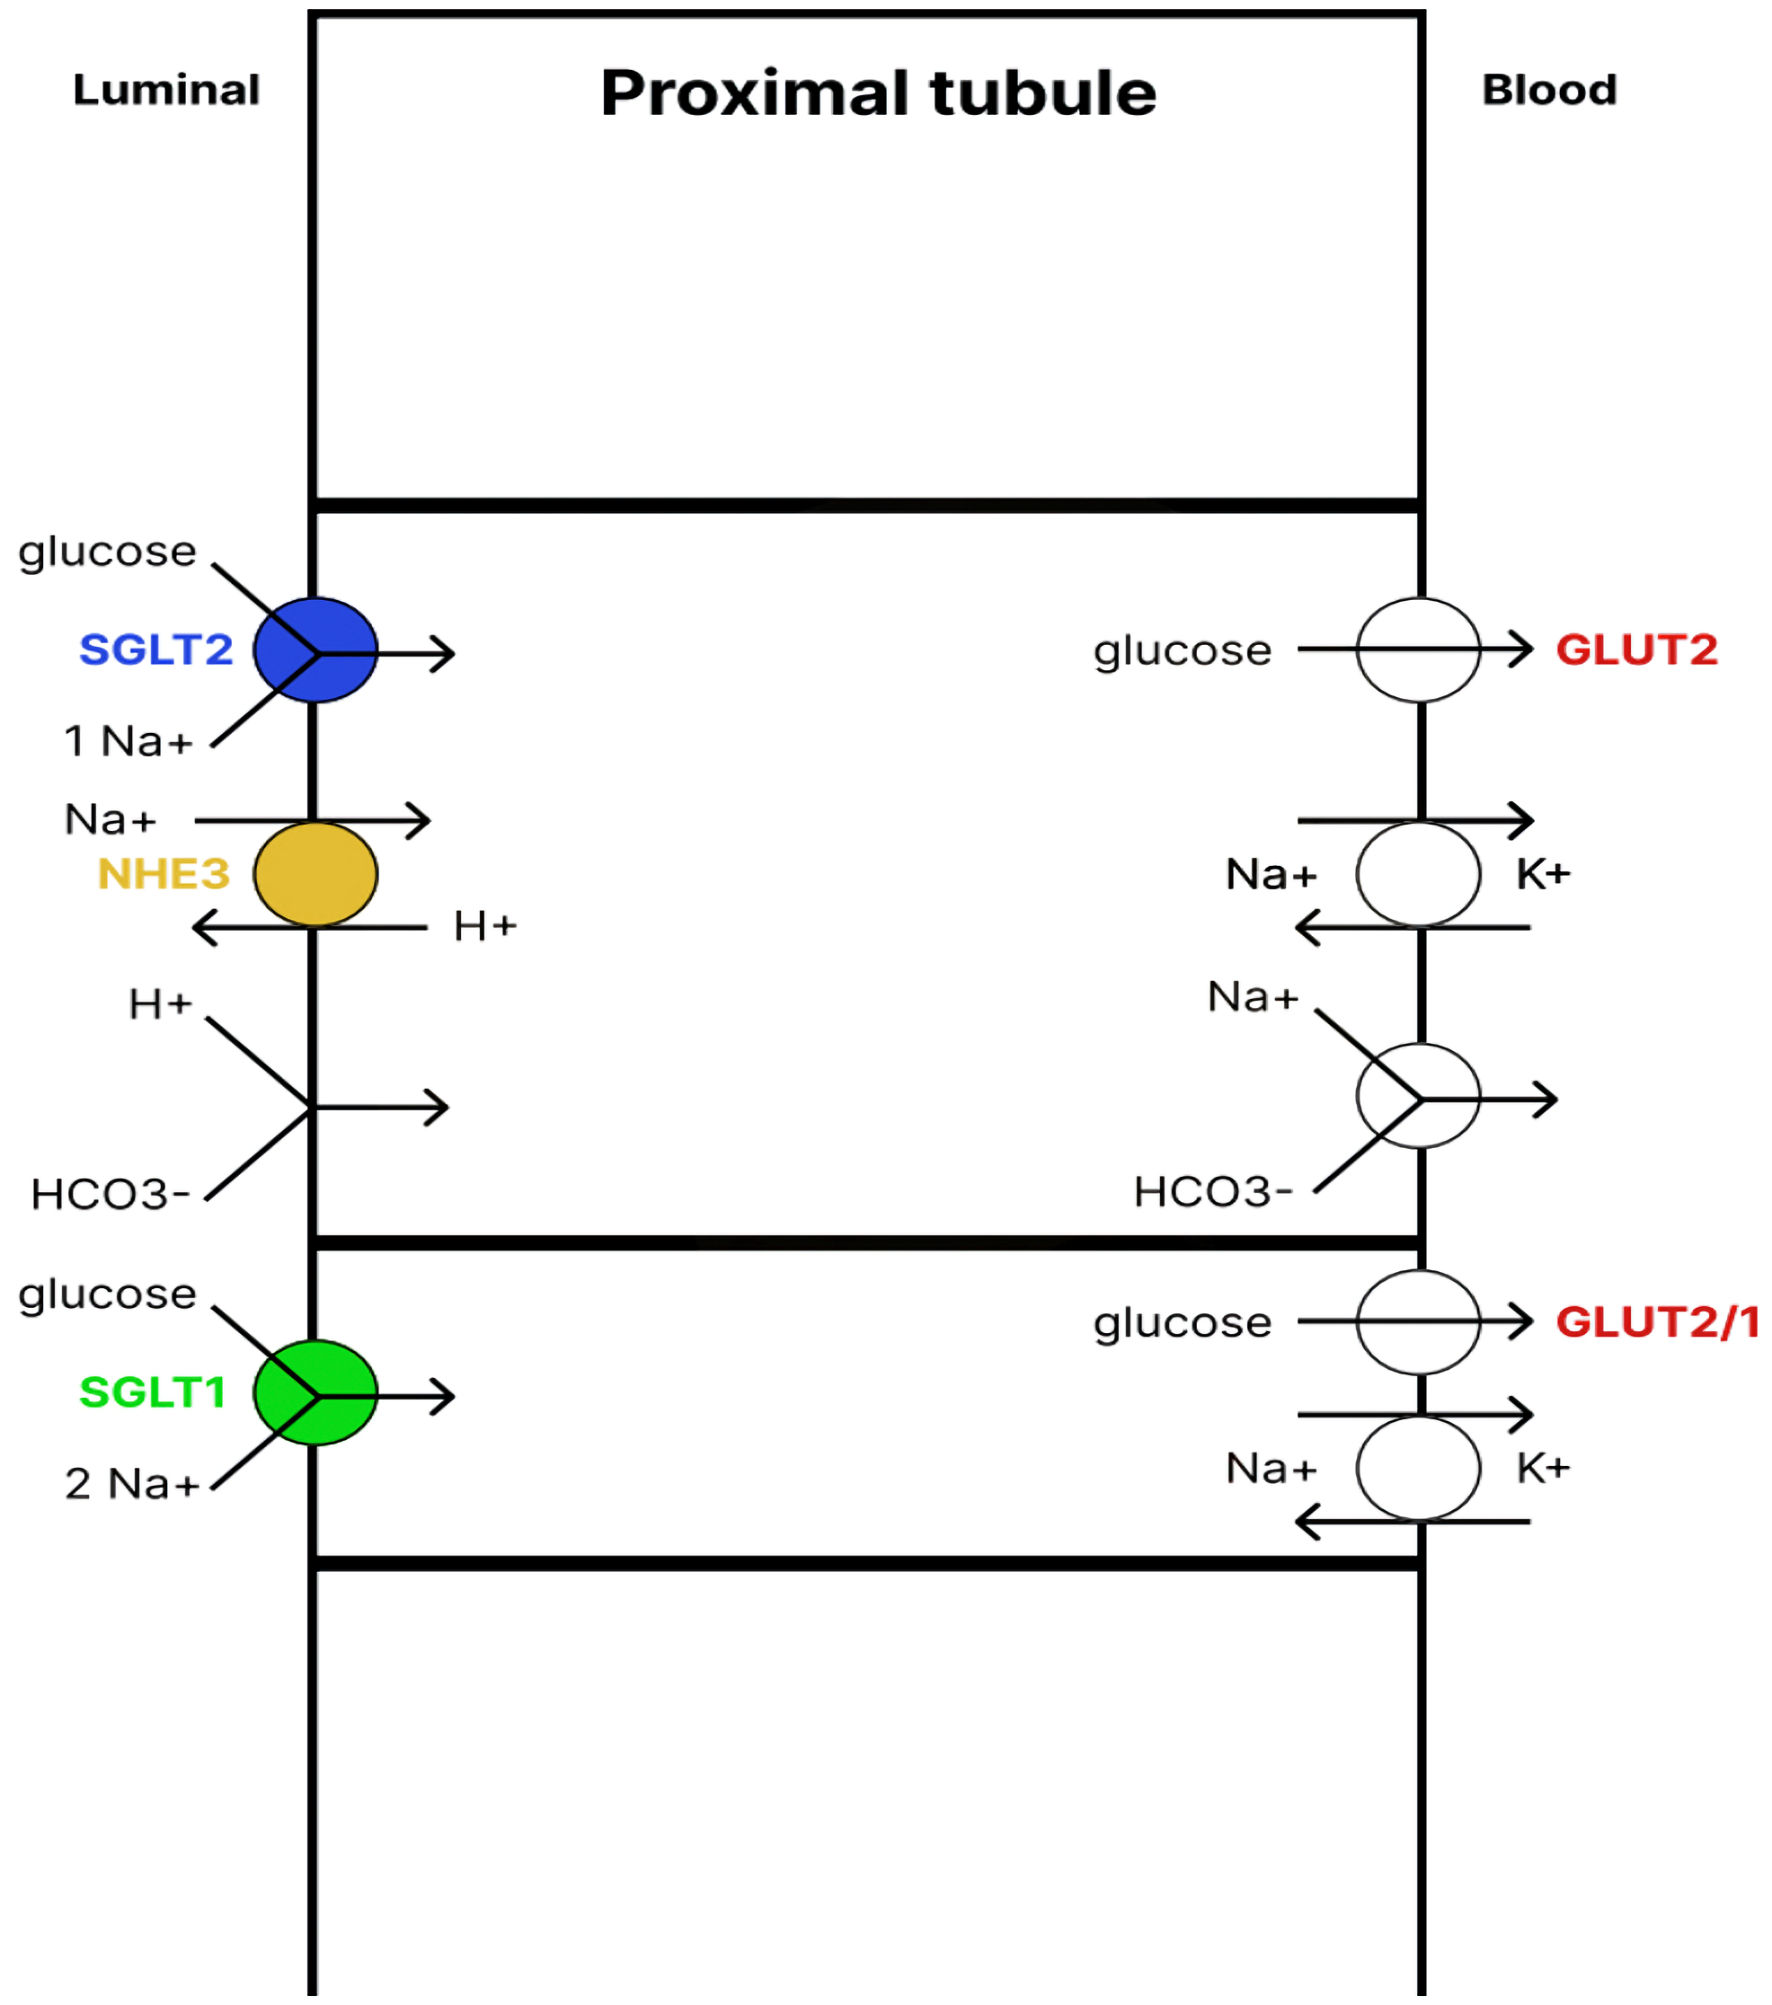
Figure 1. Renal glucose reabsorption in the proximal tubule. SGLT2 cotransporter, located in the apical membrane of the early proximal tubule, absorbs up to 97% of glucose. The glucose is then transported back into the blood with the help of the GLUT2 transporter. The remaining glucose is absorbed by the SGLT1 cotransporter, located in the apical membrane of the late proximal tubule, and then enters the blood with the help of GLUT2/1 transporters. Therefore, under physiological conditions, almost 100% of glucose from the primary urine is reabsorbed. SGLT1/2: sodium-glucose cotransporter1/2; NHE3: sodium-hydrogen exchanger 3; GLUT1/2: glucose transporter1/2.
Figure 2.
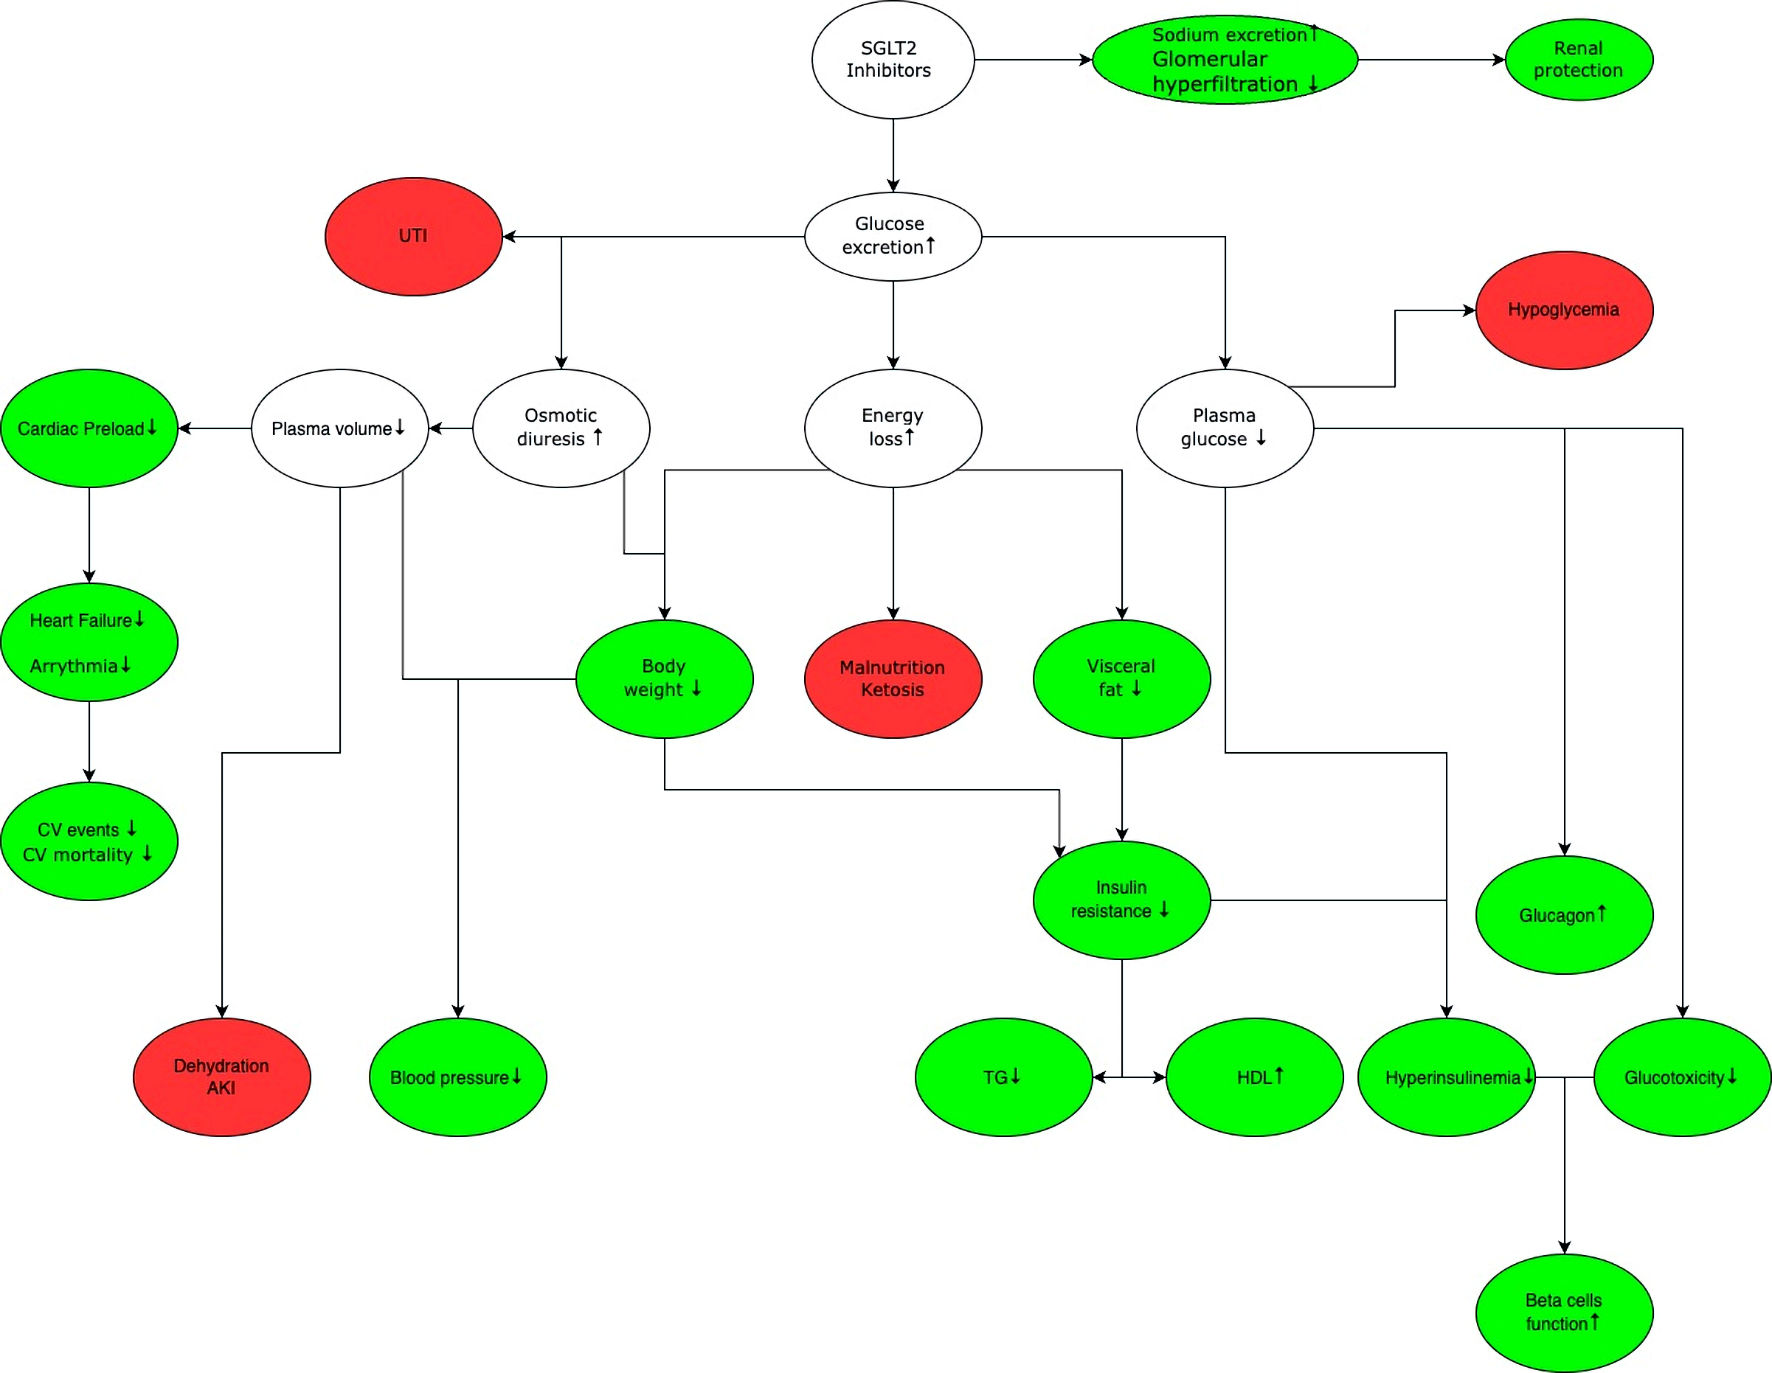
Figure 2. General mechanism of action of SGLT2 inhibitors. The green color marks benefits associated with the use of SGLT2 inhibitors, while white indicates the effects that can lead to benefits and/or adverse effects depending on the clinical situation, red shows potential adverse effects associated with the use of SGLT2 inhibitors. SGLT2 inhibition increases glucose and sodium excretion. Enhanced sodium excretion and decreased renal hyperfiltration delay the progression of chronic kidney disease. Increased glucose excretion leads to osmotic diuresis, which increases the risk of urinary tract infection, and sepsis. Increased diuresis reduces cardiac preload, thereby reducing the risk of cardiovascular events and mortality. In addition, there is a decrease in blood glucose levels, which reduces the need for insulin and glucotoxicity on the vascular endothelium, improving function of pancreatic beta cells. Glucose excretion leads to energy loss and weight loss, which lowers blood pressure and increases insulin sensitivity. It is important to note that while SGLT2 inhibitors do not cause hypoglycemia in monotherapy, they may increase the risk of occurrence of hypoglycemia when used in combination with other drugs that have hypoglycemic effect (e.g., insulin, sulfonylurea derivatives). SGLT2: sodium-glucose cotransporter 2; UTI: urinary tract infection; CV: cardiovascular; AKI: acute kidney injury; TG: triglycerides; HDL: high-density lipoprotein.
Figure 3.
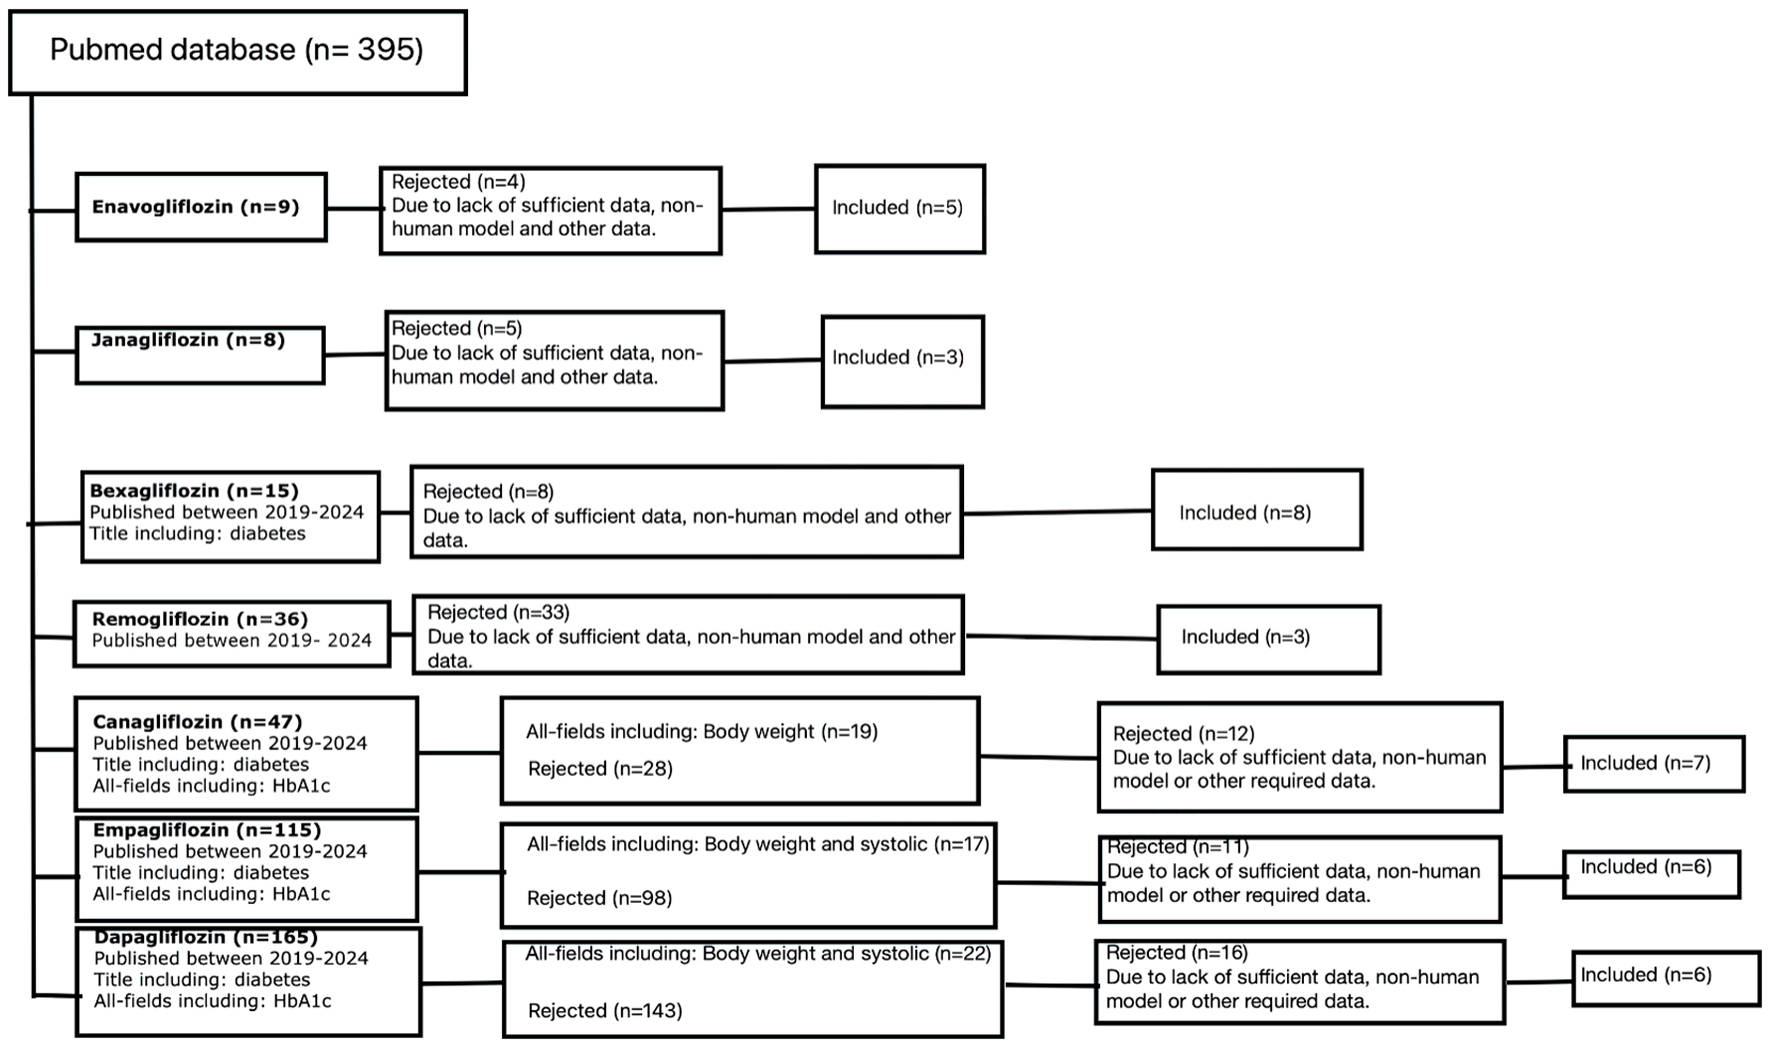
Figure 3. Out of the 395 initially obtained results, 38 were eventually included in this review. The selection process involved scaling up with additional criteria based on the available pool of results for a given flozin, as well as a content analysis that rejected papers which were off topic, did not contain sufficient data, or involved non-human models. N: number of papers.

Tables

Table 1. Effectiveness of Enavogliflozin in Reducing HbA1c, Body Weight, and Systolic Blood Pressure
 
PublicationHbA1c change95% CIBW change (kg)95% CISBP change (mm Hg)95% CINo. of subjectsNotes
In all cases, enavogliflozin showed greater efficacy than placebo, similar to or greater than dapagliflozin. a, b, cChanges in parameters respectively for 0.1 mg, 0.3 mg and 0.5 mg dose. CI: confidence interval; BW: body weight; SBP: systolic blood pressure; N/D: no data; MD: mean difference; HbA1c: hemoglobin A1c.
Dutta et al, 2023 [62]-0.76%-0.93 to -0.60-1.37-1.73 to -1.00-4.99-7.83 to -2.16684Compared to dapagliflozin, patients receiving enavogliflozin had significantly lower HbA1c MD -0.06% (95% CI: 0.07 - 0.05); P < 0.00001
Han et al, 2023 [63]-0.80%N/D-3.77N/D-5.93N/D200-
Kim et al, 2023 [64]-0.92%N/D-3.2N/D-4.5N/D270-
Kwak et al, 2023 [65]-0.99%-1.24% to -0.74%-2.5-3.3 to -1.6 kg-7.3N/D167-
Yang et al, 2023 [66]-0.79%aN/D-2.03aN/D-2.4aN/D1940.1 mga
-0.89%b-1.90b-3.3b0.3 mgb
-0.92%c-2.84c-6.5c0.5 mgc


Table 2. Effectiveness of Bexagliflozin in Reducing HbA1c, Body Weight, and Systolic Blood Pressure
 
PublicationHbA1c change95% CI or SEBW change (kg)95% CI or SESBP change (mm Hg)95% CI or SENo. of subjectsNotes
Studies with sitagliptin and glimepiride have shown similar effectiveness of bexagliflozin in reducing HbA1c. a, b, cChanges in parameters respectively for 5 mg, 10 mg, and 20 mg dose. CI: confidence interval; SE: standard error; BW: body weight; SBP: systolic blood pressure; CKD: chronic kidney disease; N/D: no data; HbA1c red: glycated hemoglobin reduction; CKD 3a: chronic kidney disease stage 3a; CKD 3b: chronic kidney disease stage 3b.
Allegretti et al, 2019 [76]-0.37%-0.20% to -0.54%-1.61N/D-3.8N/D312Subjects with CKD 3a, HbA1c reduction: -0.31%; CKD 3b: -0.43%
Halvorsen et al, 2019 [77]-0.79%-0.53% to -1.06%N/DN/DN/DN/D288
Halvorsen et al, 2019 [78]-0.74%-0.62% to -0.86%-3.35-2.84 to -3.85 kg-4.23-2.28 to -6.18 mm Hg370The reduction in HbA1c in the bexagliflozin group was slightly lower than that in the sitagliptin-treated group.
Halvorsen et al, 2020 [79]-0.55%a-0.34% to -0.76%aN/DN/DN/DN/D2925 mga
-0.68%b-0.47% to -0.89%b10 mgb
-0.80%c-0.59% to -1.01%c20 mgc
Dholariya et al, 2023 [80]-0.45%-0.34% to -0.55%-1.77-1.10 to -2.44 kg-4.11-2.03 to -6.18 mm HgN/DMeta-analysis; 20 mg dose
Halvorsen et al, 2023 [81]-1.09%-0.94% to -1.24%-2.51-1.57 to -3.45 kg-7.07-4.32 to -9.83 mm Hg31720 mg dose
Halvorsen et al, 2023 [82]-0.55 mmol/mol-1.20 to -2.30 mmol/mol-4.31-3.52 to -5.10 kg-6.53-2.51 to -10.56 mm Hg426Dose 20 mg, establishing noninferiority of bexagliflozin to glimepiride
Pasqualotto et al, 2023 [83]-0.53%-0.31% to -0.75%-1.61-0.57 to -2.32 kg-4.66-2.92 to -6.41 mm Hg3,111


Table 3. The Effectiveness of Remogliflozin in Reducing HbA1c, Body Weight, and/or Systolic Blood Pressure
 
PublicationHbA1c change95% CI or SEBW change (kg)95% CI or SESBP change (mm Hg)95% CI or SENo. of subjectsNotes
Changes from baseline were presented in the first publication. In the second publication, the mean difference between the remogliflozin group and the dapagliflozin or pioglitazone groups was reported. The third publication presents the mean difference between the vildagliptin + remogliflozin group and the empagliflozin + linagliptin group. a, bChanges in parameters respectively for 100 mg BID and 250 mg BID dose. CI: confidence interval; SE: standard error; BW: body weight; SBP: systolic blood pressure; BID: bis in die (twice a day); N/D: no data.
Dharmalingam et al, 2020 [86]-0.72%a± 0.09a, b-2.94a-0.22a, b-2.6a, bN/D612Results after 24 weeks, non-inferiority found between remogliflozin and dapagliflozin group. Dose 100 mg BIDa, 250 mg BIDb, change from baseline
-0.77%b-3.17b
Dutta et al, 2021 [85]-0.13%-0.35% to 0.09%-2.79-3.07 to -2.51 kgN/DN/D535Mean difference between remogliflozin and dapagliflozin and pioglitazone groups
Khaladkar et al, 2022 [87]-0.08%-0.28% to 0.13%N/DN/DN/DN/D400Mean difference between vildagliptin + remogliflozin (50 mg + 100 mg BID) vs. empagliflozin + linagliptin (25 mg + 5 mg)


Table 4. Effectiveness of Canagliflozin in Reducing HbA1c, Body Weight and/or Systolic Blood Pressure
 
PublicationHbA1c change95% CI or SEBW change (kg)95% CI or SESBP change (mm Hg)95% CI or SENo. of subjectsNotes
Canagliflozin was found to significantly reduce HbA1c in all presented studies. a, bChanges in parameters in canagliflozin vs. placebo group respectively after 6 months and 12 months. c, d, eChanges in parameters respectively for CANA 100 mg + LIRA 1.2 mg, CANA 100 mg, and LIRA 1.2 mg. CI: confidence interval; SE: standard error; BW: body weight; SBP: systolic blood pressure; CANA: canagliflozin; LIRA: liraglutide; N/D: no data.
Bhosle et al, 2019 [95]-1.90%N/D-3.01N/DN/DN/D118Canagliflozin 100 mg added to triple drug regimen
Cusi et al, 2019 [96]-0.71%-1.08% to -0.33%-3.4%-5.4% to -1.4%N/DN/D56300 mg vs. placebo
Perkovic et al, 2019 [93]-0.31%-0.26% to -0.37%-0.80-0.69 to -0.92 kg-3.30-2.73 to -3.87 mm Hg4,401100 mg vs. placebo after 13 weeks of treatment
Woo et al, 2019 [97]-0.90%a-1.02% to -0.78%a-3.24N/DN/DN/D527Canagliflozin vs. placebo, after 6 monthsa and 12 monthsb
-1.04%b-1.15% to -0.92%b
Ali et al, 2020 [98]-1.67%c0.29c-6.0c0.8c-5.2c2.2a45Canagliflozin plus liraglutide vs. each alone after 16 weeks from baseline.
-0.89%d0.24d-3.5d0.5d-5.1d3.8bCANA 100 mg + LIRA 1.2 mgc
-1.44%e0.39e-1.9e0.8e-14.1e3.0cCANA 100 mgd
LIRA 1.2 mge
Kadowaki et al, 2022 [99]-0.43%0.93%-1.295.57kgN/DN/D821Teneligliptin/canagliflozin combination tablets, evaluated after 12 months
Gorgojo-Martinez et al, 2023 [100]-0.33%-0.57% to -0.10%-1.8N/D-5.3-8.6 to -1.9 mm Hg3176 months after change from CANA 100 mg to 300 mg


Table 5. The Effectiveness of Empagliflozin in Reducing HbA1c, Body Weight and SBP
 
PublicationHbA1c change95% CI or SEBW change (kg)95% CI or SESBP change (mm Hg)95% CI or SENo. of subjectsNotes
Significant reductions in each of these parameters were achieved in every study presented. a, bChanges in parameters respectively for 10 mg and 25 mg empagliflozin groups. c, dChanges in SBP after 24 weeks, respectively for groups with initial SBP > 140 mm Hg and 130 - 140 mm Hg. CI: confidence interval; SE: standard error; BW: body weight; SBP: systolic blood pressure.
de Boer et al, 2020 [102]-0.44%1.18-2.251.89 kg-6.9815.03 mm Hg125After 12 weeks of treatment with 25 mg dose, empagliflozin was inferior to licogliflozin
Gupta et al, 2021 [103]-1.10%0.64-2.641.97 kg-7.685.2347After 12 weeks from baseline, empagliflozin 25 mg + linagliptin 5 mg
Inzucchi et al, 2021 [104]-0.73%a0.14a-2.11a0.46a-6.3c-8.4 to -4.2c637Empagliflozin 10 mga vs. 25 mgb vs. placebo after 24 weeks, SBP at baseline > 140 mm Hgc and 130 - 140 mm Hgd
-0.97%b0.15b-2.93b0.47b-4.0d-5.9 to -2.1d
Liu et al, 2021 [105]-1.01%0.16-1.50.4-5.01.6106Empagliflozin was superior to linagliptin after 24 weeks from baseline (25 mg vs. 5 mg)
Althobaiti et al, 2022 [106]-0.93%-1.54% to -0.32%-0.874-4.36 to -6.10-3.85-6.81 to -0.88256
Khan et al, 2022 [107]-0.97%0.68-1.152.56-13.1413.29120


Table 6. The Effectiveness of Dapagliflozin in Reducing HbA1c, Body Weight, and Systolic Blood Pressure
 
PublicationHbA1c change95% CI or SEBW change (kg)95% CI or SESBP change (mm Hg)95% CI or SENo. of subjectsNotes
The change in HbA1c ranged from -0.73% to -1.6%, while body weight decreased by -1.4 kg to -3.58 kg depending on the study group. Additionally, reductions in systolic blood pressure were observed in dapagliflozin-treated patients in all presented publications. aEarly users group. bLate users group. cSubgroup with HbA1c at baseline > 7.5%. dSubgroup with HbA1c at baseline > 8%. CI: confidence interval; SE: standard error; BW: body weight; SBP: systolic blood pressure; n/d: no data.
McGurnaghan et al, 2019 [112]-1.39%-1.45% to -1.32%-2.20-2.34 to -2.06 kg-4.32-4.84 to -3.79 mm Hg8,566
Wilding et al, 2019 [113]-1.54%a-1.65% to -1.44%a-3.31%a-4.37% to -2.25%a2.5a-3.89 to -1.11a3,774Early usersa vs. late usersb
-1.02%b-1.08% to -0.97%b-4.06%b-5.05% to -3.07%b2.84b-3.67 to -2.01b
Chen et al, 2020 [114]-0.73%-0.8% to -0.67%-1.61-1.79 to -1.42-3.6N/D1,960
Frias et al, 2020 [115]-1.35%0.07-3.10.3-2.60.9444Dapagliflozin plus saxagliptin
Han et al, 2023 [63]-0.75%0.06-3.580.34-6.571.04200
Sethi et al, 2023 [116]-1.1%c1.44c-1.4c3.31c-4.5c, d14.9c3,616Dapagliflozin as an add-on therapy.
-1.6%d1.41d-1.5d3.22d15.1dSubgroup HbA1c > 7.5%c and > 8%d