Journal of Endocrinology and Metabolism, ISSN 1923-2861 print, 1923-287X online, Open Access
Article copyright, the authors; Journal compilation copyright, J Endocrinol Metab and Elmer Press Inc
Journal website https://www.jofem.org

Original Article

Volume 14, Number 1, February 2024, pages 40-47


Increased Prevalence of Advanced Metabolic Dysfunction-Associated Steatotic Liver Disease Fibrosis in Type 2 Diabetics Despite Low-Risk Fibrosis-4 Index Scores

Figures

Figure 1.
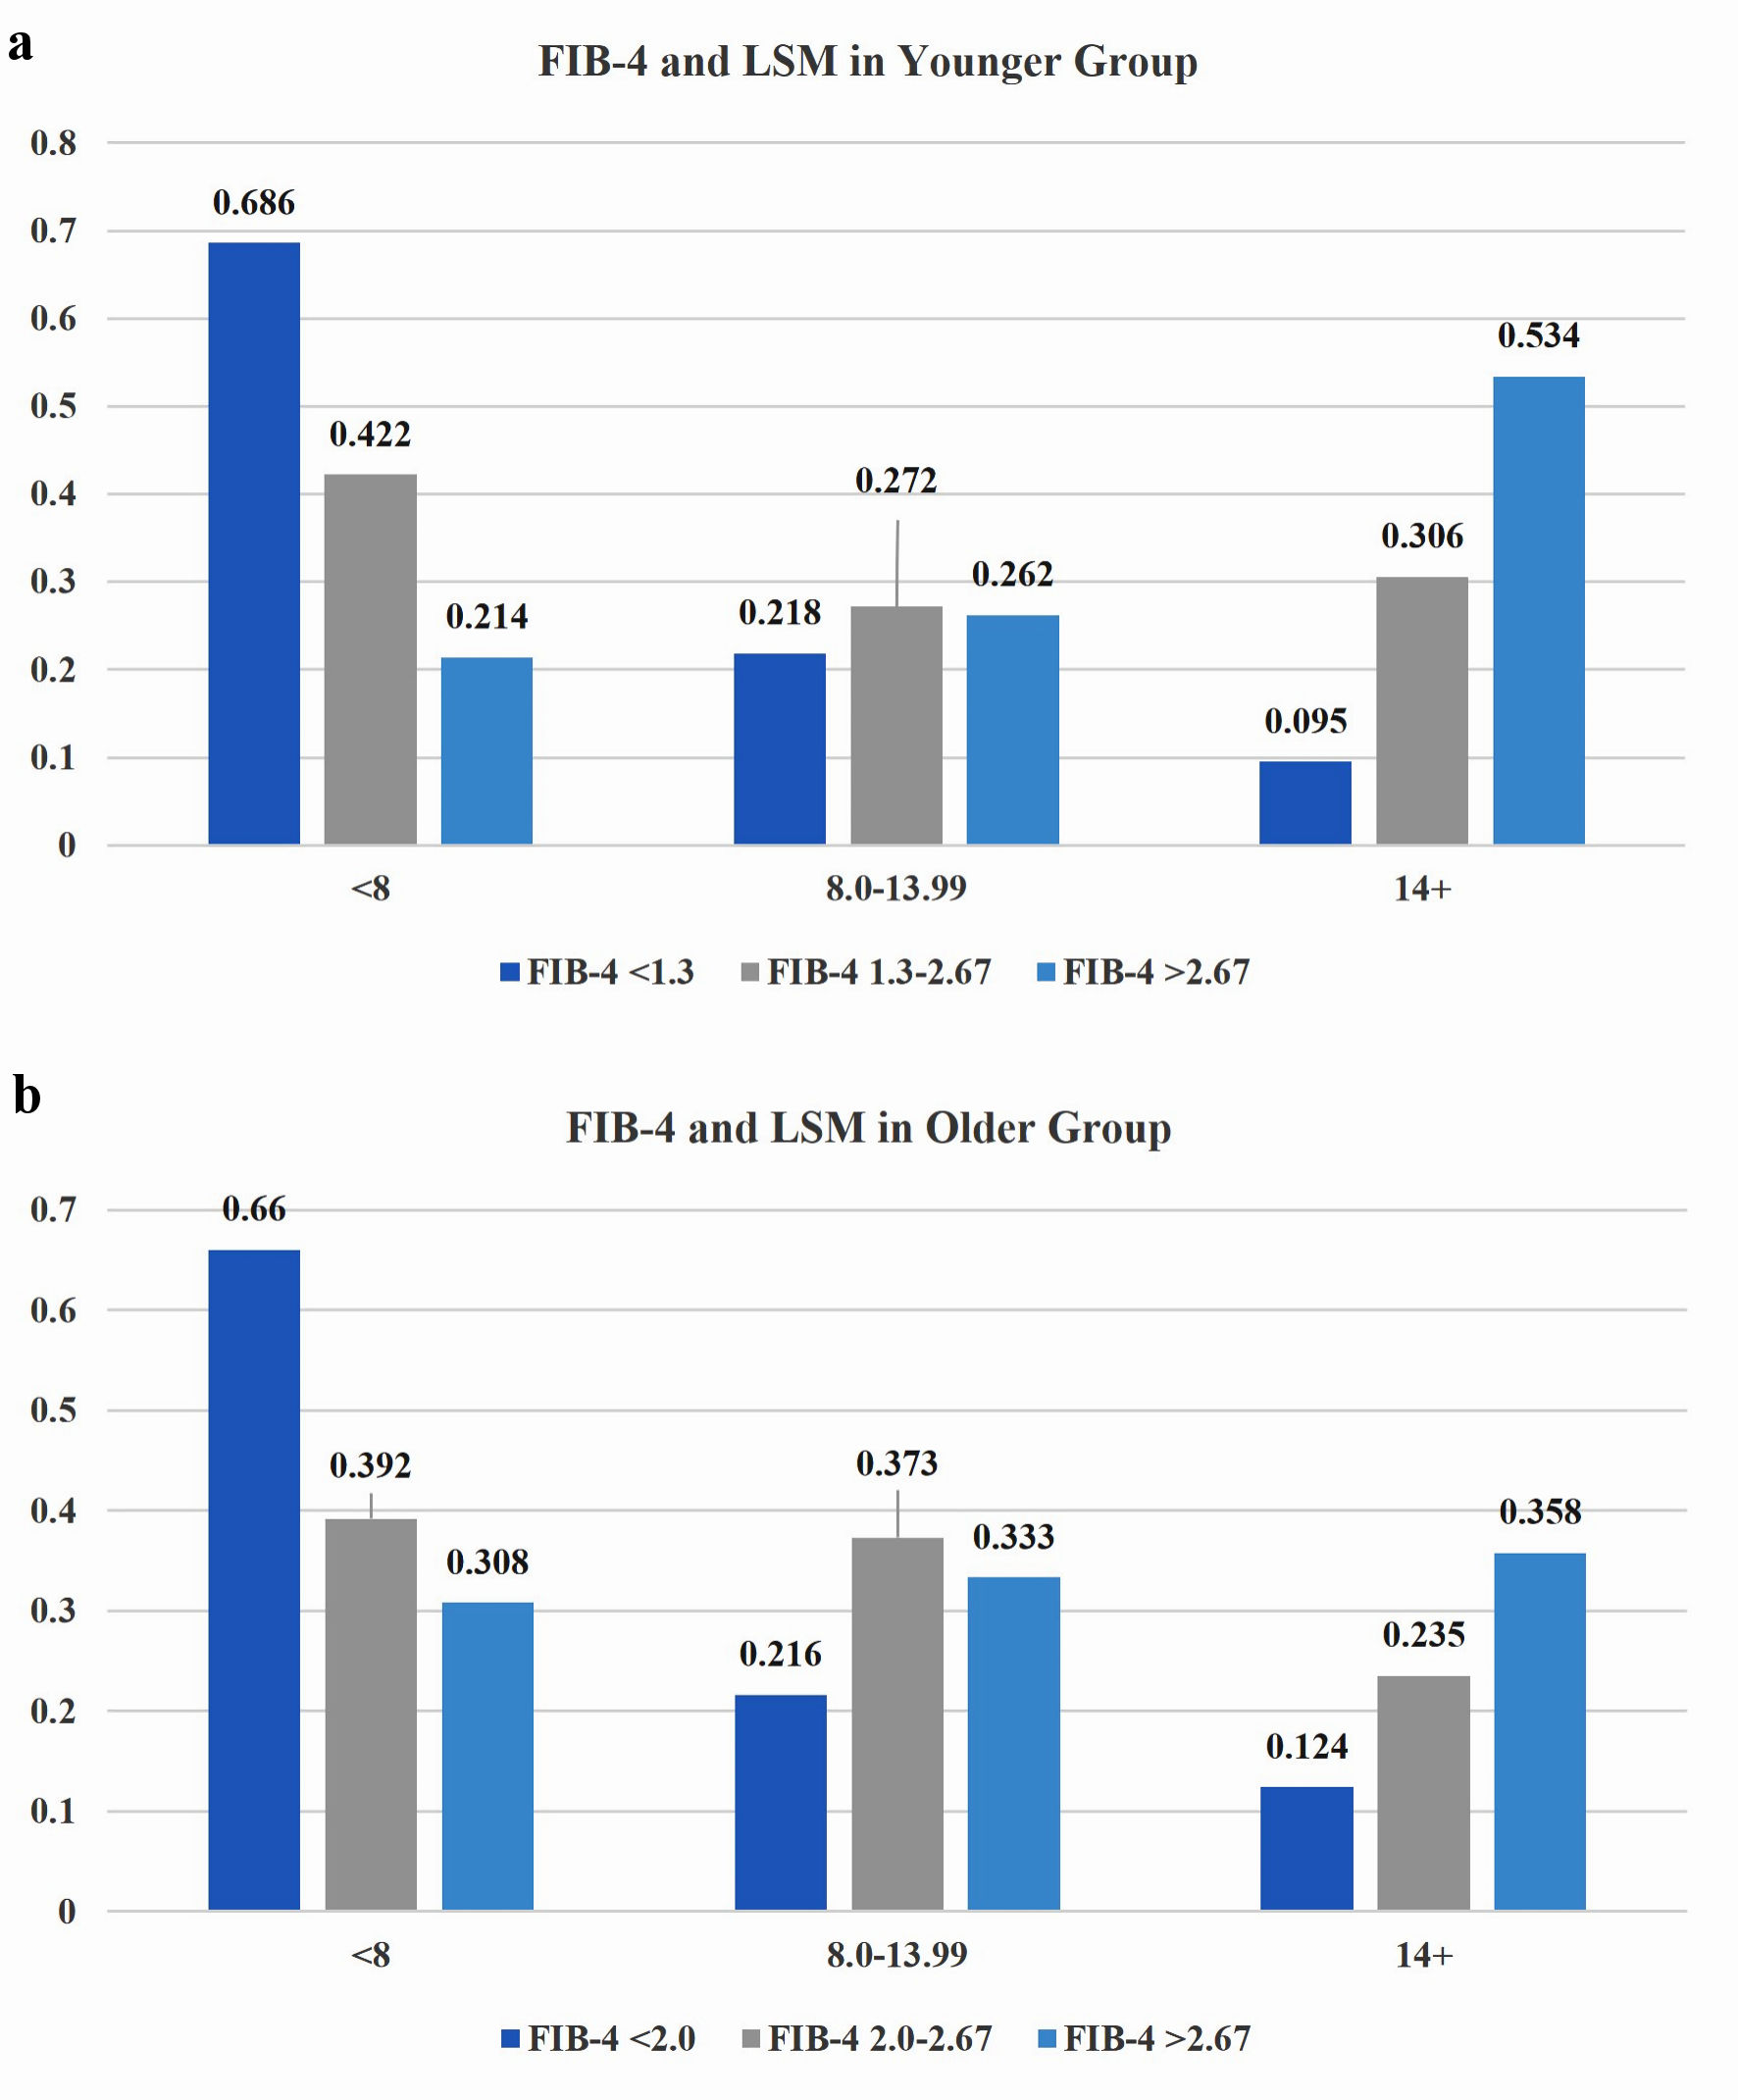
Figure 1. Among young adults, 31.4% (a), and among older adults, 34% (b), with a low-risk FIB-4, have significant to advanced LSM values. There is a significant stepwise decrease for FIB-4 scores for LSM < 8 kPa and increase in FIB-4 score for LSM 14+ kPa in both the young and old adult cohorts. The 8 - 13.99 kPa group have an equal distribution of FIB-4 scores in both age groups. LSM: liver stiffness measurement; FIB-4: fibrosis-4 index.
Figure 2.
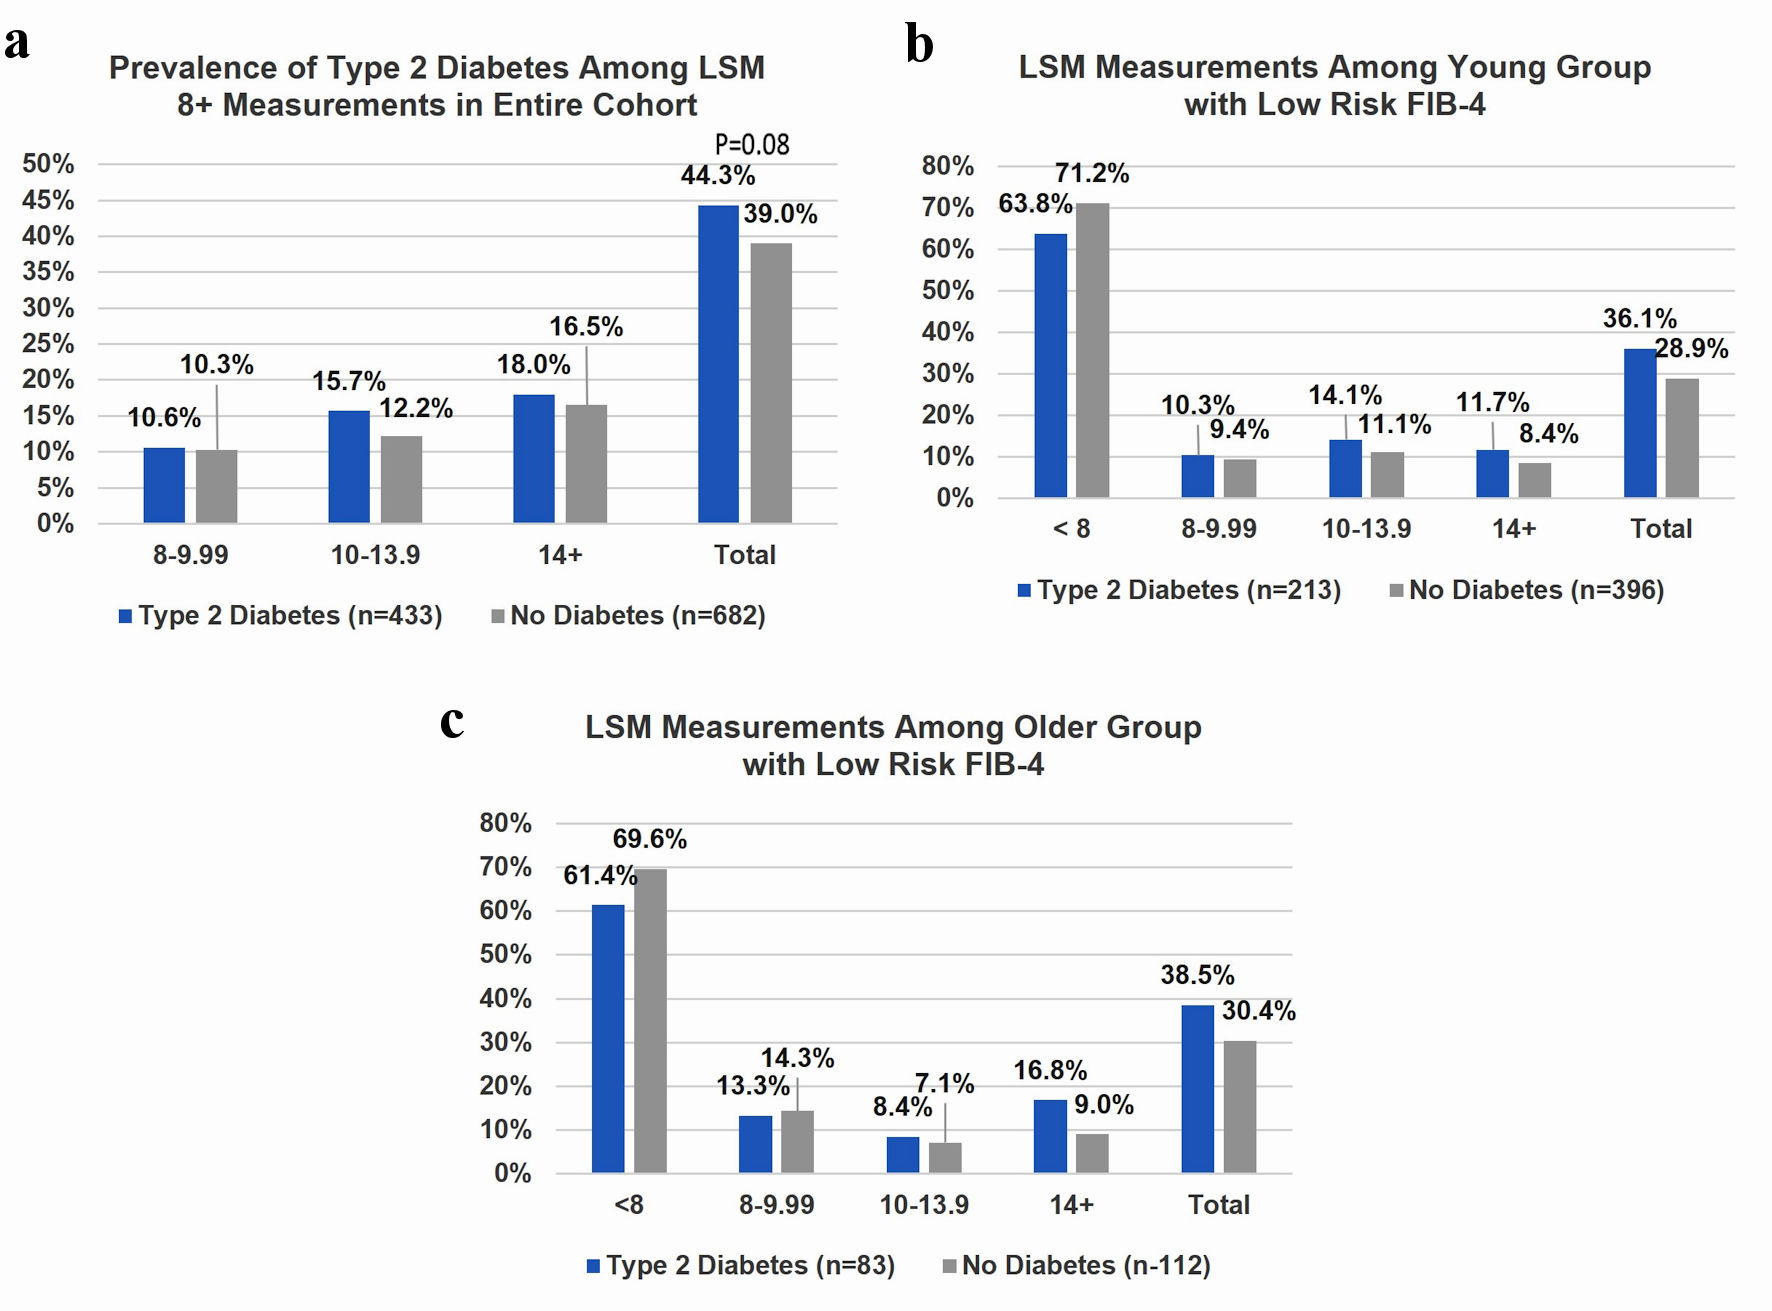
Figure 2. (a) In the entire cohort of subjects (n = 1,115) with and without diabetes and significant LSM (8+ kPa), no statistical differences were noted in either the total (P = 0.08) or any of the individual LSM categories. (b) Thirty-one point four percent of young adults with a low-risk FIB-4 (n = 609) have significant to advanced LSM values, and the proportion was similar to older group. There was no significant difference between LSM measurements for younger diabetic and non-diabetic patients. (c) One hundred ninety-five older patients had low risk FIB-4 scores, and 34% of older subjects with a low-risk FIB-4 have significant to advanced LSM values. Older diabetic patients were more likely to have 14+ kPa despite a low risk FIB4 score. LSM: liver stiffness measurement; FIB-4: fibrosis-4 index.
Figure 3.
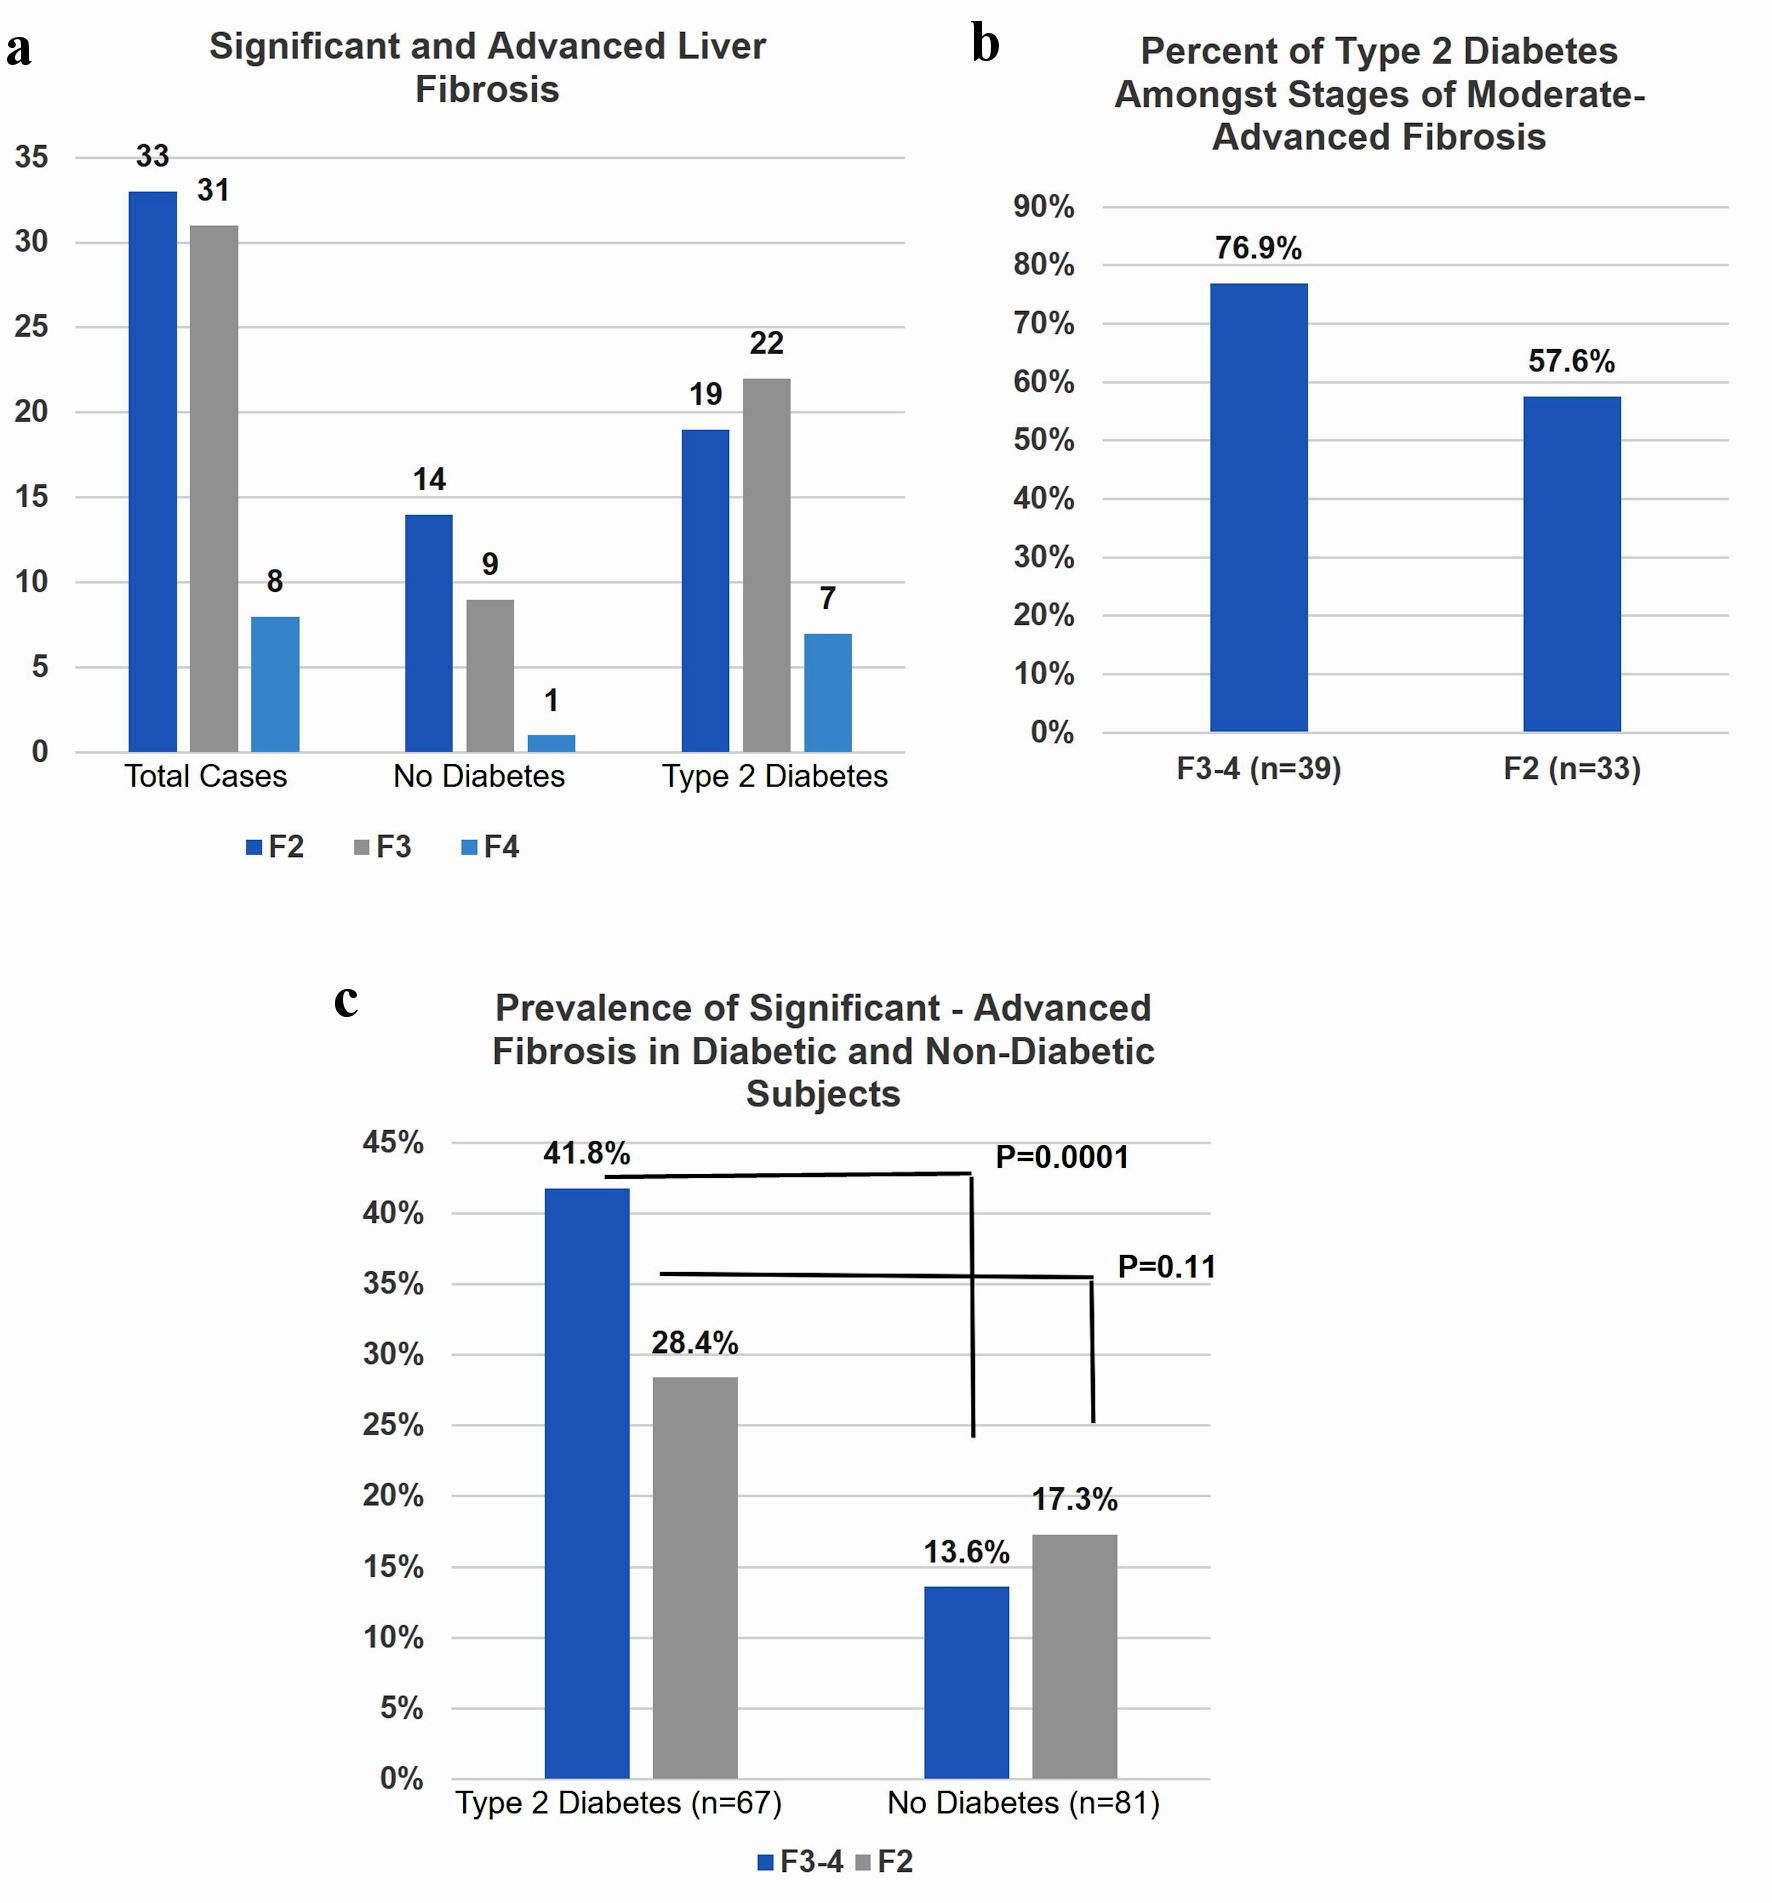
Figure 3. (a) Seventy-two subjects underwent liver biopsy had F2+. (b) The majority of both F2 and F3-4 subjects had type 2 diabetes. (c) Diabetic patients were significantly more likely to have F3 and F4 on biopsy despite low risk FIB4 score compared to non-diabetic patients. F2: significant fibrosis; F3: advanced fibrosis; F4: cirrhosis.

Table

Table 1. Demographics of Entire Cohort and Age Adjusted Low-Risk Groups
 
Entire cohort (n = 1,115)Age < 65 and low risk FIB-4 (n = 609)Age 65+ and low risk FIB-4 (n = 195)P value
Avg: average; BMI: body mass index; CAP: controlled attenuation parameter; LSM: liver stiffness measurement; SD: standard deviation.
Sex (%) female686661NS
Age (years), Avg (SD) (range)53.7 (14.0) (18 - 89)45.6 (11.2) (18 - 64)70.2 (4.1) (65 - 86)< 0.0001
BMI (kg/m2), Avg (SD) (range)35.2 (7.2) (10.6 - 72)36.2 (7.4) (10.6 - 72)32.5 (6.4) (16.7 - 60.4)< 0.0001
Type 2 diabetes (%)3935430.04
HTN (%)5754670.001
Dyslipidemia (%)5744570.002
AST (IU/L), Avg (SD) (range)36.9 (26.7) (7 - 302)30.9 (19.1) (7 - 173)26.9 (11.8) (8 - 102)0.006
ALT (IU/L), Avg (SD) (range)47.8 (36.5) (6 - 335)47.4 (37.8) (6 - 335)32.7 (19.6) (7 - 122)< 0.0001
FIB-4, Avg (SD) (range)1.32 (0.97) (0.18 - 9.65)0.77 (0.26) (0.18 - 1.29)1.36 (0.36) (0.3 - 1.99)< 0.0001
LSM (kPa), Avg (SD) (range)9.7 (8.4) (2.5 - 75)7.9 (4.7) (2.5 - 33.1)8.6 (6.9) (2.6 - 75)< 0.0001
CAP (dB/m), Avg (SD) (range)333.8 (42.8) (250 - 400)336.9 (42.0) (250 - 400)321.3 (43.6) (250 - 400)< 0.0001