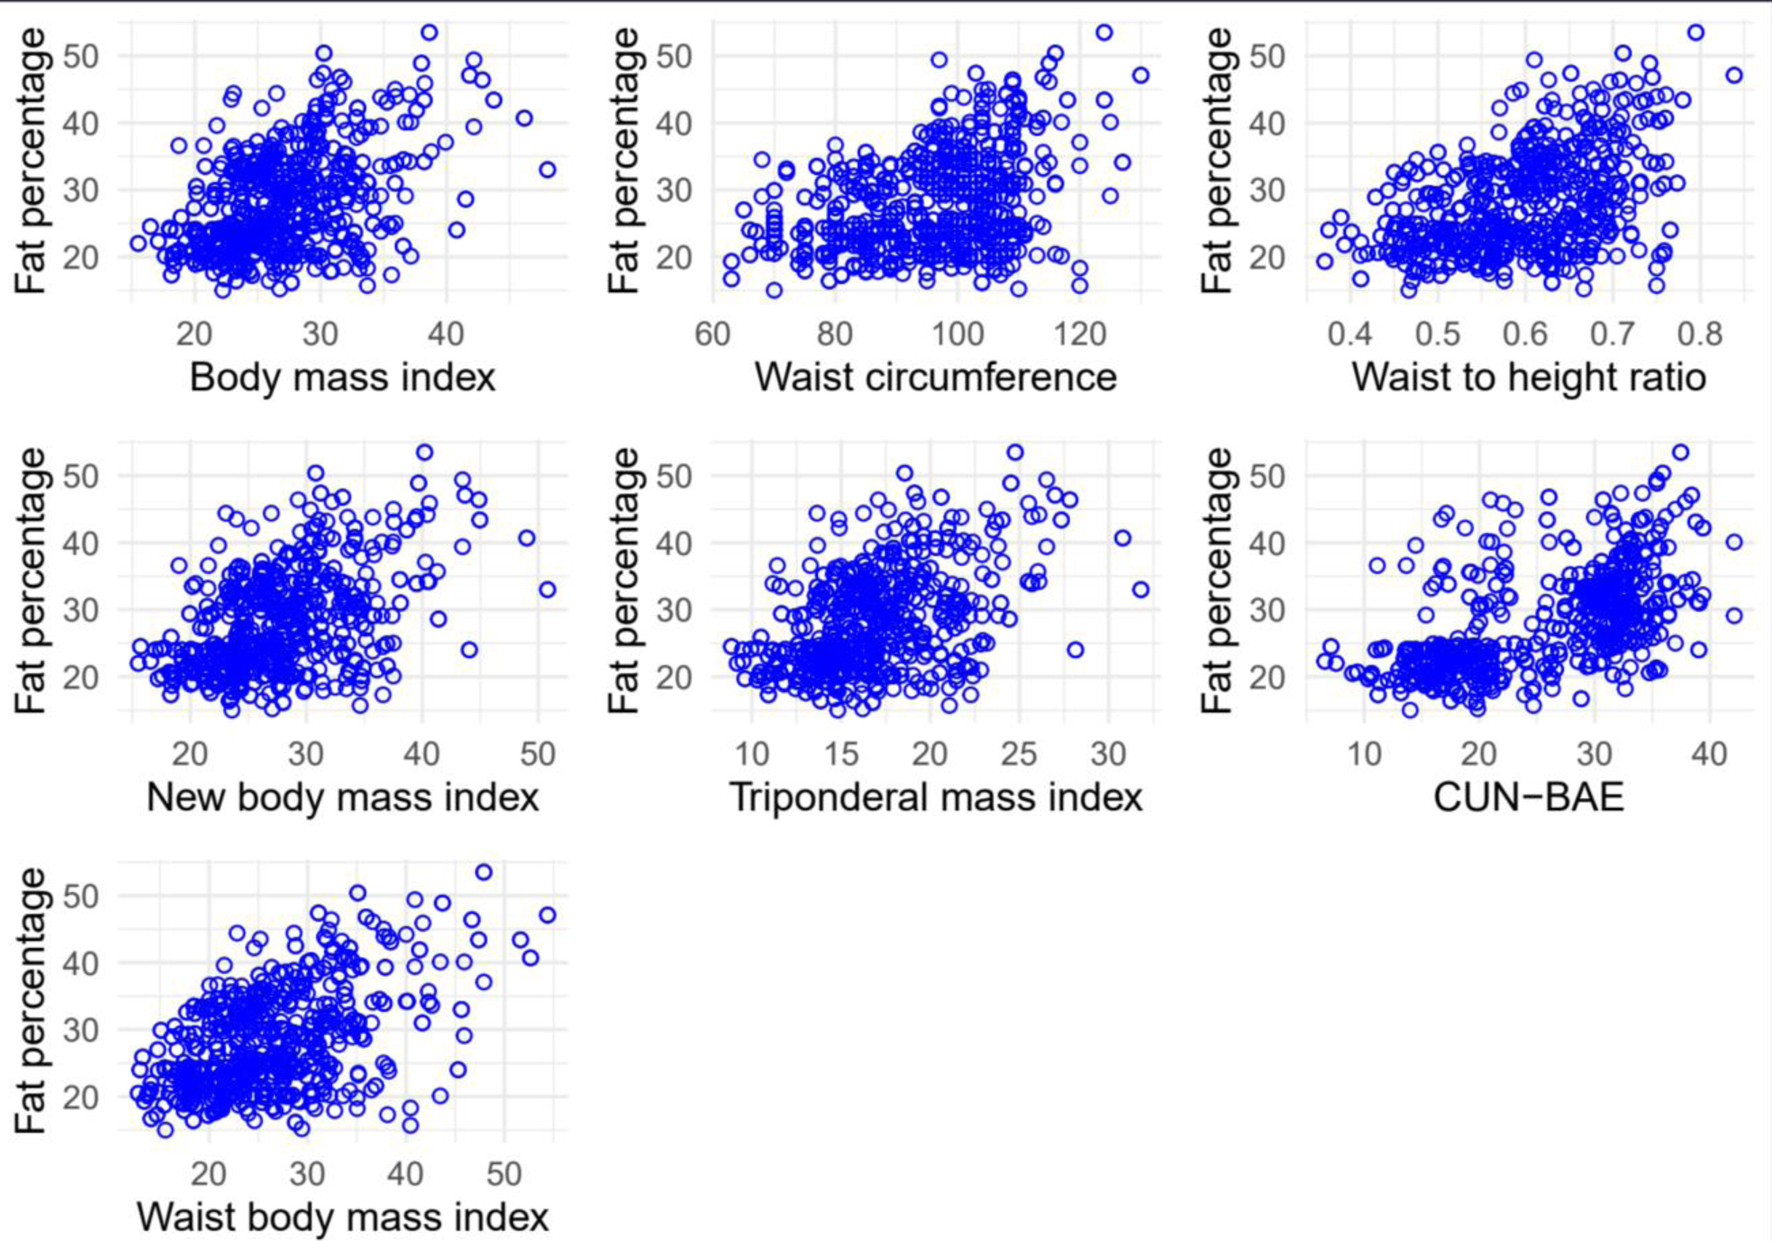
Figure 1. Scatter plot between the percentage of fat and each anthropometric marker evaluated.
| Journal of Endocrinology and Metabolism, ISSN 1923-2861 print, 1923-287X online, Open Access |
| Article copyright, the authors; Journal compilation copyright, J Endocrinol Metab and Elmer Press Inc |
| Journal website https://www.jofem.org |
Original Article
Volume 14, Number 1, February 2024, pages 13-20
Waist Body Mass Index Outperforms Other Anthropometric Indicators in Identifying Obesity Using Bioimpedance
Figures
Tables
| Characteristics | Obesity by fat percentage | |||
|---|---|---|---|---|
| Male | Female | |||
| No, n = 300 | Yes, n = 66 | No, n = 326 | Yes, n = 88 | |
| Data are expressed as n (%), mean (SD), or median (IQR). BMI: body mass index; CUN-BAE: Clinica Universidad de Navarra-Body Adiposity Estimator; IQR: interquartile range; SD: standard deviation. | ||||
| Age group | ||||
| 18 to 29 years old | 19 (63.33%) | 11 (36.67%) | 31 (70.45%) | 13 (29.55%) |
| 30 to 39 years old | 57 (89.06%) | 7 (10.94%) | 50 (73.53%) | 18 (26.47%) |
| 40 to 49 years old | 66 (84.62%) | 12 (15.38%) | 62 (77.50%) | 18 (22.50%) |
| 50 to 59 years old | 112 (82.35%) | 24 (17.65%) | 117 (81.25%) | 27 (18.75%) |
| 60 years to more | 46 (79.31%) | 12 (20.69%) | 66 (84.62%) | 12 (15.38%) |
| Type of job | ||||
| Administrative | 170 (81.73%) | 38 (18.27%) | 156 (75.00%) | 52 (25.00%) |
| Operator | 130 (82.28%) | 28 (17.72%) | 170 (82.52%) | 36 (17.48%) |
| Alcohol consumption | ||||
| No | 244 (79.74%) | 62 (20.26%) | 270 (78.03%) | 76 (21.97%) |
| Yes | 56 (93.33%) | 4 (6.67%) | 56 (82.35%) | 12 (17.65%) |
| Daily smoking | ||||
| No | 251 (80.45%) | 61 (19.55%) | 298 (80.11%) | 74 (19.89%) |
| Yes | 49 (90.74%) | 5 (9.26%) | 28 (66.67%) | 14 (33.33%) |
| BMI | 24.4 (4.3) | 30.1 (6.1) | 27.1 (4.5) | 30.9 (4.9) |
| Waist circumference | 92 (12) | 104 (9) | 93 (12) | 105 (9) |
| Waist-to-height ratio | 0.55 (0.08) | 0.64 (0.07) | 0.59 (0.08) | 0.67 (0.06) |
| New BMI | 24.6 (4.6) | 30.7 (6.5) | 28.1 (5.0) | 32.2 (5.3) |
| Tri-ponderal mass index | 14.7 (2.9) | 18.6 (4.2) | 17.3 (3.3) | 19.8 (3.5) |
| CUN-BAE | 17.4 (4.0) | 22.0 (4.8) | 31.5 (3.0) | 33.8 (2.7) |
| Cutoffs | AUC (95% CI) | Se (%) (95% CI) | Sp (%) (95% CI) | PPV (%) (95% CI) | NPV (%) (95% CI) | LR+ (%) (95% CI) | LR- (%) (95% CI) | |
|---|---|---|---|---|---|---|---|---|
| AUC: area under the curve; BMI: body mass index; 95% CI: 95% confidence interval; CUN-BAE: Clinica Universidad de Navarra-Body Adiposity Estimator; LR-: negative likelihood ratio; LR+: positive likelihood ratio; NPV: negative predictive value; PPV: positive predictive value; Se: sensitivity; Sp: specificity. | ||||||||
| Female | ||||||||
| BMI | 28.77 | 0.736 (0.68 - 0.79) | 70.45 (59.78 - 79.71) | 71.76 (66.56 - 76.60) | 40.26 (34.53 - 52.61) | 90 (84.87 - 92.05) | 2.50 (2.01 - 3.11) | 0.41 (0.29 - 0.57) |
| Waist circumference | 96 | 0.752 (0.703 - 0.801) | 93.18 (85.75 - 97.46) | 53.37 (47.80 - 58.89) | 35.04 (30.14 - 60.20) | 96.67 (92.74 - 97.32) | 1.99 (1.76 - 2.27) | 0.13 (0.05 - 0.28) |
| Waist-to-height ratio | 0.59 | 0.753 (0.703 - 0.802) | 98.86 (93.83 - 99.97) | 47.55 (42.02 - 53.12) | 33.72 (28.91 - 95.31) | 99.36 (96.44 - 99.49) | 1.88 (1.70 - 2.10) | 0.02 (0.003 - 0.17) |
| New BMI | 29.92 | 0.728 (0.672 - 0.784) | 67.05 (56.21 - 76.70) | 73.92 (68.80 - 78.60) | 40.97 (35.06 - 52.90) | 89.25 (83.98 - 91.50) | 2.57 (2.03 - 3.25) | 0.46 (0.33 - 0.60) |
| Tri-ponderal mass index | 17.92 | 0.715 (0.658 - 0.773) | 71.60 (60.97 - 80.69) | 66.56 (61.15 - 71.67) | 36.63 (31.37 - 48.95) | 89.67 (84.33 - 91.69) | 2.14 (0.75 - 2.62) | 0.43 (0.30 - 0.60) |
| CUN-BAE | 32.97 | 0.728 (0.672 - 0.784) | 63.64 (52.69 - 73.63) | 74.23 (69.12 - 78.89) | 40 (34.12 - 51.55) | 88.32 (82.80 - 90.75) | 2.47 (1.94 - 3.15) | 0.49 (0.37 - 0.65) |
| Waist BMI | 28.59 | 0.783 (0.735 - 0.830) | 71.59 (60.98 - 80.69) | 74.54 (69.45 - 79.18) | 43.15 (37.08 - 55.74) | 90.67 (85.77 - 92.66) | 2.81 (2.23 - 3.53) | 0.38 (0.27 - 0.53) |
| Male | ||||||||
| BMI | 25.82 | 0.778 (0.715 - 0.841) | 78.79 (66.97 - 87.89) | 69.33 (63.78 -74.50) | 36.11 (30.56 - 52.48) | 93.69 (89.02 - 95.05) | 2.56 (2.08 - 3.17) | 0.31 (0.19 - 0.49) |
| Waist circumference | 101.00 | 71.21 (58.74 - 81.69) | 36.71 (30.92 - 51.14) | 73 (67.59 - 77.94) | 36.71 (30.92 - 51.14) | 92.01(86.90 - 93.77) | 2.63 (2.07 - 3.36) | 0.39 (0.27 - 0.58) |
| Waist-to-height ratio | 0.59 | 0.807 (0.750 - 0864) | 78.78 (66.98 - 87.89) | 73.67 (68.30 - 78.56) | 39.69 (33.64 - 56.25) | 94.84 (89.60 - 95.39) | 2.99 (2.38 - 3.75) | 0.29 (0.18 - 1.46) |
| New body mass index | 26.83 | 0.785 (0.724 - 0.847) | 74.24 (61.99 - 84.22) | 73 (67.59 - 77.94) | 37.69 (31.82 - 52.84) | 92.79 (87.93 - 94.39) | 2.74 (2.18 - 3.47) | 0.35 (0.23 - 0.53) |
| Tri-ponderal mass index | 16.16 | 0.788 (0.727 - 0.849) | 74.24 (61.99 - (84.22) | 72.33 (66.90 - 77.31) | 37.12 (31.33 - 52.23) | 92.73 (87.4 - 94.33) | 2.68 (2.13 - 3.83) | 0.36 (0.24 - 0.54) |
| CUN-BAE | 19.14 | 0.779 (0.716 - 0841) | 78.79 (66.98 - 87.89) | 68.67 (63.08 - 73.87) | 35.62 (30.14 - 51.94) | 93.63 (88.93 - 94.99) | 2.51 (2.04 - 3.09) | 0.31 (0.19 - 0.49) |
| Waist BMI | 22.84 | 0..828 (0.779 - 0.878) | 89.39 (79.36 - 95.62) | 58 (52.19 - 63.65) | 31.89 (27.02 - 54.86) | 96.13 (91.89 - 96.92) | 2.13 (1.82 -2.49) | 0.18 (0.09 - 0.37) |