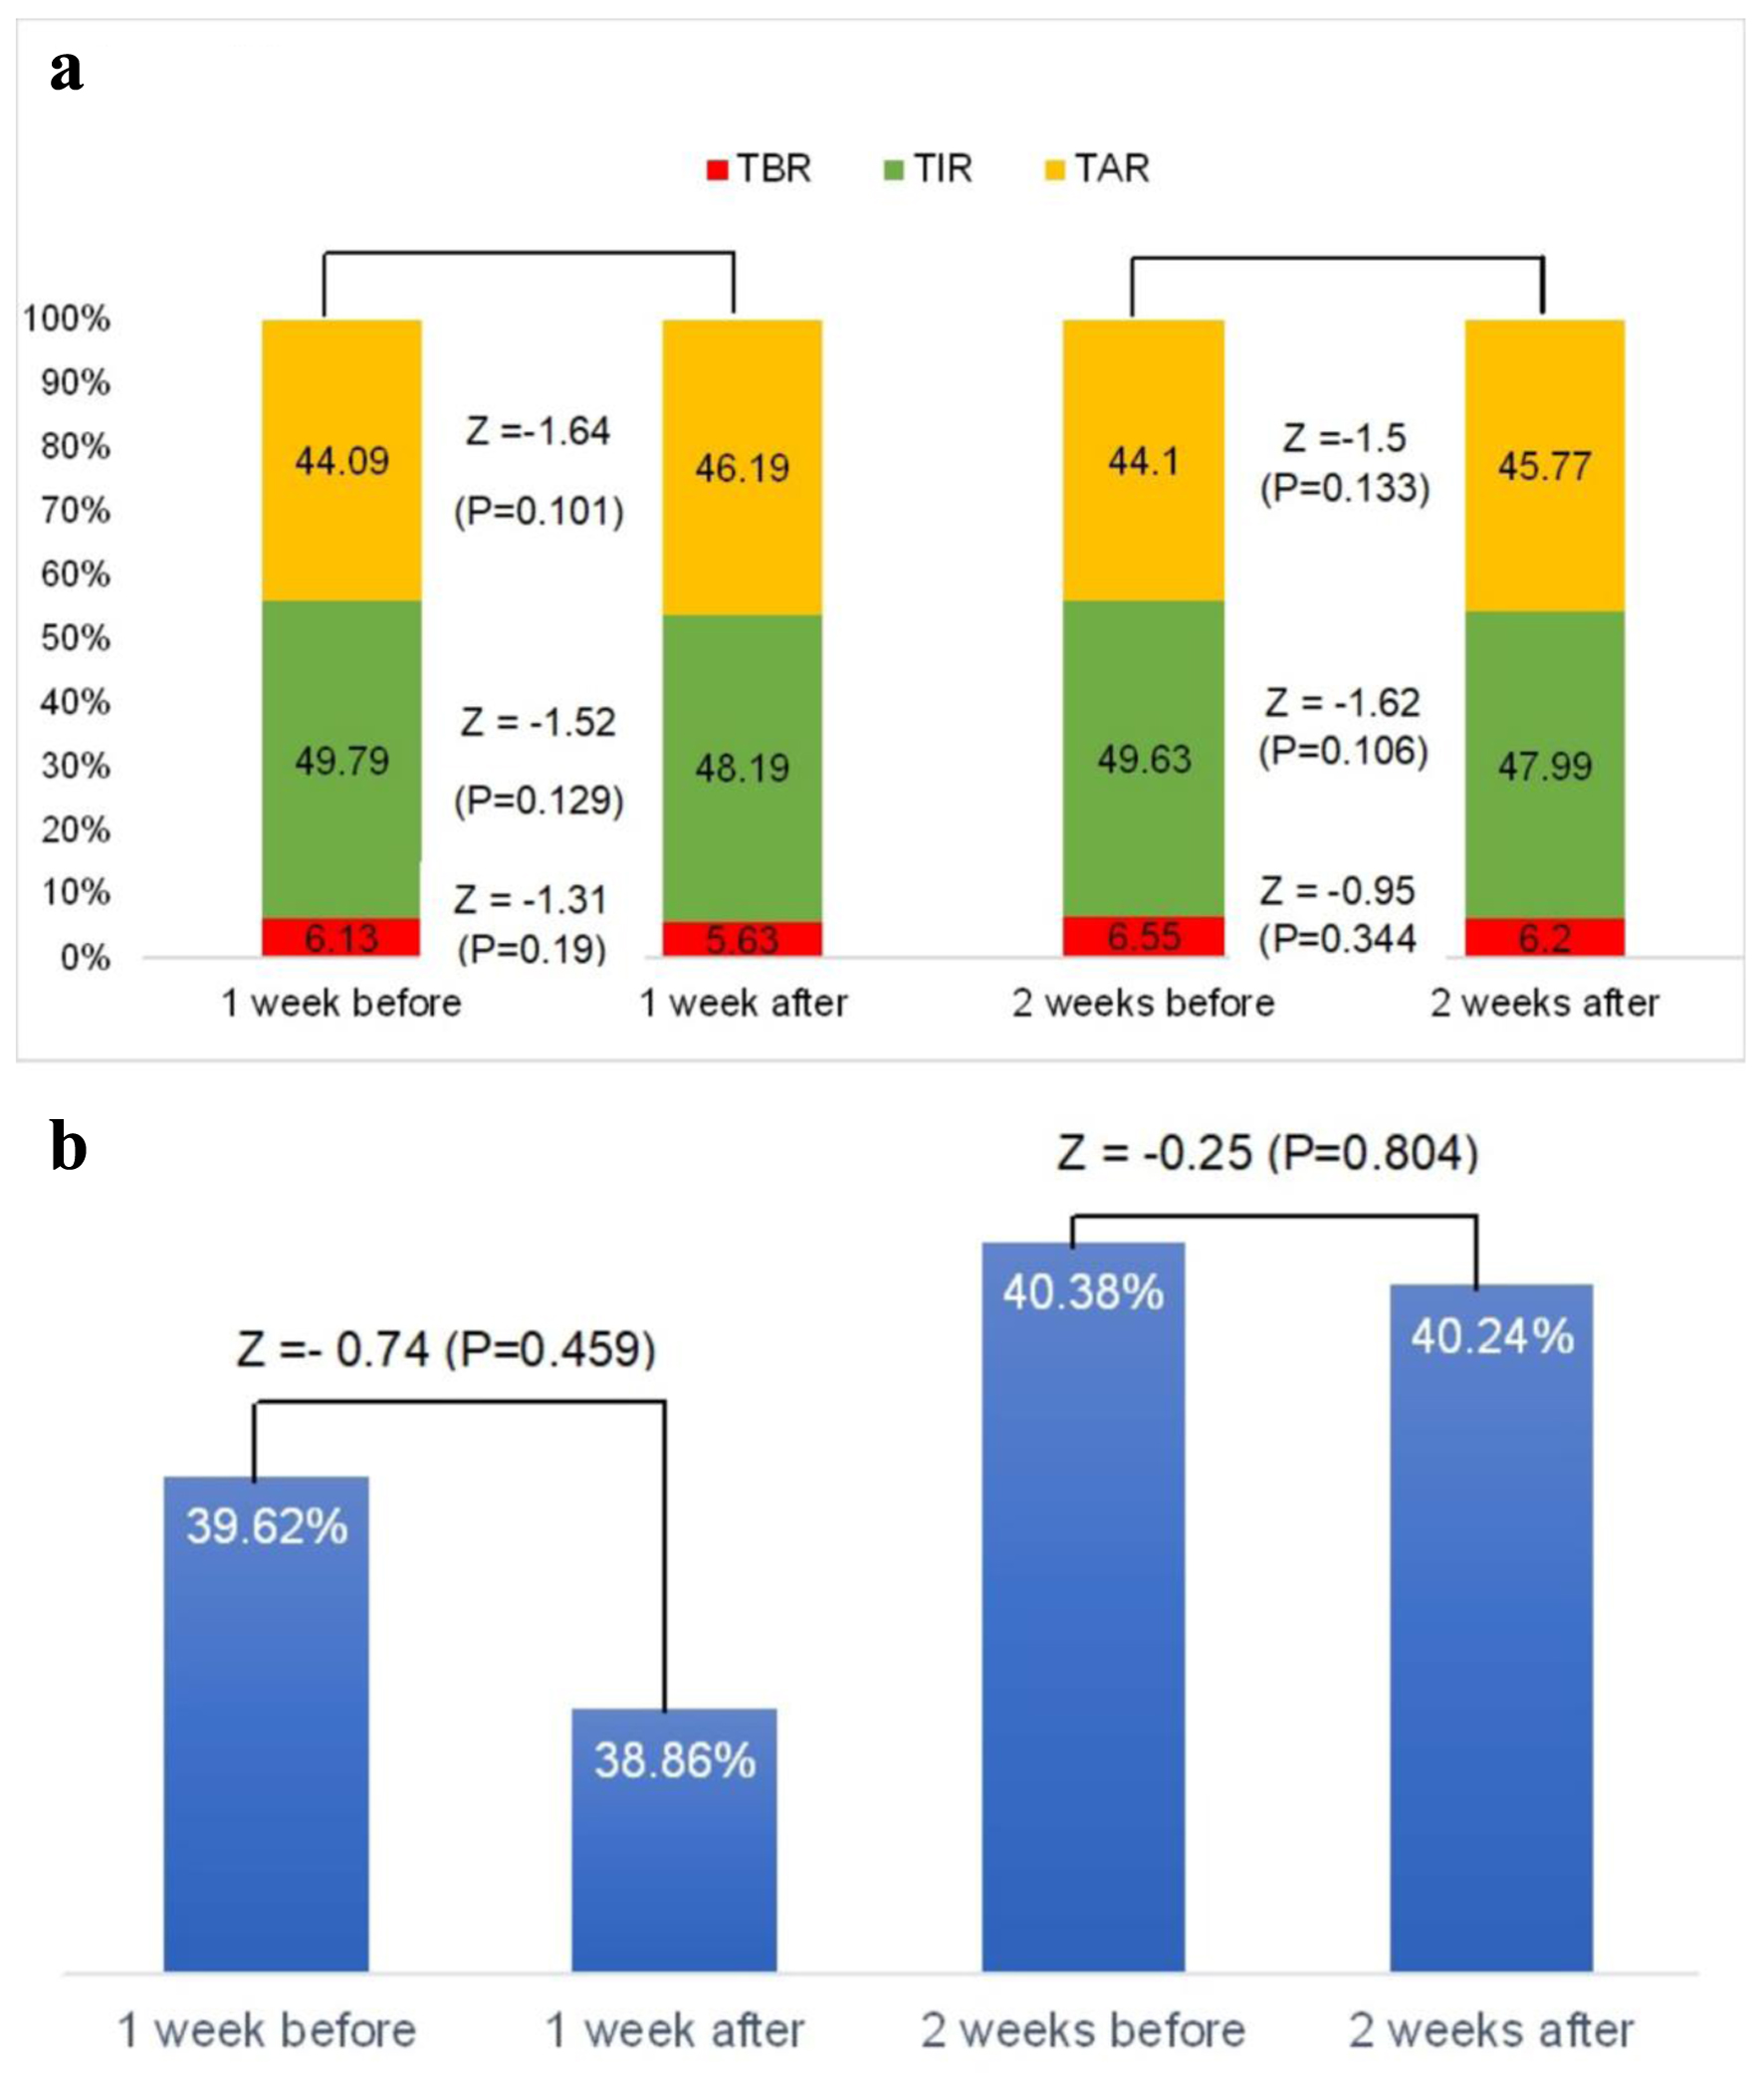
Journal of Endocrinology and Metabolism, ISSN 1923-2861 print, 1923-287X online, Open Access |
Article copyright, the authors; Journal compilation copyright, J Endocrinol Metab and Elmer Press Inc |
Journal website https://www.jofem.org |
Original Article
Volume 13, Number 4, November 2023, pages 144-152
Acute Effect of COVID-19 Vaccination on Glycemic Profile in Patients With Type 1 Diabetes Mellitus
Figure
Tables
Parameters | Mean ± SD or N (%) |
---|---|
BMI: body mass index; COVID-19: coronavirus disease 2019; HbA1c: glycated hemoglobin; SD: standard deviation. | |
Total number of patients | 44 |
Age (years) | 28.89 ± 10.28 |
Sex | |
Male | 19 (26.40%) |
Female | 53 (73.6%) |
Duration of diabetes (years) | 11.63 ± 8.68 |
BMI (kg/m2) | 26.88 ± 6.4 |
Total number of COVID-19 vaccine | 72 |
Vaccine doses | |
First dose | 22 (30.6%) |
Second dose | 22 (30.6%) |
Third dose | 28 (38.9%) |
Vaccine types | |
AstraZeneca | 3 (4.2%) |
Moderna | 7 (9.7%) |
Pfizer | 62 (86.1%) |
HbA1c before vaccine (%) | 9.02 ± 1.92 |
Fasting blood glucose before vaccine (mmol/L) | 11.79 ± 5.17 |
Medication before vaccine | |
Metformin | 10 (13.9%) |
Semaglutide | 2 (2.8%) |
Aspart | 72 (100%) |
Glargine 100 | 66 (91.7%) |
Glargine 300 | 2 (2.8%) |
Degludec | 2 (2.8%) |
Detemir | 2 (2.8%) |
Insulin doses (units) | |
Aspart | 29.1 ± 13.82 |
Glargine100 | 21.74 ± 13.82 |
Glargine 300 | 16.5 ± 0.71 |
Degludec | 39 ± 1.41 |
Detemir | 17 |
Group | Subgroup | Glycemic parameter pairs | |||||||||||||||
---|---|---|---|---|---|---|---|---|---|---|---|---|---|---|---|---|---|
TIR | TAR | TBR | GV | ||||||||||||||
1 week before vs. 1 week after | 2 weeks before vs. 2 weeks after | 1 week before vs. 1 week after | 2 weeks before vs. 2 weeks after | 1 week before vs. 1 week after | 2 weeks before vs. 2 weeks after | 1 week before vs. 1 week after | 2 weeks before vs. 2 weeks after | ||||||||||
Z | P value | Z | P value | Z | P value | Z | P value | Z | P value | Z | P value | Z | P value | Z | P value | ||
aP ≤ 0.05. BMI: body mass index; DM: diabetes mellitus; GV: glycemic variability; HbA1c: glycated hemoglobin; TAR: time above range; TBR: time below range; TIR: time in range. | |||||||||||||||||
Age | ≤ 28 years old | -0.34 | 0.734 | -0.33 | 0.743 | -0.57 | 0.566 | -0.75 | 0.45 | -2.75 | 0.006a | -2.14 | 0.032a | -0.59 | 0.557 | -0.23 | 0.817 |
> 28 years old | -2.93 | 0.003a | -2.17 | 0.03a | -2.02 | 0.043a | -1.55 | 0.122 | -1.02 | 0.309 | -0.69 | 0.491 | -0.51 | 0.611 | -0.28 | 0.779 | |
DM duration | ≤ 10.5 years | -0.02 | 0.98 | -0.25 | 0.806 | -0.32 | 0.752 | -0.23 | 0.817 | -2.08 | 0.037a | -0.65 | 0.514 | -1.4 | 0.161 | -0.13 | 0.898 |
> 10.5 years | -2.68 | 0.007a | -2.5 | 0.012a | -2.27 | 0.023a | -2.12 | 0.034a | -0.14 | 0.888 | -0.66 | 0.507 | -0.35 | 0.729 | -0.49 | 0.626 | |
BMI before | ≤ 27.4 kg/m2 | -1.1 | 0.27 | -0.99 | 0.323 | -1.51 | 0.13 | -0.94 | 0.348 | -1.72 | 0.086 | -0.2 | 0.844 | -0.49 | 0.622 | -0.06 | 0.948 |
> 27.4 kg/m2 | -1.43 | 0.154 | -1.3 | 0.194 | -1.12 | 0.264 | -0.9 | 0.367 | -0.16 | 0.871 | -0.32 | 0.747 | -0.6 | 0.546 | -0.26 | 0.795 | |
HbA1c before | ≤ 8.55% | -2.24 | 0.025a | -2.93 | 0.003a | -2.33 | 0.02a | -2.61 | 0.009a | -0.65 | 0.515 | -0.72 | 0.475 | -0.23 | 0.819 | 0 | 1 |
> 8.55% | -1.47 | 0.142 | -0.31 | 0.76 | -1.37 | 0.17 | -0.01 | 0.989 | -0.88 | 0.377 | 0 | 1 | -1.44 | 0.149 | 0 | 1 | |
Gender | Male | -1.04 | 0.3 | -1.57 | 0.116 | -0.57 | 0.569 | -1.61 | 0.107 | -0.88 | 0.379 | -1.24 | 0.214 | -0.47 | 0.642 | -1.01 | 0.314 |
Female | -1.15 | 0.25 | -0.86 | 0.388 | -1.49 | 0.135 | -0.7 | 0.486 | -0.98 | 0.328 | -0.38 | 0.701 | -0.58 | 0.561 | -0.34 | 0.736 | |
Vaccine type | AstraZeneca | -1.6 | 0.109 | -1.6 | 0.109 | -1.34 | 0.18 | -0.82 | 0.414 | -1.34 | 0.18 | -1 | 0.317 | -1.07 | 0.285 | 0 | 1 |
Moderna | -0.42 | 0.671 | -0.17 | 0.866 | -0.08 | 0.933 | -0.1 | 0.917 | -1.83 | 0.068 | -1.19 | 0.236 | -1.01 | 0.31 | -1.15 | 0.249 | |
Pfizer | -1.48 | 0.138 | -1.52 | 0.128 | -1.49 | 0.136 | -1.49 | 0.137 | -0.86 | 0.388 | -0.97 | 0.334 | -0.27 | 0.79 | -0.17 | 0.863 | |
Vaccine dose | First dose | -0.43 | 0.664 | -0.43 | 0.667 | -0.07 | 0.94 | -0.77 | 0.444 | -1.9 | 0.058 | -1.7 | 0.09 | -0.1 | 0.917 | -0.02 | 0.986 |
Second dose | -1.23 | 0.219 | -1.25 | 0.211 | -1.14 | 0.254 | -1.27 | 0.204 | -0.86 | 0.388 | -0.97 | 0.333 | -0.13 | 0.896 | -0.02 | 0.986 | |
Third dose | -1.73 | 0.084 | -0.97 | 0.333 | -1.7 | 0.089 | -0.83 | 0.404 | -0.07 | 0.94 | -0.2 | 0.841 | -1.08 | 0.28 | -0.06 | 0.955 |
Model | Unstandardized coefficients | Standardized coefficients | |||
---|---|---|---|---|---|
B | Std. error | Beta | t | Sig. | |
aP ≤ 0.05. BMI: body mass index; DM: diabetes mellitus; GV: glycemic variability; HbA1c: glycated hemoglobin; TAR: time above range; TBR: time below range; TIR: time in range. | |||||
TIR 1 week difference | |||||
Age | 0 | 0.16 | -0.01 | -0.03 | 0.975 |
DM duration | -0.03 | 0.23 | -0.02 | -0.11 | 0.914 |
HbA1c before vaccine | -0.56 | 0.77 | -0.11 | -0.73 | 0.469 |
BMI before vaccine | -0.06 | 0.24 | -0.04 | -0.25 | 0.805 |
Gender | 1.2 | 4.04 | 0.05 | 0.3 | 0.768 |
Vaccine dose | -3 | 1.92 | -0.25 | -1.56 | 0.126 |
Vaccine type | 2.37 | 2.91 | 0.13 | 0.82 | 0.419 |
TIR 2 weeks difference | |||||
Age | -0.03 | 0.13 | -0.04 | -0.25 | 0.801 |
DM duration | -0.19 | 0.19 | -0.17 | -1 | 0.322 |
HbA1c before vaccine | 1.43 | 0.63 | 0.33 | 2.27 | 0.029a |
BMI before vaccine | 0.12 | 0.2 | 0.09 | 0.59 | 0.561 |
Gender | 4.2 | 3.3 | 0.21 | 1.27 | 0.21 |
Vaccine dose | 0.16 | 1.57 | 0.02 | 0.1 | 0.92 |
Vaccine type | 0.07 | 2.37 | 0 | 0.03 | 0.977 |
TAR 1 week difference | |||||
Age | -0.12 | 0.16 | -0.13 | -0.74 | 0.461 |
DM duration | 0.1 | 0.24 | 0.07 | 0.4 | 0.688 |
HbA1c before vaccine | -0.09 | 0.79 | -0.02 | -0.11 | 0.909 |
BMI before vaccine | 0.01 | 0.25 | 0.01 | 0.04 | 0.965 |
Gender | 0.48 | 4.14 | 0.02 | 0.12 | 0.908 |
Vaccine dose | 1.88 | 1.97 | 0.15 | 0.95 | 0.347 |
TAR 2 weeks difference | |||||
Age | -0.09 | 0.13 | -0.1 | -0.65 | 0.522 |
DM duration | 0.27 | 0.2 | 0.21 | 1.34 | 0.186 |
HbA1c before vaccine | -1.92 | 0.66 | -0.4 | -2.93 | 0.005a |
BMI before vaccine | -0.16 | 0.21 | -0.11 | -0.78 | 0.439 |
Gender | -6.39 | 3.44 | -0.3 | -1.86 | 0.07 |
Vaccine dose | -0.74 | 1.64 | -0.07 | -0.45 | 0.654 |
Vaccine type | 0.69 | 2.47 | 0.04 | 0.28 | 0.782 |
TBR 1 week difference | |||||
Age | -0.12 | 0.16 | -0.13 | -0.74 | 0.461 |
DM duration | 0.1 | 0.24 | 0.07 | 0.4 | 0.688 |
HbA1c before vaccine | -0.09 | 0.79 | -0.02 | -0.11 | 0.909 |
BMI before vaccine | 0.01 | 0.25 | 0.01 | 0.04 | 0.965 |
Gender | 0.48 | 4.14 | 0.02 | 0.12 | 0.908 |
Vaccine dose | 1.88 | 1.97 | 0.15 | 0.95 | 0.347 |
Vaccine type | -3.16 | 2.98 | -0.17 | -1.06 | 0.295 |
TBR 2 weeks difference | |||||
Age | 0.17 | 0.09 | 0.3 | 1.81 | 0.077 |
DM duration | -0.08 | 0.14 | -0.11 | -0.62 | 0.542 |
HbA1c before vaccine | 0.55 | 0.45 | 0.18 | 1.23 | 0.227 |
BMI before vaccine | -0.09 | 0.14 | -0.1 | -0.64 | 0.527 |
Gender | 1.82 | 2.36 | 0.13 | 0.77 | 0.445 |
Vaccine dose | -0.23 | 1.12 | -0.03 | -0.2 | 0.839 |
Vaccine type | -0.83 | 1.7 | -0.08 | -0.49 | 0.625 |
GV 1 week difference | |||||
Age | -0.12 | 0.11 | -0.17 | -1.02 | 0.313 |
DM duration | -0.01 | 0.17 | -0.01 | -0.03 | 0.975 |
HbA1c before vaccine | -0.54 | 0.56 | -0.15 | -0.97 | 0.337 |
BMI before vaccine | -0.11 | 0.17 | -0.1 | -0.62 | 0.538 |
Gender | -2.33 | 2.92 | -0.14 | -0.8 | 0.43 |
Vaccine dose | -1.01 | 1.39 | -0.11 | -0.73 | 0.472 |
Vaccine type | 1.77 | 2.1 | 0.13 | 0.84 | 0.405 |
GV 2 weeks difference | |||||
Age | 0 | 0.09 | 0 | -0.03 | 0.979 |
DM duration | -0.08 | 0.13 | -0.11 | -0.64 | 0.525 |
HbA1c before vaccine | 0.66 | 0.43 | 0.23 | 1.55 | 0.128 |
BMI before vaccine | -0.06 | 0.13 | -0.07 | -0.43 | 0.668 |
Gender | 2.58 | 2.23 | 0.2 | 1.16 | 0.254 |
Vaccine dose | 0.08 | 1.06 | 0.01 | 0.08 | 0.94 |
Vaccine type | 0.82 | 1.61 | 0.08 | 0.51 | 0.614 |