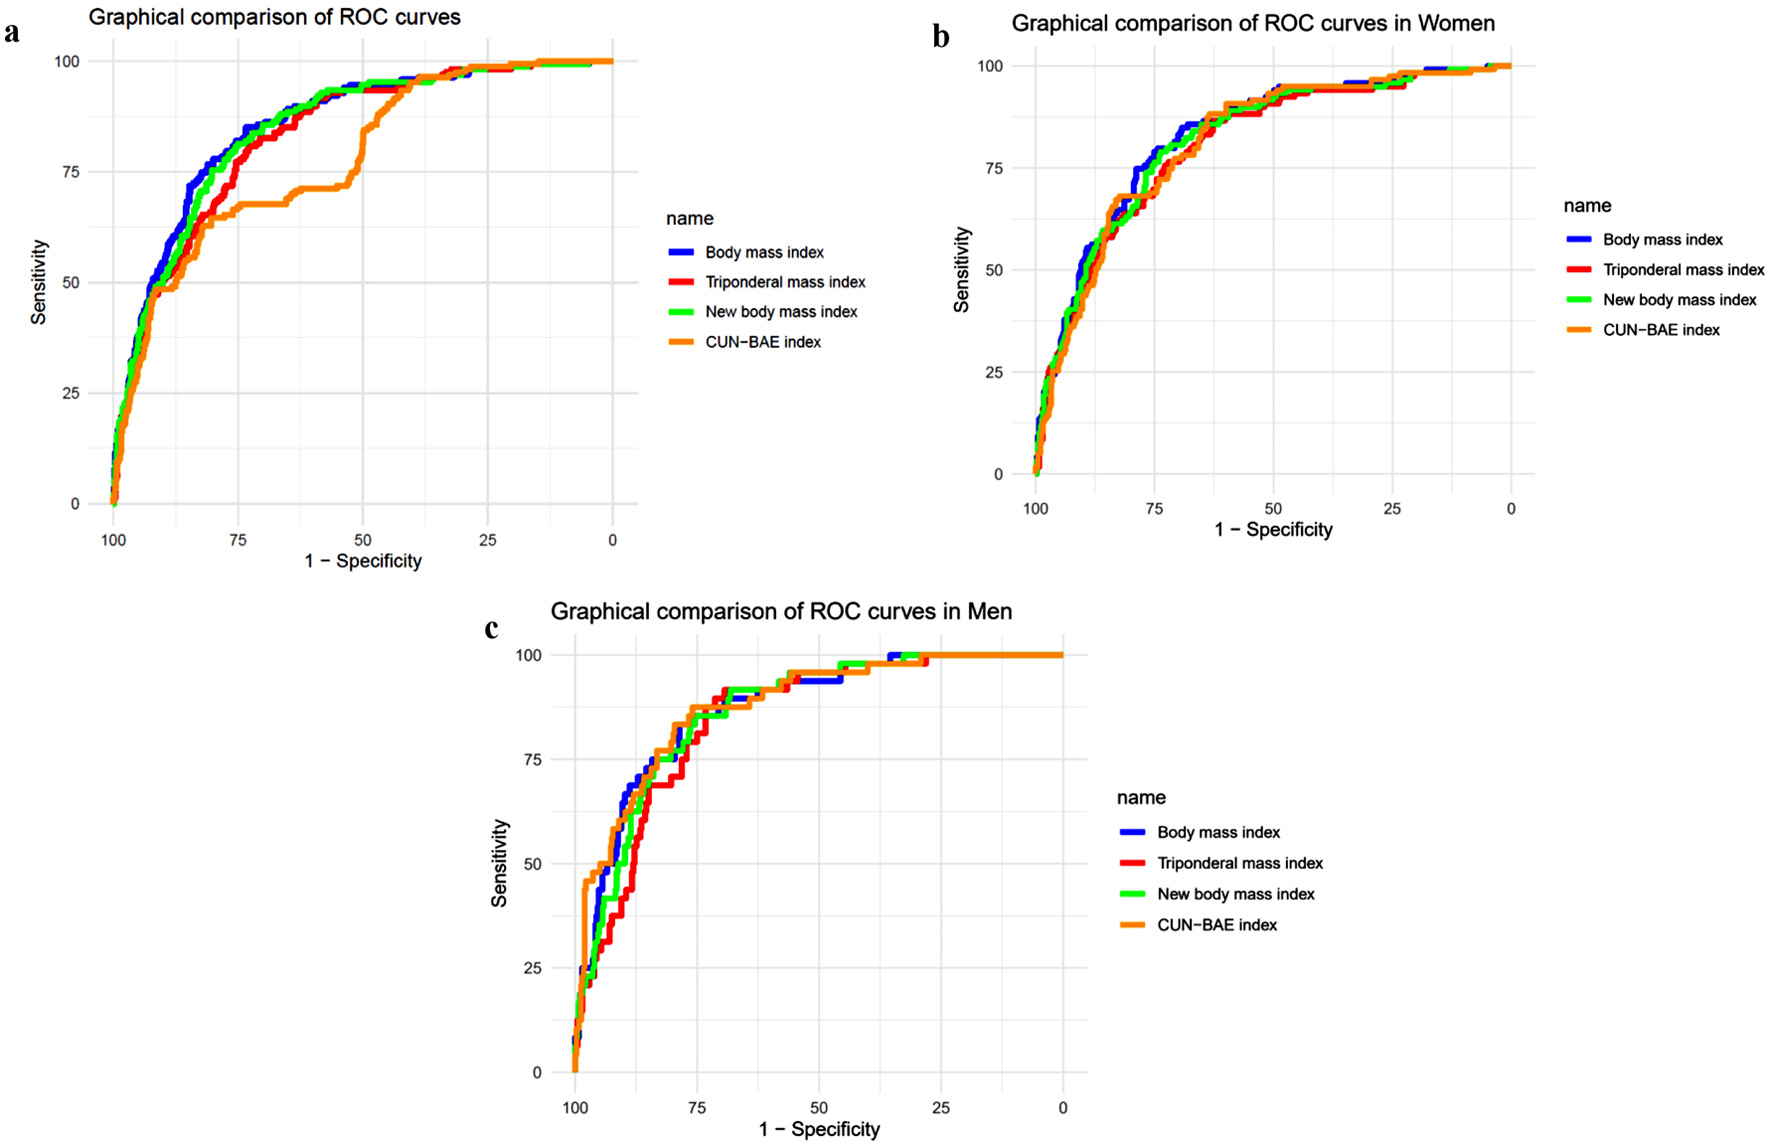
Figure 1. ROC curves graph. (a) General. (b) In women. (c) In men. ROC: receiver operating characteristic; CUN-BAE index: the University of Navarra Clinic-Body Fat Estimator index.
| Journal of Endocrinology and Metabolism, ISSN 1923-2861 print, 1923-287X online, Open Access |
| Article copyright, the authors; Journal compilation copyright, J Endocrinol Metab and Elmer Press Inc |
| Journal website https://www.jofem.org |
Original Article
Volume 14, Number 3, June 2024, pages 149-157
Diagnostic Performance of Anthropometric Weight and Height Markers Associated With Insulin Resistance Diagnosis
Figure
Tables
| Characteristic | N = 976 |
|---|---|
| Data were expressed as n (%) or mean (standard deviation (SD)). CUN-BAE index: the University of Navarra Clinic-Body Fat Estimator index. | |
| Sex | |
| Female | 516 (52.87%) |
| Male | 460 (47.13%) |
| Age | |
| 29 to 44 years | 427 (43.75%) |
| 45 to 59 years | 404 (41.39%) |
| 60 years to more | 145 (14.86%) |
| Group | |
| Migrant | 586 (60.04%) |
| Rural | 191 (19.57%) |
| Urban | 199 (20.39%) |
| Physical activity | |
| High | 431 (44.52%) |
| Low | 253 (26.14%) |
| Moderate | 284 (29.34%) |
| Alcohol volume | |
| High | 87 (8.91%) |
| Low | 889 (91.09%) |
| Current smoker | |
| No | 866 (88.73%) |
| Yes | 110 (11.27%) |
| Insulin resistance | |
| No | 809 (82.89%) |
| Yes | 167 (17.11%) |
| Body mass index | 26.5 (4.6) |
| Triponderal mass index | 17.3 (3.2) |
| New body mass index | 27.8 (5.0) |
| CUN-BAE index | 26 (7) |
| Characteristic | Insulin resistance | P valuea | |
|---|---|---|---|
| No (n = 811) | Yes (n = 167) | ||
| Data were expressed as n (%) or mean (standard deviation (SD)). aPearson’s Chi-squared test; Welch two sample t-test. bP < 0.05. CUN-BAE index: the University of Navarra Clinic-Body Fat Estimator index. | |||
| Sex | < 0.001b | ||
| Female | 397 (76.94%) | 119 (23.06%) | |
| Male | 412 (89.57%) | 48 (10.43%) | |
| Age | 0.018b | ||
| 29 to 44 years | 357 (83.61%) | 70 (16.39%) | |
| 45 to 59 years | 322 (79.70%) | 82 (20.30%) | |
| 60 years to more | 130 (89.66%) | 15 (10.34%) | |
| Group | < 0.001b | ||
| Migrant | 482 (82.25%) | 104 (17.75%) | |
| Rural | 187 (97.91%) | 4 (2.09%) | |
| Urban | 140 (70.35%) | 59 (29.65%) | |
| Physical activity | < 0.001b | ||
| High | 382 (88.63%) | 49 (11.37%) | |
| Low | 198 (78.26%) | 55 (21.74%) | |
| Moderate | 222 (78.17%) | 62 (21.83%) | |
| Alcohol volume | 0.041b | ||
| High | 79 (90.80%) | 8 (9.20%) | |
| Low | 730. (82.11%) | 159 (17.89%) | |
| Current smoker | 0.161 | ||
| No | 723 (83.49%) | 143 (16.51%) | |
| Yes | 86 (78.18%) | 24 (21.82%) | |
| Body mass index | 25.5 (3.8) | 31.6 (4.9) | < 0.001b |
| Triponderal mass index | 16.6 (2.7) | 20.6 (3.5) | < 0.001b |
| New body mass index | 26.7 (4.1) | 33.1 (5.3) | < 0.001b |
| CUN-BAE index | 24 (7) | 31 (6) | < 0.001b |
| Characteristic | Univariable | Multivariable | ||||
|---|---|---|---|---|---|---|
| aOR | 95% CI | P value | aORa | 95% CI | P value | |
| aAdjusted for: sex, age, group, current smoking status, alcohol consumption, and physical activity. bP < 0.05. aOR: adjusted odds ratio; CI: confidence interval; BMI: body mass index; TPI: triponderal index; BMI: body mass index; NBMI: new BMI; CUN-BAE index: the University of Navarra Clinic-Body Fat Estimator index. | ||||||
| Body mass index | ||||||
| Tertile 1 | Reference | Reference | ||||
| Tertile 2 | 3.87 | 1.75 - 9.81 | 0.002b | 2.74 | 1.21 - 7.04 | 0.022b |
| Tertile 3 | 31 | 15.3 - 74.4 | < 0.001b | 18.2 | 8.73 - 44.6 | < 0.001b |
| Triponderal mass index | ||||||
| Tertile 1 | Reference | Reference | ||||
| Tertile 2 | 4.08 | 1.94 - 9.67 | < 0.001b | 3.24 | 1.51 - 7.79 | 0.004b |
| Tertile 3 | 25.2 | 12.8 - 57.0 | < 0.001b | 17.2 | 8.34 - 40.6 | < 0.001b |
| New body mass index | ||||||
| Tertile 1 | Reference | Reference | ||||
| Tertile 2 | 3.38 | 1.57 - 8.09 | 0.003b | 2.56 | 1.17 - 6.21 | 0.025b |
| Tertile 3 | 26.7 | 13.6 - 60.4 | < 0.001b | 16.5 | 8.12 - 38.3 | < 0.001b |
| CUN-BAE index | ||||||
| Tertile 1 | Reference | Reference | ||||
| Tertile 2 | 6.54 | 3.20 - 15.2 | < 0.001b | 12.9 | 6.01 - 31.0 | < 0.001b |
| Tertile 3 | 142 | 46.0 - 510 | < 0.001b | 20.8 | 10.6 - 47.1 | < 0.001b |
| Cutoffs | AUC | Se (%) | Sp (%) | PPV (%) | NPV (%) | LR+ | LR- | |
|---|---|---|---|---|---|---|---|---|
| Se: sensibility; Sp: specificity; PPV: positive predictive value; NPV: negative predictive value; LR+: likelihood ratio positive; LR-: likelihood ratio negative; CUN-BAE index: the University of Navarra Clinic-Body Fat Estimator index; AUC: area under the curve. | ||||||||
| General | ||||||||
| Body mass index | 27.44 | 0.854 (0.824, 0.884) | 85.03 (78.70, 90.07) | 73.42 (70.23, 76.44) | 39.78 (36.07, 51,34) | 95.96 (93.92, 96,54) | 3.20 (2.81, 3.65) | 0.20 (0.14, 0.29) |
| Triponderal mass index | 17.78 | 0.832 (0.801, 0.864) | 80.84 (74.04, 86.50) | 72.81 (69.60, 75.84) | 38.03 (34.41, 48.25) | 94.85 (92.57, 95.57) | 2.97 (2.60, 3.40) | 0.26 (0.19, 0.36) |
| New body mass index | 28.97 | 0.847 (0.816, 0.877) | 81.44 (74.70, 87.02) | 75.03 (71.89, 77.97) | 40.24 (36.44, 50.72) | 95.14 (92.95, 95.84) | 3.26 (2.84, 3.75) | 0.24 (0.18, 0.34) |
| CUN-BAE index | 31.75 | 0.778 (0.740, 0.816) | 64.67 (56.91, 71.89) | 80.34 (77.44, 83.03) | 40.45 (36.32, 48.70) | 91.68 (88.83, 92.95) | 3.29 (2.75, 3.93) | 0.44 (0.36, 0.54) |
| Women | ||||||||
| Body mass index | 27.65 | 0.829 (0.788, 0.870) | 84.87 (77.15, 90.78) | 69.27 (64.47, 73.77) | 45.29 (39.99, 59.23) | 93.86 (90.19, 95.01) | 2.76 (2.33, 3.26) | 0.21 (0.14, 0.33) |
| Triponderal mass index | 18.04 | 0.806 (0.762, 0.850) | 86.55 (79.90, 92.11) | 62.47 (57.50, 67.24) | 40.87 (35.98, 55.64) | 93.94 (90.10, 95.03) | 2.31 (1.99, 2.66) | 0.22 (0.14, 0.34) |
| New body mass index | 30.03 | 0.819 (0.777, 0.861) | 78.99 (70.57, 85.91) | 73.80 (69.18, 78.06) | 47.47 (41.87, 59.46) | 92.14 (88.20, 93.67) | 3.02 (2.50, 3.64) | 0.28 (0.20, 0.40) |
| CUN-BAE index | 31.98 | 0.813 (0.771, 0.855) | 88.24 (81.05, 93.41) | 63.48 (58.53, 68.22) | 42.00 (37.03, 57.80) | 94.74 (91.12, 95.69) | 2.42 (2.09, 2.79) | 0.19 (0.11, 0.30) |
| Men | ||||||||
| Body mass index | 27.44 | 0.872 (0.824, 0.920) | 83.33 (69.78, 92.52) | 78.64 (74.36, 82.50) | 31.25 (26.37, 52.93) | 97.59 (94.92, 98.11) | 3.90 (3.12, 4.88) | 0.21 (0.11, 0.40) |
| Triponderal mass index | 16.44 | 0.849 (0.801, 0.897) | 91.67 (80.02, 97.68) | 69.42 (64.72, 73.83) | 25.88 (22.01, 57.24) | 98.62 (96.30, 98.89) | 3.00 (2.53, 3.55) | 0.12 (0.05, 0.31) |
| New body mass index | 27.76 | 0.864 (0.818, 0.911) | 85.42 (72.24, 93.93) | 75.49 (71.04, 79.56) | 28.87 (24.43, 51.75) | 97.80 (95.18, 98.25) | 3.48 (2.84, 4.28) | 0.19 (0.10, 0.38) |
| CUN-BAE index | 20.12 | 0.878 (0.829, 0.927) | 87.50 (74.75, 95.27) | 75.97 (71.55, 80.02) | 29.79 (25.23, 54.98) | 98.12 (95.66, 98.51) | 3.64 (2.97, 4.46) | 0.16 (0.08, 0.35) |