Figures
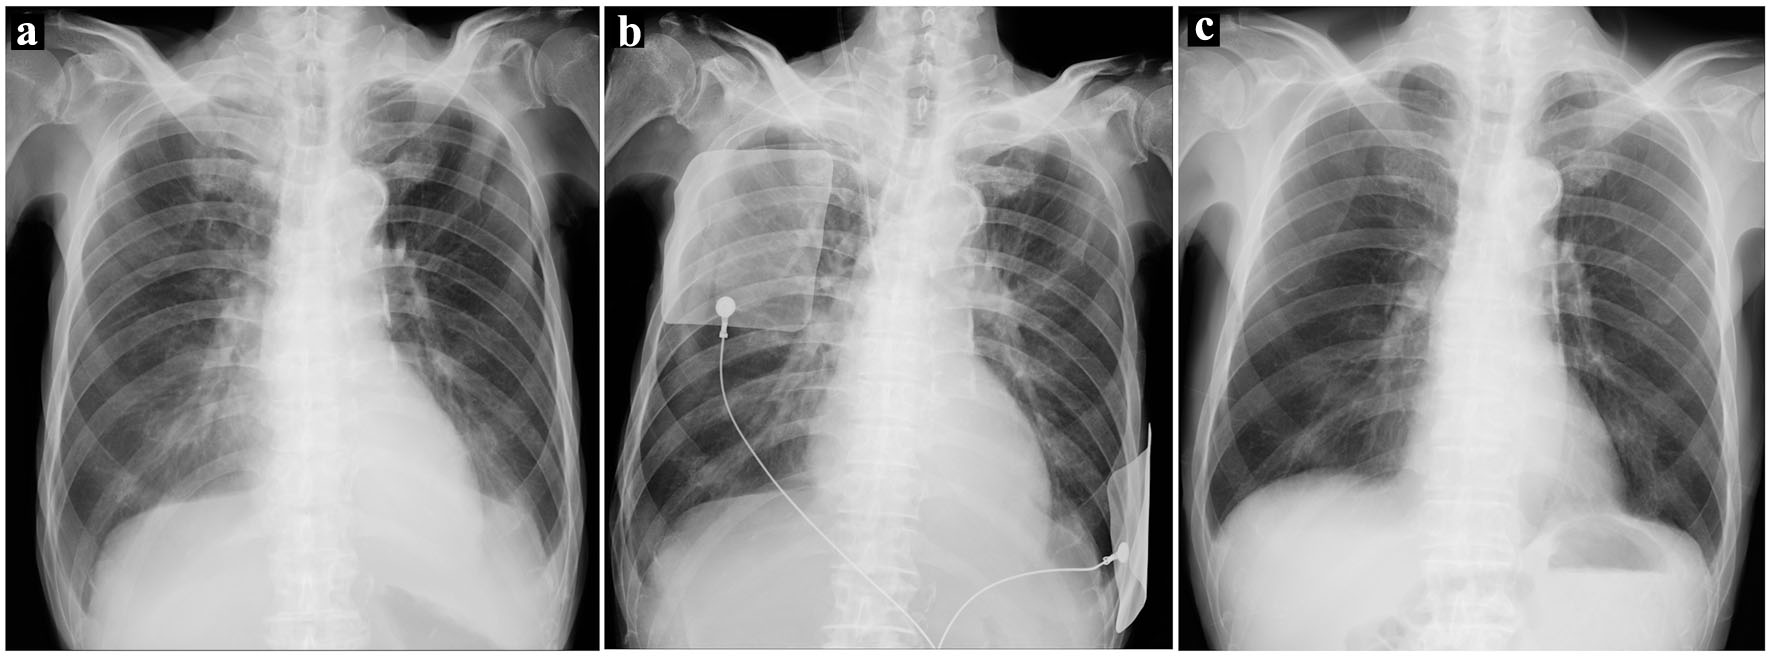
Figure 1. (a) Chest radiography on admission showing pulmonary congestion and bilateral pleural effusion. (b) Chest radiography when the patient developed atrial fibrillation. Pulmonary congestion was more prominent than on admission. (c) Chest radiography before discharge. Pulmonary congestion was resolved, and pleural effusion was absent.
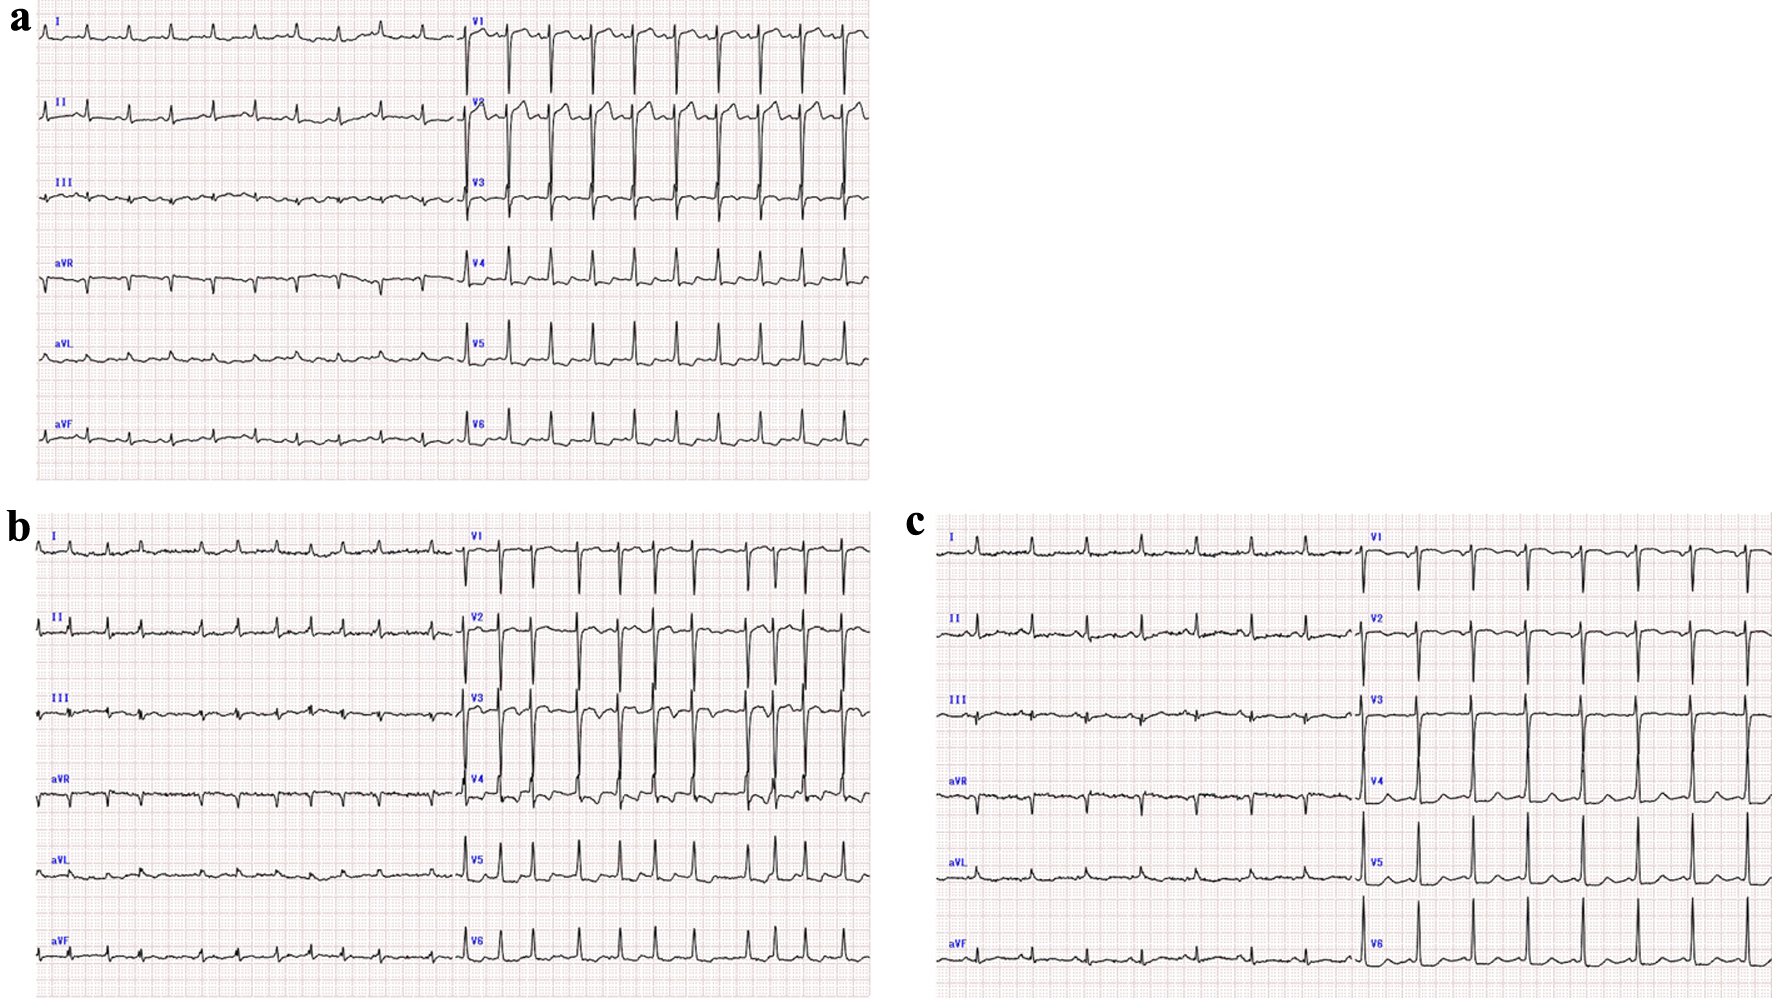
Figure 2. (a) Electrocardiogram on admission (heart rate 119 beats per minute, sinus rhythm). (b) Electrocardiogram when the patient developed atrial fibrillation (heart rate 130 beats per minute). (c) Electrocardiogram after conversion to sinus rhythm (heart rate 91 beats per minute).
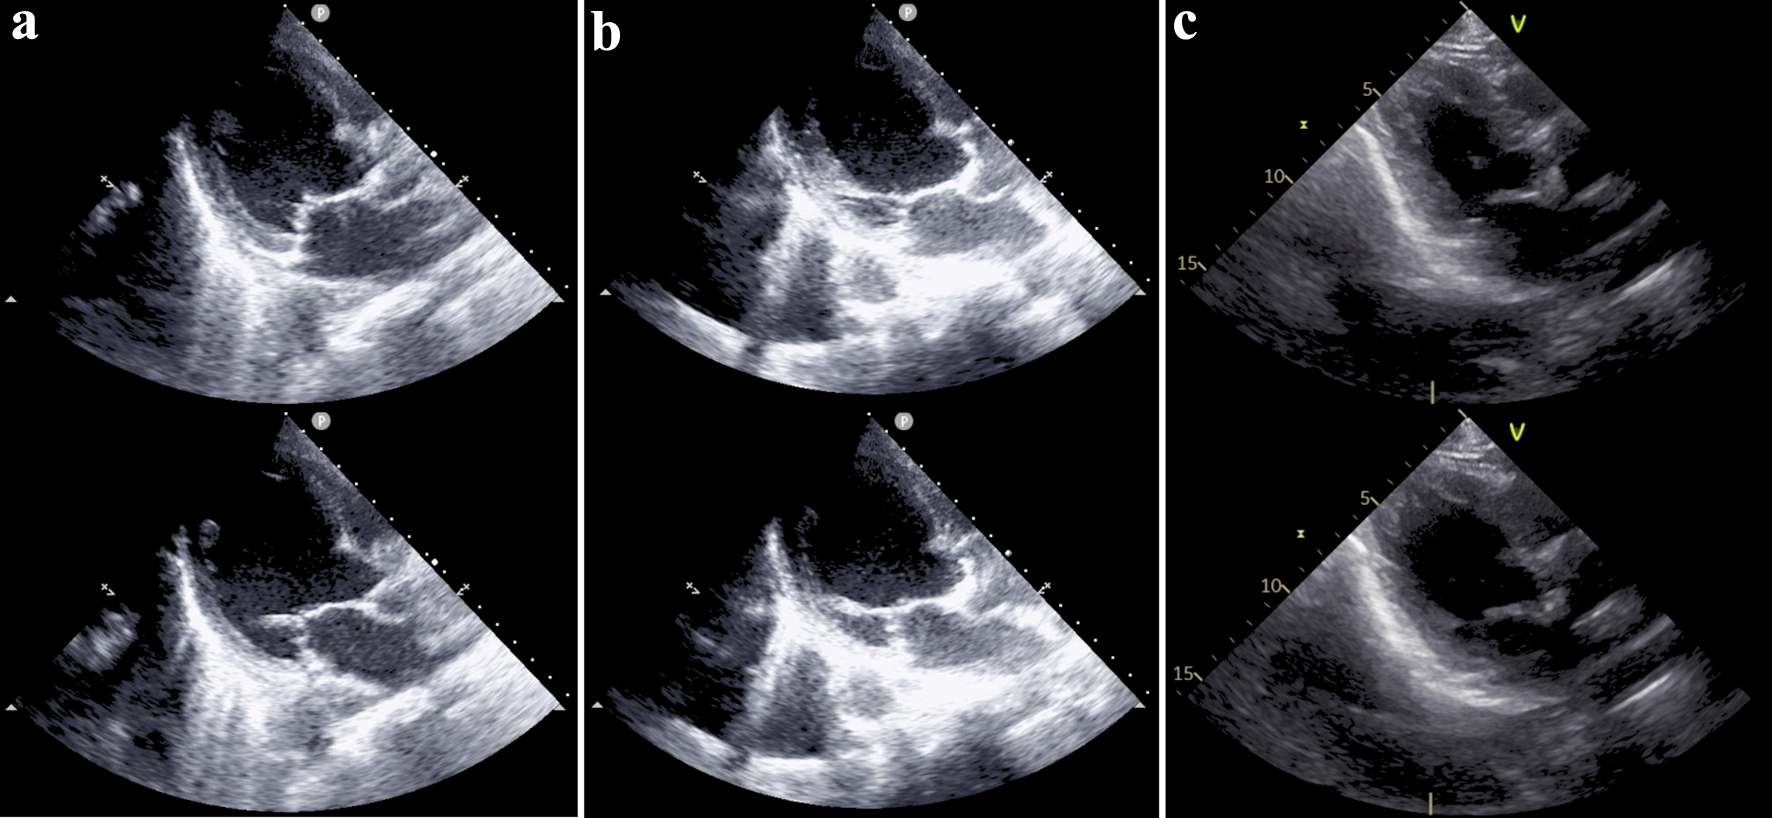
Figure 3. (a) Bedside echocardiogram performed on admission showing a dilated left ventricle and reduced left ventricular systolic function. Ejection fraction was visually estimated to be 20%. (b) Bedside echocardiogram performed when the patient developed atrial fibrillation. The reduced left ventricular systolic function remained unchanged. (c) Echocardiogram performed after recovery from the acute phase. Dilation and systolic function of the left ventricle were improved, and the ejection fraction calculated by Simpson method was 43%. In each column, the upper image represents the end-systolic phase, and the lower image represents the end-diastolic phase.
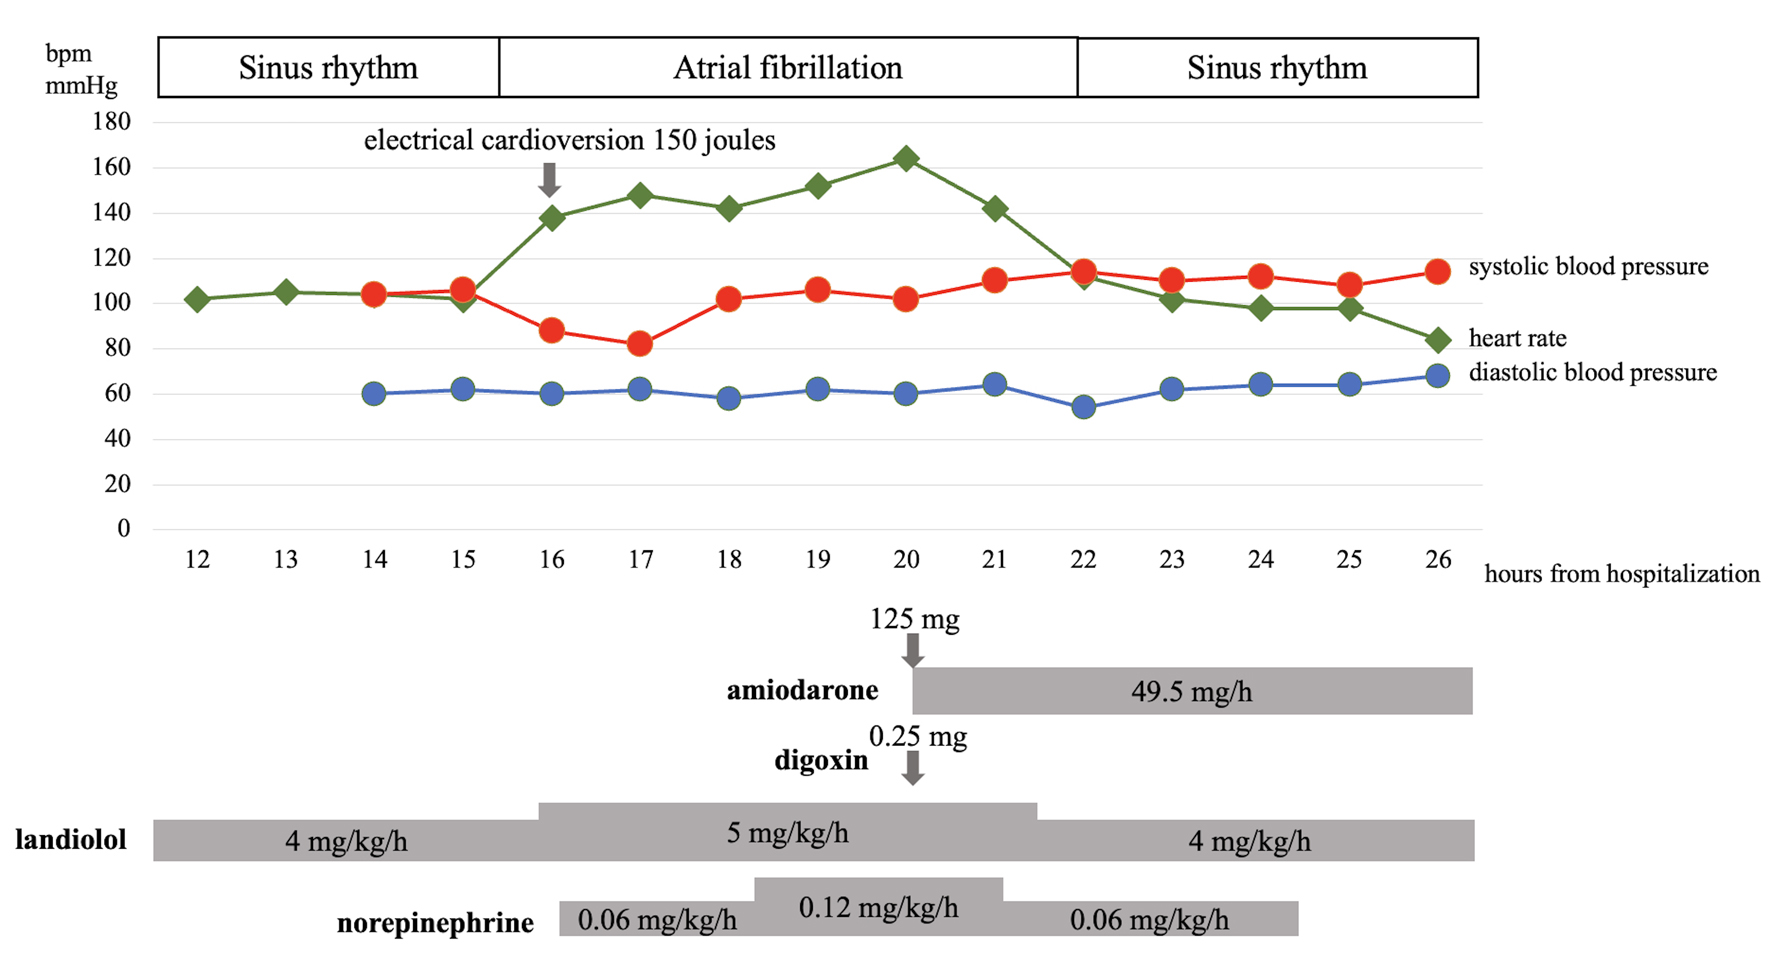
Figure 4. The patient’s heart rate, blood pressure, doses of amiodarone, digoxin, landiolol, and norepinephrine, and timing of electrical cardioversion during the first night of admission. bpm: beats per minute.
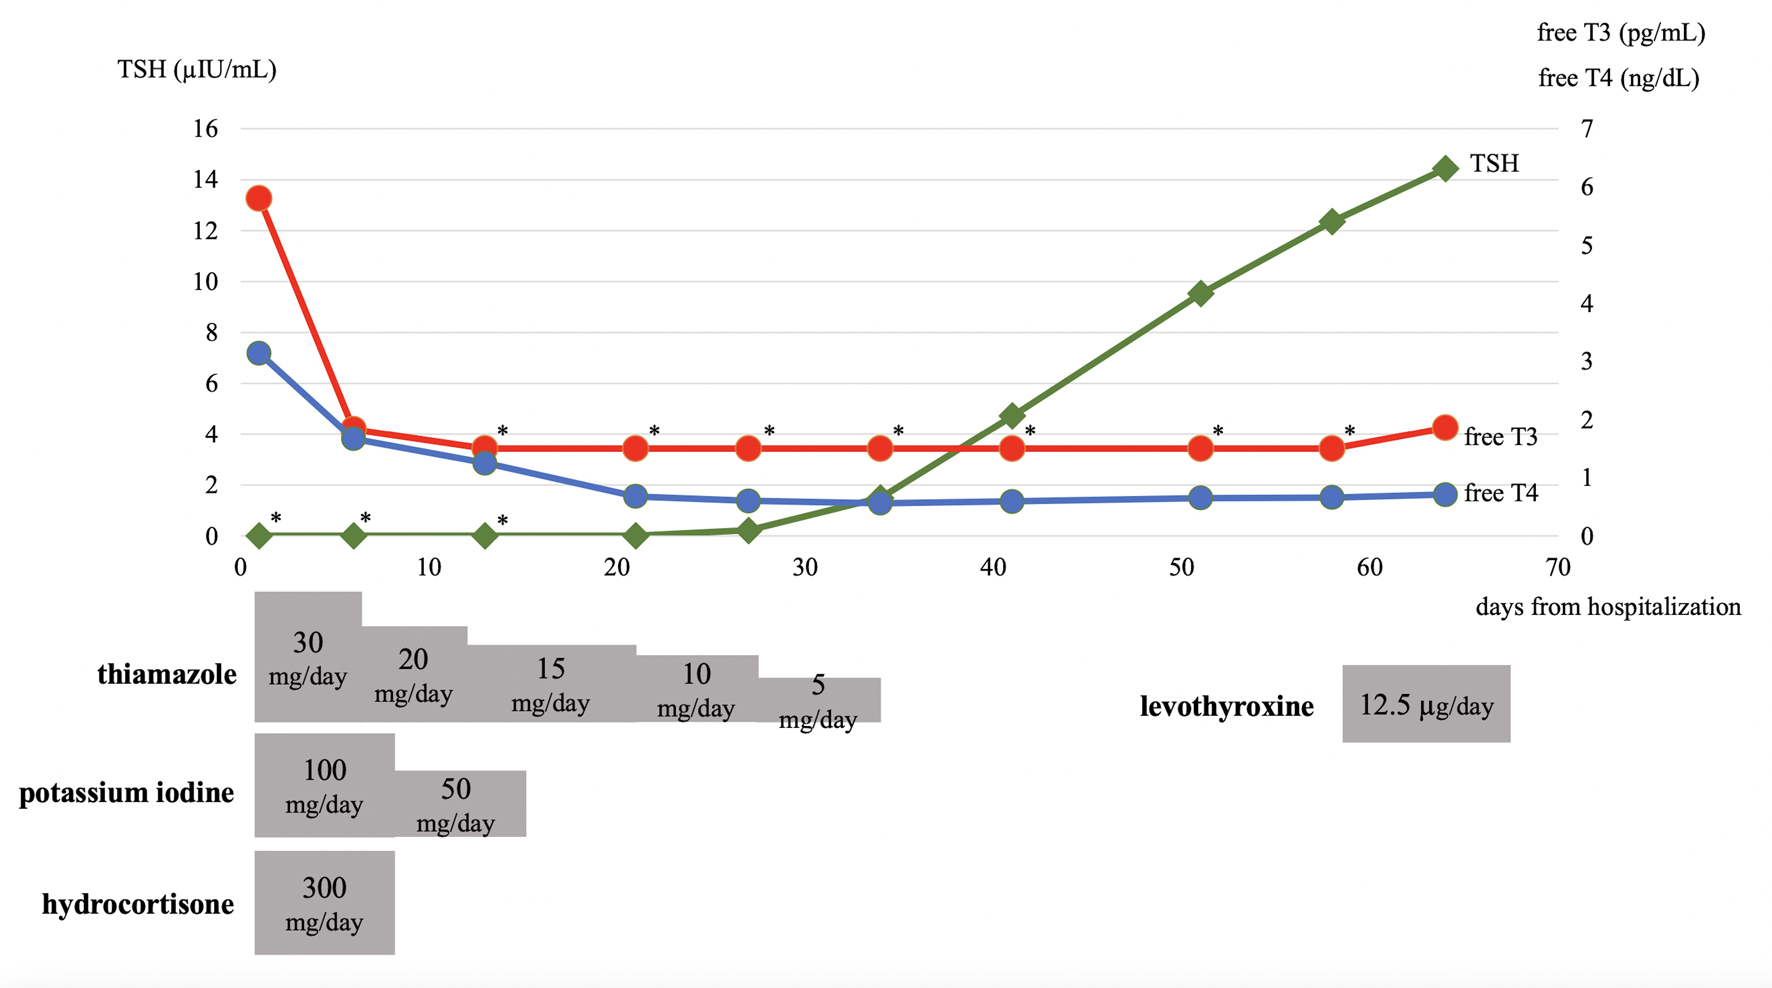
Figure 5. Trends of thyroid function tests and dosages of thiamazole, potassium iodine, hydrocortisone, and levothyroxine during hospitalization are depicted. Asterisks in the thyroid function test graph represent values below the detection limits (0.008 µIU/mL for TSH and 1.50 pg/mL for free T3). free T3: free triiodothyronine; fT4: free thyroxine; TSH: thyroid-stimulating hormone.
Table
Table 1. Laboratory Test Results on the Day of Admission
| Patient value | Normal value |
|---|
| The test results of antithyroid antibodies were revealed on the third day of admission. INR: international normalized ratio. |
| White blood cells (/µL) | 10,000 | 4,000 - 8,000 |
| Hemoglobin (g/dL) | 10.6 | 14 - 18 |
| Platelets (/µL) | 248,000 | 150,000 - 350,000 |
| Total protein (g/dL) | 6.2 | 6.7 - 8.3 |
| Albumin (g/dL) | 3.2 | 3.1 - 5.1 |
| Aspartate aminotransferase (IU/L) | 32 | 13 - 33 |
| Alanine aminotransferase (IU/L) | 27 | 8 - 42 |
| Lactate dehydrogenase (IU/L) | 202 | 119 - 229 |
| Alkaline phosphatase (IU/L) | 79 | 115 - 359 |
| γ-glutamyl transferase (IU/L) | 26 | 10 - 47 |
| Total bilirubin (mg/dL) | 0.74 | 0.2 - 1.2 |
| Urea nitrogen (mg/dL) | 44.0 | 8 - 22 |
| Creatinine (mg/dL) | 1.00 | 0.61 - 1.04 |
| Sodium (mEq/L) | 136 | 138 - 146 |
| Potassium (mEq/L) | 5.4 | 3.6 - 4.9 |
| Chloride (mEq/L) | 100 | 99 - 109 |
| Glucose (mg/dL) | 154 | 70 - 109 |
| C-reactive protein (mg/dL) | 1.45 | 0.0 - 0.29 |
| Thyroid stimulation hormone (µIU/mL) | < 0.008 | 0.35 - 4.94 |
| Free triiodothyronine (pg/mL) | 5.80 | 1.88 - 3.86 |
| Free thyroxine (ng/dL) | 3.14 | 0.70 - 1.72 |
| Thyroid-stimulating hormone receptor antibody (IU/L) | 1.5 | 0 - 2.0 |
| Anti-thyroid peroxidase antibody (IU/mL) | < 3.0 | 0 - 3.0 |
| Brain natriuretic peptide (pg/mL) | 1,455 | 0 - 18.3 |
| Prothrombin time (INR) | 1.00 | |
| Activated partial thromboplastin time (s) | 23.8 | 24 - 34 |