
Figure 1. Flow chart.
| Journal of Endocrinology and Metabolism, ISSN 1923-2861 print, 1923-287X online, Open Access |
| Article copyright, the authors; Journal compilation copyright, J Endocrinol Metab and Elmer Press Inc |
| Journal website https://www.jofem.org |
Original Article
Volume 13, Number 3, August 2023, pages 104-113
Prevalence of Metabolically-Obese Normal-Weight Worldwide: Systematic Review and Meta-Analysis
Figures

Tables
| ATP III | IDF | AHA/NHLBI | JIS | |
|---|---|---|---|---|
| HDL: high-density lipoprotein. | ||||
| Absolutely required | None | Increased waist circumference | None | None |
| Criterion | At least three criteria | At least two criteria in addition to waist circumference | At least three criteria | At least three criteria |
| Waist circumference | > 102 cm (men); > 89 cm (women) | ≥ 94 cm (men); ≥ 80 cm (women) | >102 cm (men); > 89 cm (women) | > 85 cm (men); > 80 cm (women) |
| Blood pressure | ≥ 130/85 mm Hg | ≥ 130/85 mm Hg | ≥ 130/85 mm Hg | ≥ 130/85 mm Hg |
| Fasting triglycerides | ≥ 150 mg/dL | ≥ 150 mg/dL | ≥ 150 mg/dL | ≥ 150 mg/dL |
| HDL cholesterol | < 40 mg/dL (men); < 50 mg/dL (women) | < 40 mg/dL (men); < 50 mg/dL (women) | < 40 mg/dL (men); < 50 mg/dL (women) | < 40 mg/dL (men); < 50 mg/dL (women) |
| Higher fasting blood sugar | ≥ 100 mg/dL | ≥ 100 mg/dL | ≥ 100 mg/dL | ≥ 100 mg/dL |
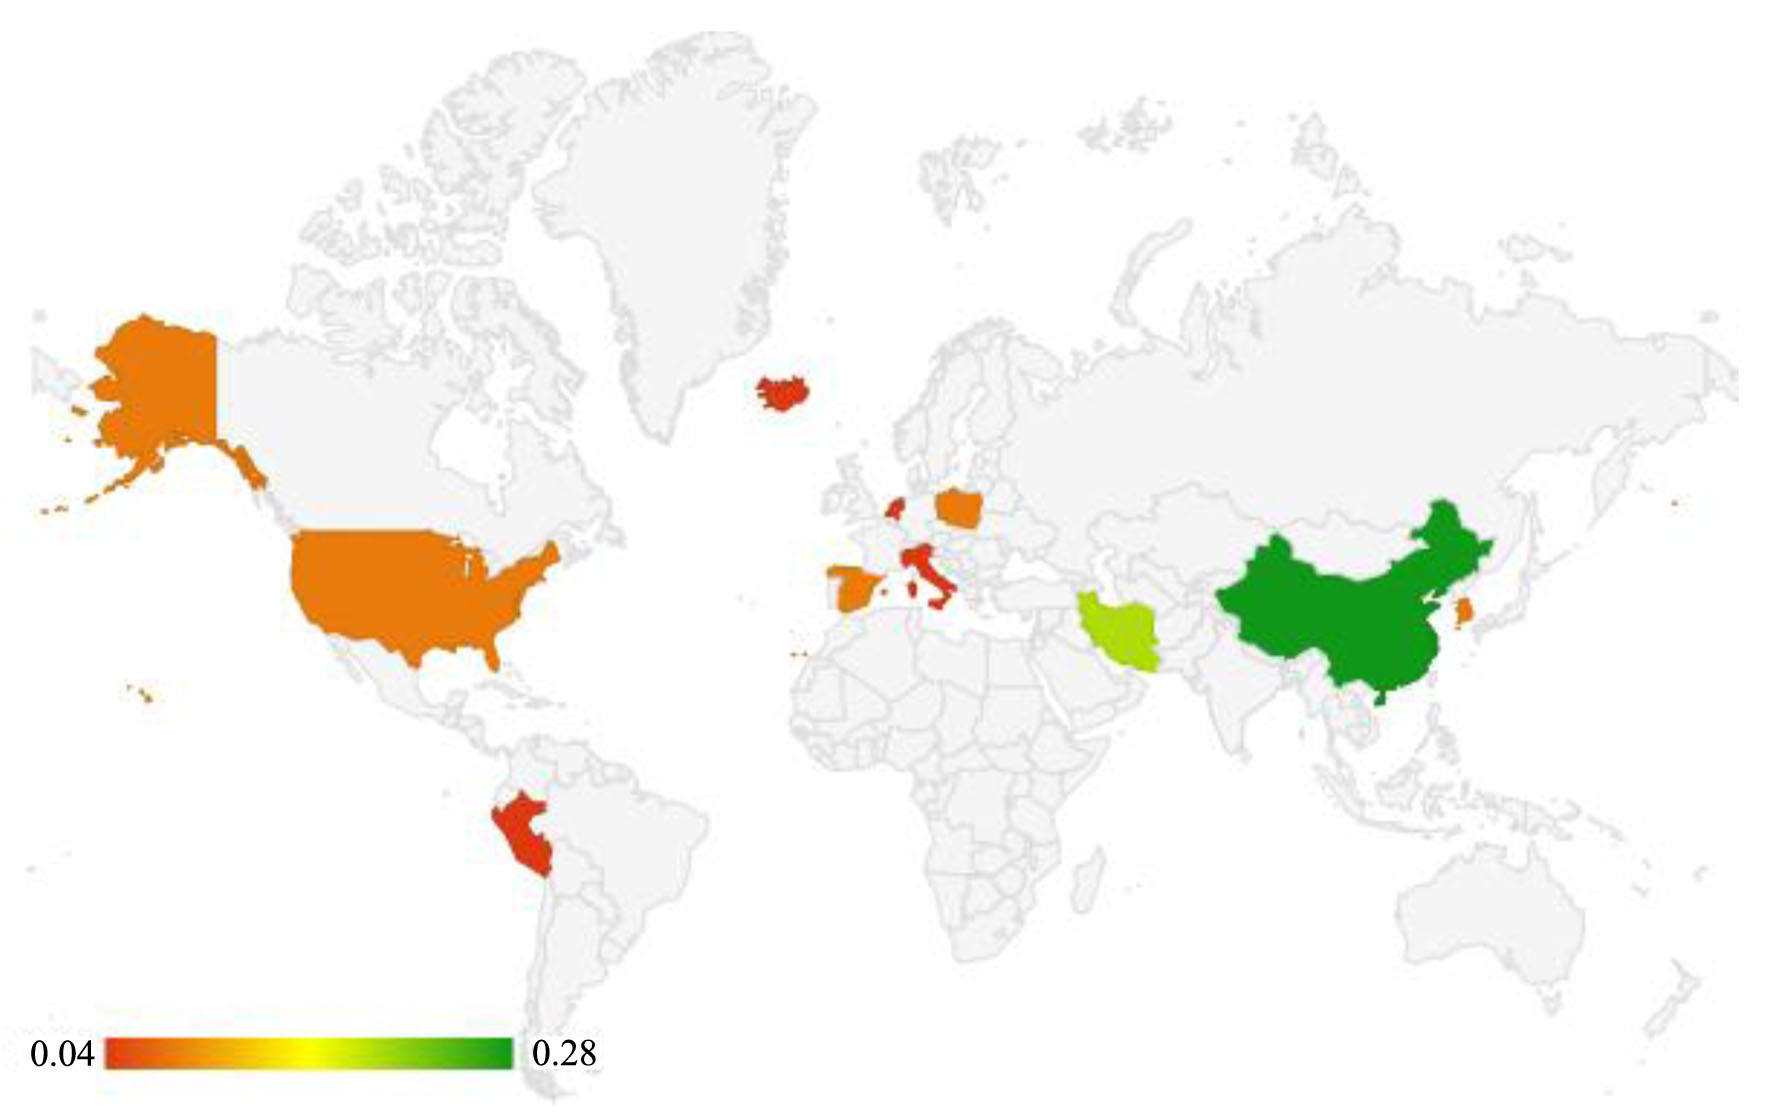
| Authors (yeara) | Country | Metabolic disorder criteria | Sample with normal BMI | MONW | MONW prevalence | Age range |
|---|---|---|---|---|---|---|
| aThe year in which the population was studied. MONW: metabolically-obese normal-weight; BMI: body mass index. | ||||||
| Bradshaw et al (1987) [12] | United States | ATP III | 4,823 | 443 | 9.18% | 45 - 64 |
| Amouzegar et al (1996) [8] | Iran | JIS | 666 | 107 | 16.06% | ≥ 20 |
| Lee et al (2003) [13] | South Korea | AHA/NHLBI | 753 | 216 | 28.68% | ≥ 40 |
| Goday et al (2004) [14] | Spain | ATP III | 202,265 | 4,419 | 2.18% | 34 - 55 |
| Hadaegh et al (2006) [15] | Iran | ATP III | 3,444 | 361 | 10.48% | ≥ 20 |
| Lee et al (2007) [16] | South Korea | Presence of diabetes mellitus, hypertension or dyslipidemia | 18,524 | 8,711 | 27.9% | 40 - 69 |
| Jia et al (2007) [17] | China | JIS | 9,988 | 2,877 | 28.80% | ≥ 20 |
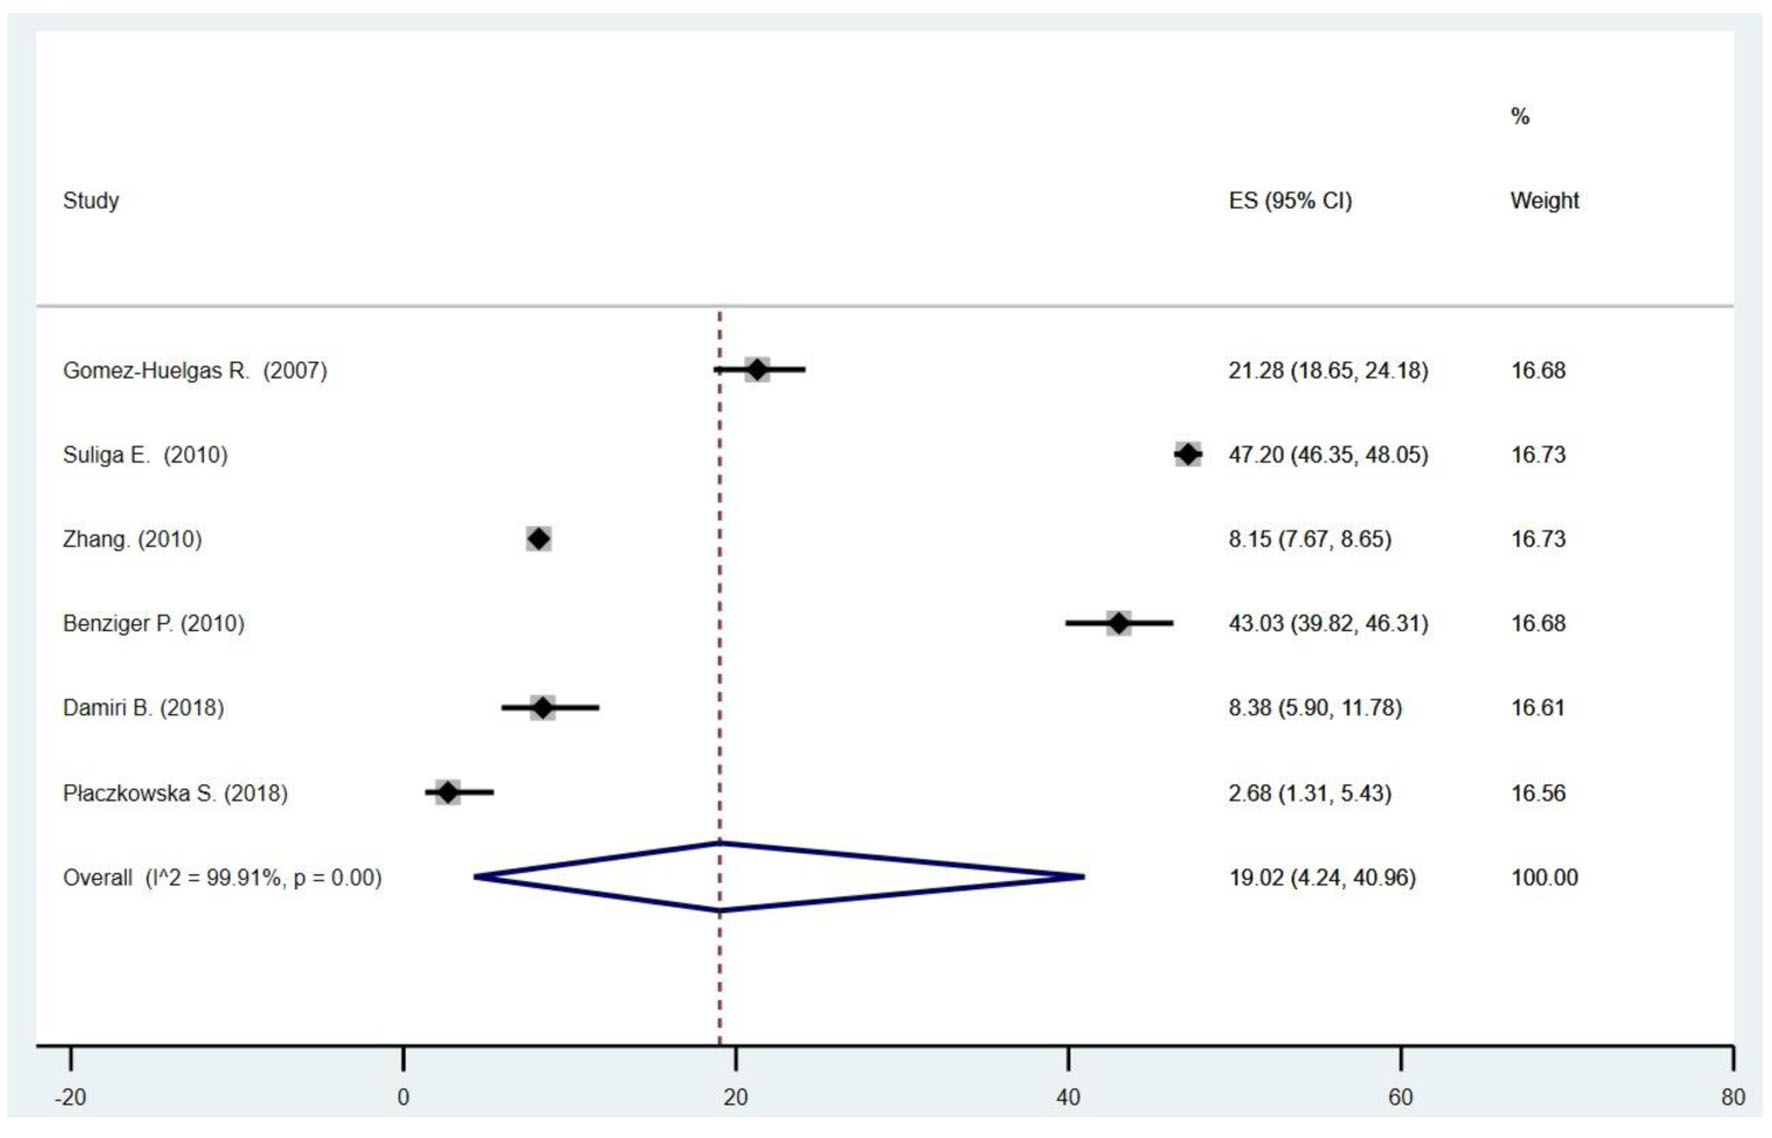
| Gomez-Huelgas et al (2007) [18] | Spain | IDF | 841 | 179 | 21.28% | 18 - 80 |
| Moazzami et al (2009) [19] | United States | AHA/NHLBI | 11,680 | 2,294 | 19.64% | ≥ 18 |
| Wang et al (2009) [9] | China | ATP III | 6,973 | 2,099 | 30.1% | ≥ 18 |
| Tian et al (2009) [20] | China | ATP III | 5,453 | 1,678 | 30.77% | 18 - 85 |
| Zheng et al (2010) [21] | China | WGOC | 17,876 | 6,097 | 34.1% | ≥ 20 |
| Suliga et al (2010) [22] | Poland | IDF | 13,172 | 6,217 | 47.2% | 37 - 66 |
| Zhang (2010) [23] | China | IDF | 11,884 | 968 | 8.14% | ≥ 39 |
| Benziger et al (2010) [24] | Peru | IDF | 890 | 383 | 43.03% | ≥ 35 |
| Kim et al (2011) [25] | South Korea | At least one of six metabolic disorders | 79,012 | 36,178 | 45.78% | ≥ 35 |
| Buscemi et al (2011) [26] | Italy | At least two of four metabolic disorders | 284 | 97 | 34.15% | 18 - 90 |
| Perini et al (2011) [27] | The Netherlands | ATP III | 6,910 | 1,060 | 15.34% | 18 - 70 |
| Li et al (2011) [28] | China | ATP III | 2,911 | 1,018 | 34.97% | ≥ 40 |
| Hajian-Tilaki, Heidari (2012) [29] | Iran | ATP III | 324 | 170 | 52.46% | 20 - 70 |
| Tabatabaei-Malazy et al (2016) [30] | Iran | ATP III | 6,082 | 2,118 | 34.82% | > 25 |
| Zoghi et al (2016) [31] | Iran | ATP III | 1,414 | 74 | 5.23% | 35 - 70 |
| Olafsdottir et al (2016) [32] | Iceland | JIS | 182 | 1 | 0.54% | 18 |
| Zhu et al (2017) [33] | China | ATP III | 1,293 | 253 | 19.56% | > 18 |
| Damiri et al (2018) [34] | Palestine | IDF | 346 | 29 | 8.38% | 18 - 65 |
| Placzkowska et al (2018) [35] | Poland | IDF | 261 | 7 | 2.68% | 18 - 31 |