Figures
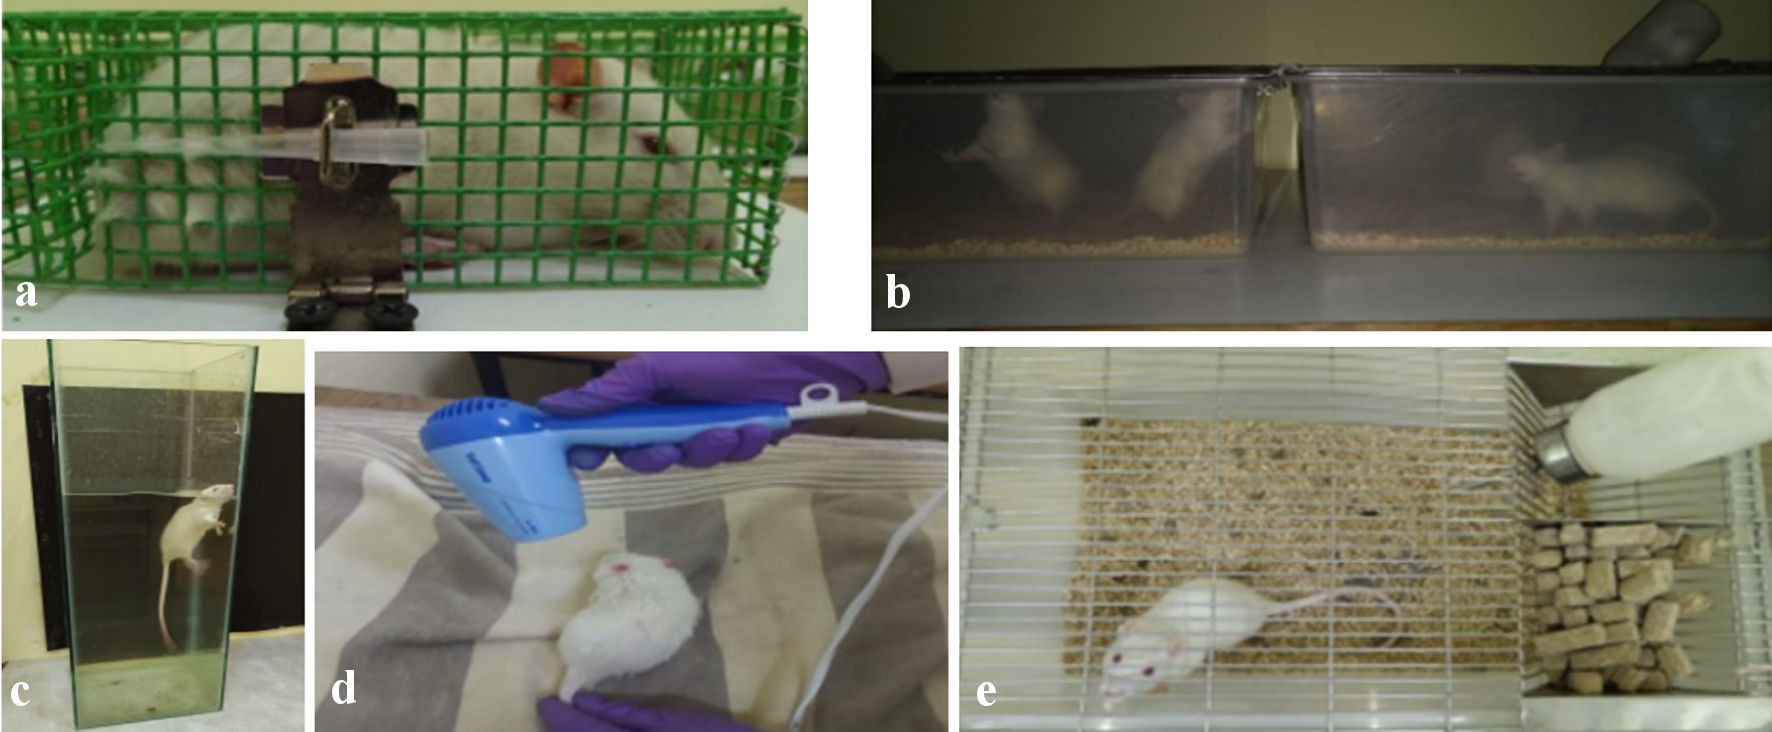
Figure 1. (a) Animal under restraining. (b) Animals under dark condition. (c) Animal under forced swimming. (d) Anima exposing to flash heat. (e) Animal under social isolation.
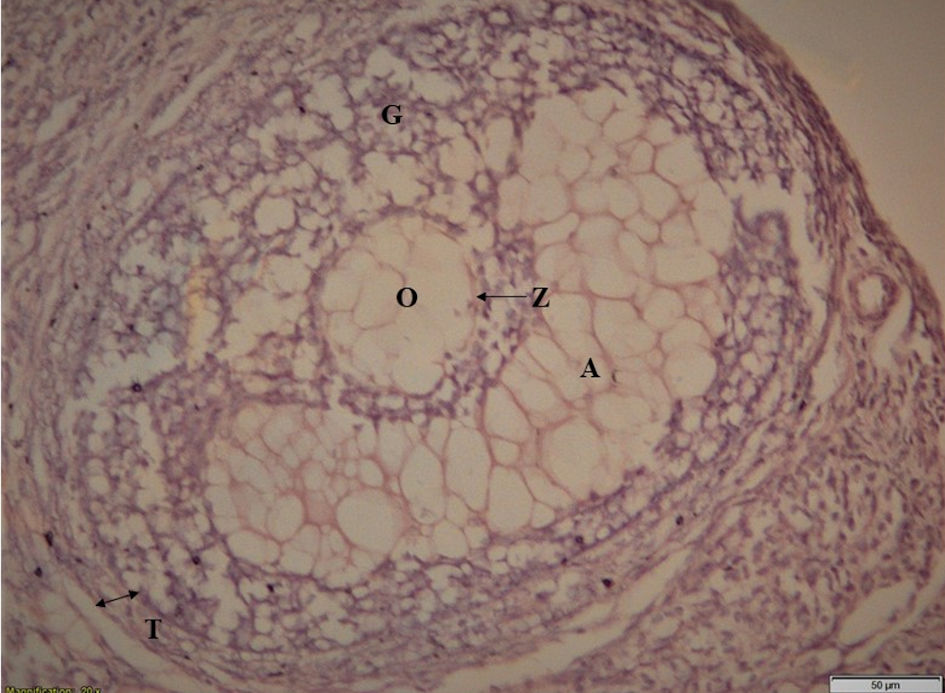
Figure 2. Matured healthy follicle. T: theca layer; G: granulosa layer; O: ovule; Z: zona pellucida; A: antrum.
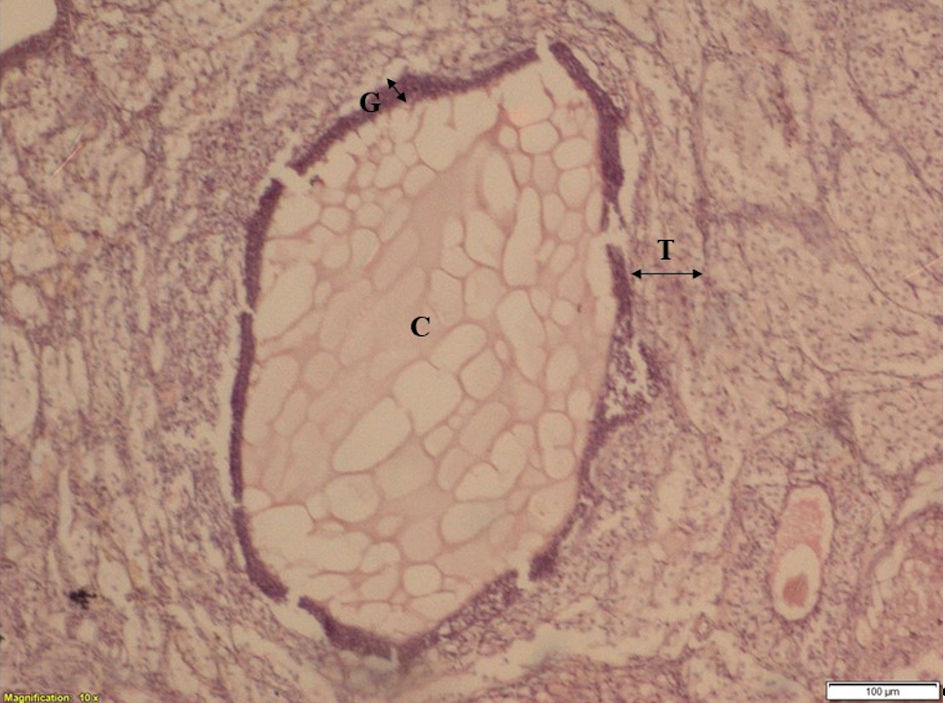
Figure 3. The ovarian section of stress group animal showing cystic follicle (after 30 days of stress exposure). C: cyst; T: theca layer; G: granulosa layer.
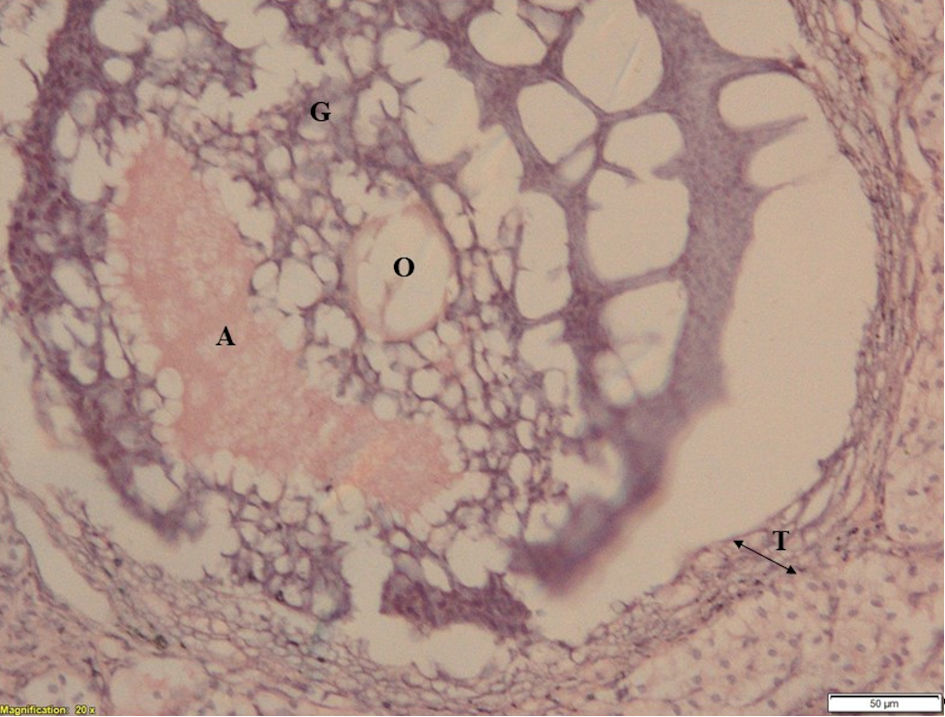
Figure 4. Ovarian section of ketoconazole-treated animal showing pseudo healthy follicle. (after 30 days of 50 mg/kg body weight ketoconazole with stress exposure). T: theca layer; G: granulosa layer; O: ovule; A: antrum.
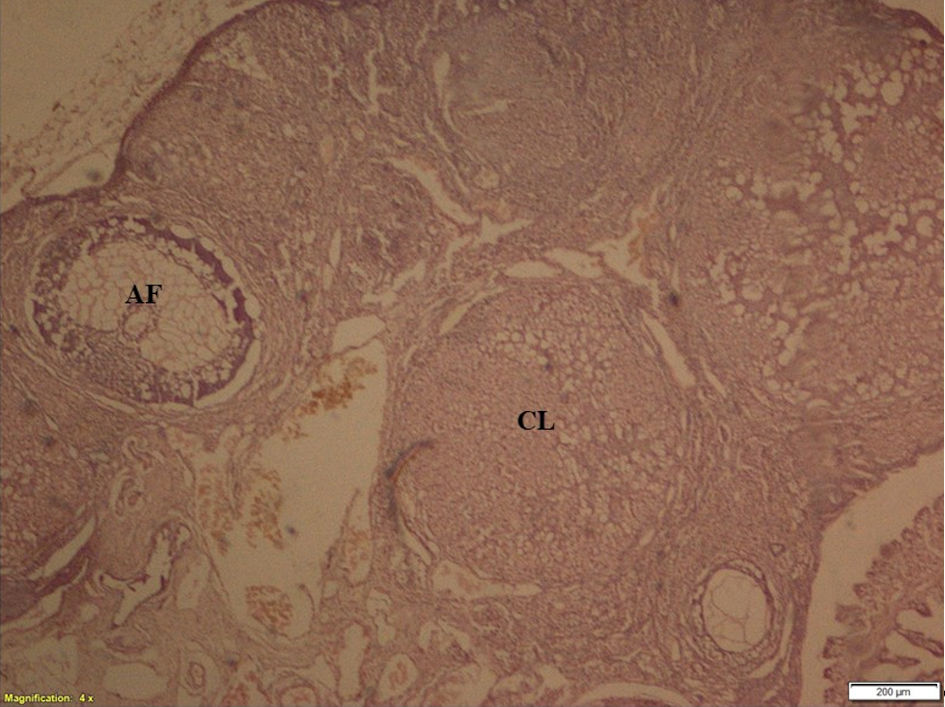
Figure 5. Ovarian section showing corpus luteum and antral follicle. CL: corpus luteum; AF: antral follicle.
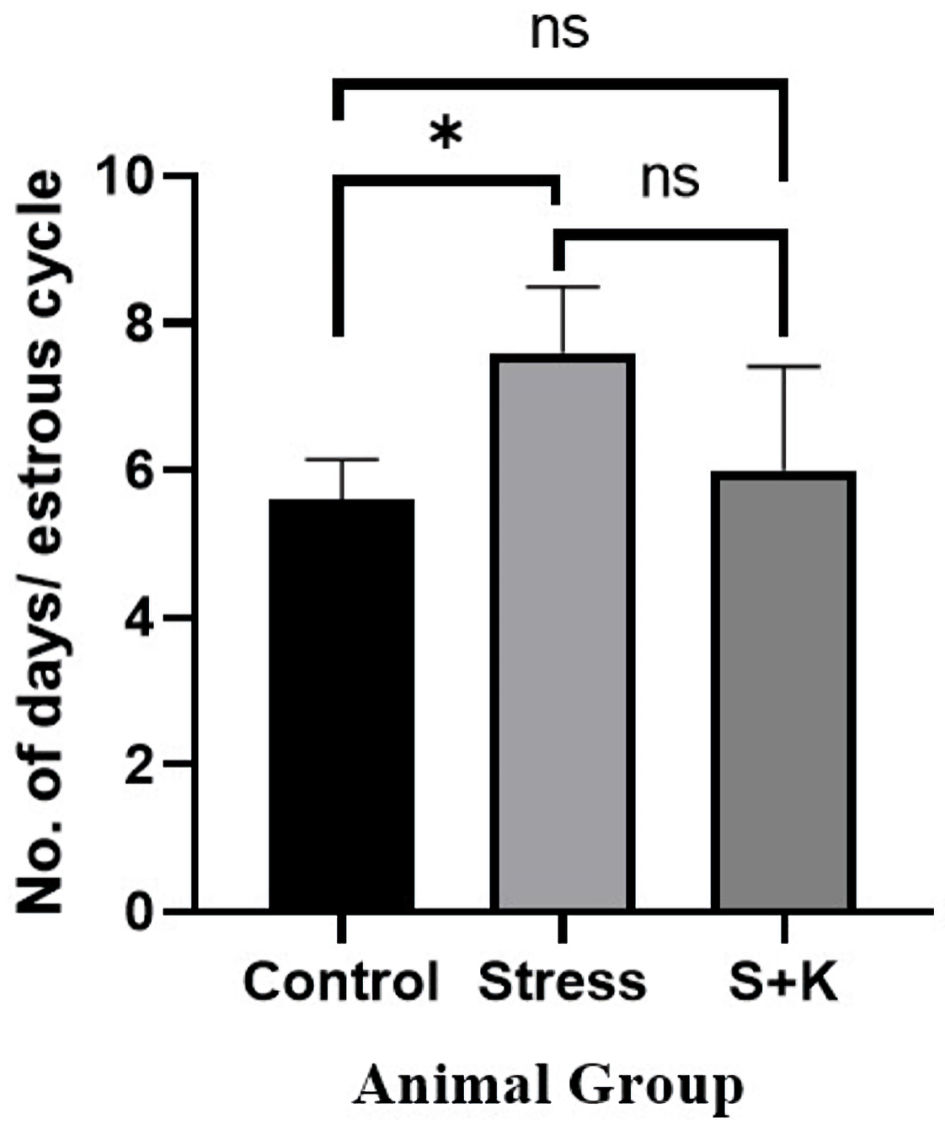
Figure 6. Number of days per estrous cycle of control, stress, and ketoconazole-induced group of animals. *P ≤ 0.05. S+K: animal group with 50 mg/kg body weight ketoconazole prior to stress; ns: not significant.
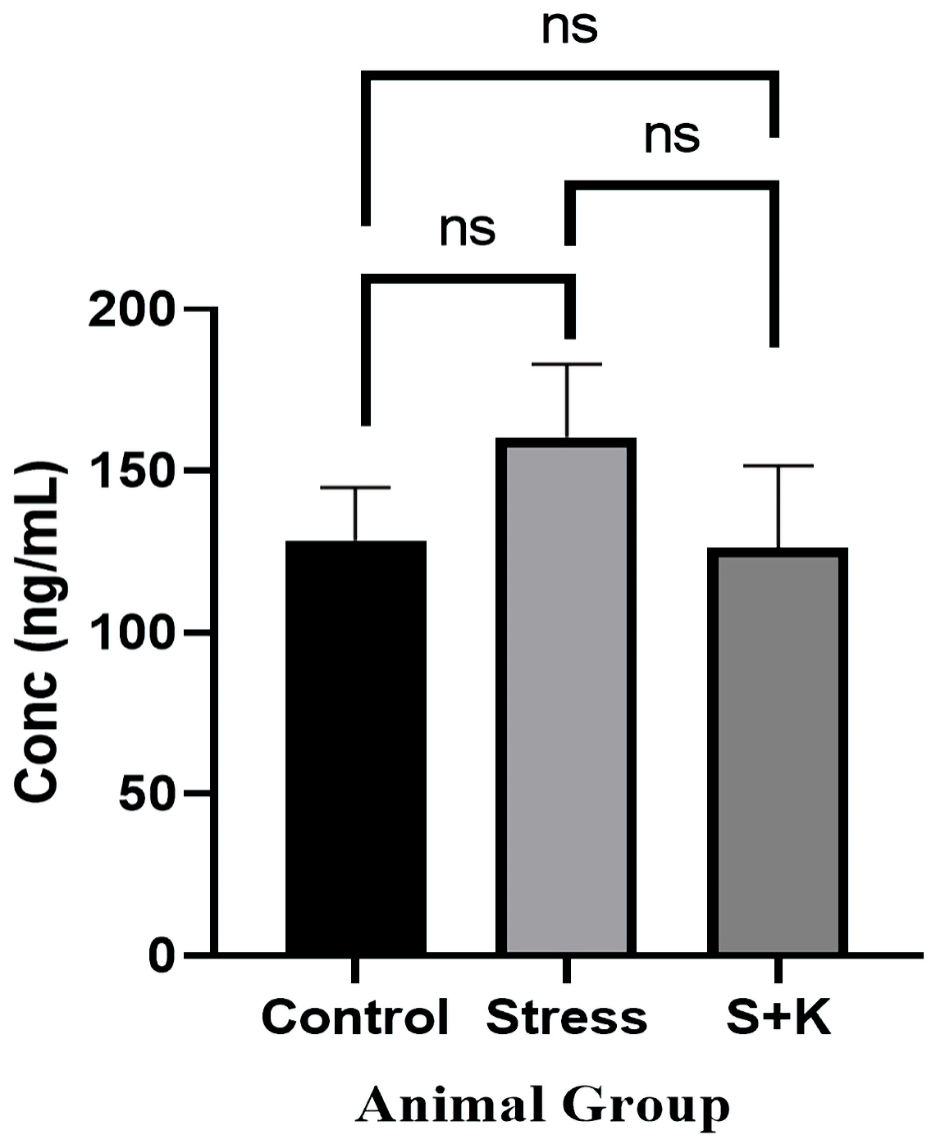
Figure 7. Plasma corticosterone level of control, stress and ketoconazole-induced group of animals. S+K: animal group with 50 mg/kg body weight ketoconazole prior to stress; ns: not significant.
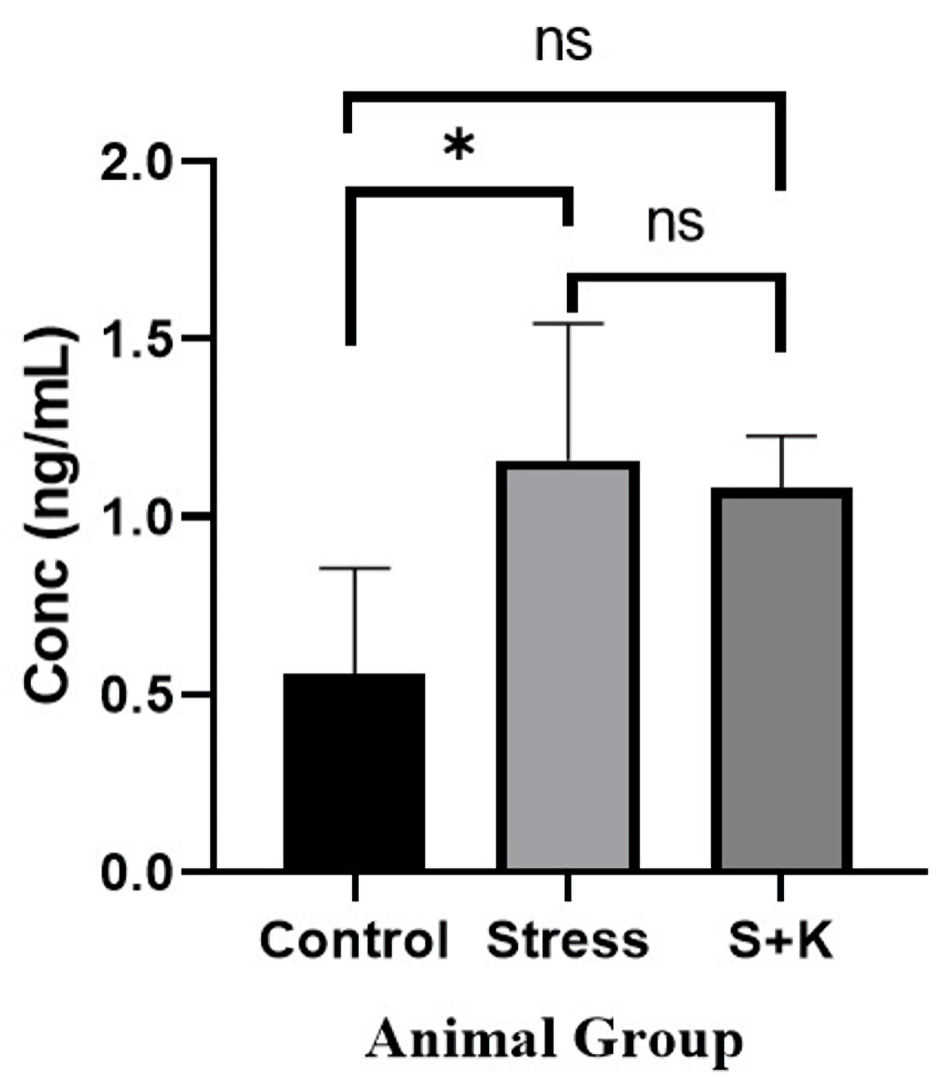
Figure 8. Plasma testosterone level of control, stress and ketoconazole-induced group of animals. *P ≤ 0.05. S+K: animal group with 50 mg/kg body weight ketoconazole prior to stress; ns: not significant.
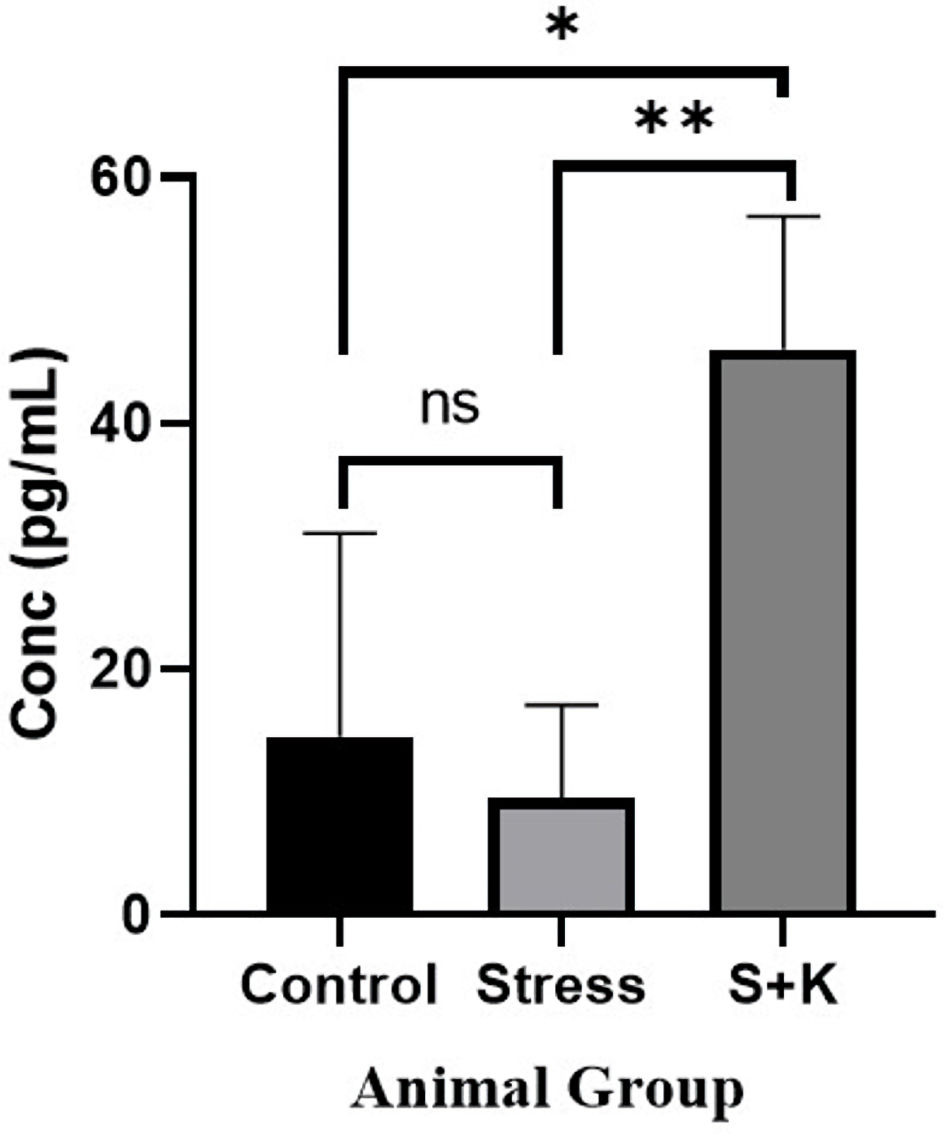
Figure 9. Plasma estradiol level of control, stress and ketoconazole-induced group of animals. *P ≤ 0.05. **P ≤ 0.01. S+K: animal group with 50 mg/kg body weight ketoconazole prior to stress; ns: not significant.