Figures
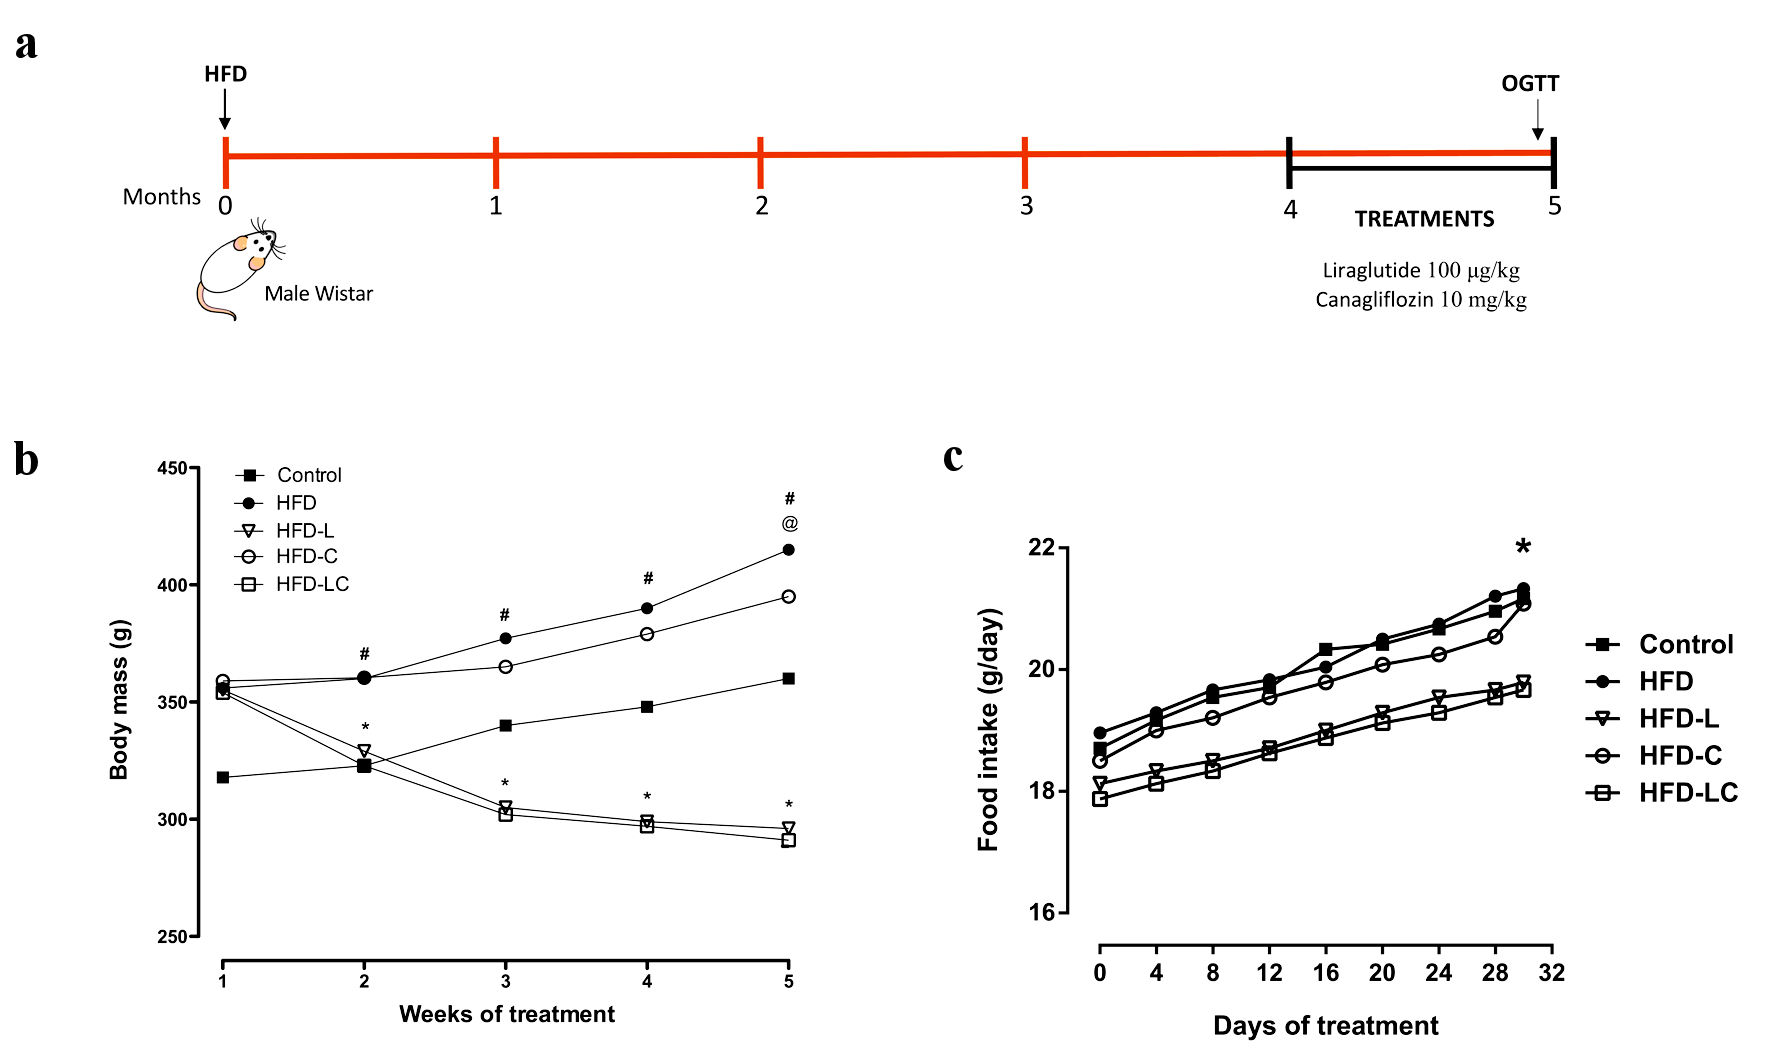
Figure 1. Effects of liraglutide and canagliflozin on body mass and food intake of high-fat diet-fed rats. (a) Experimental design. (b) Body mass evolution, #P < 0.001 HFD vs. control, HFD-L, and HFD-LC. *P < 0.001 HFD-L vs. HFD-C. @P < 0.01 HFD-C vs. HFD, HFD-L, and HFD-LC. (c) Food intake evolution, expressed as the amount consumed per rat per day. *P < 0.05 HFD vs. HFD-LC. Values are means and SEM (n = 10 per experimental group). Control: rats on a regular diet; HFD: high-fat diet; HFD-L: HFD treated with liraglutide; HFD-C: HFD treated with canagliflozin; HFD-LC: HFD treated with liraglutide plus canagliflozin; SEM: standard error of the mean.
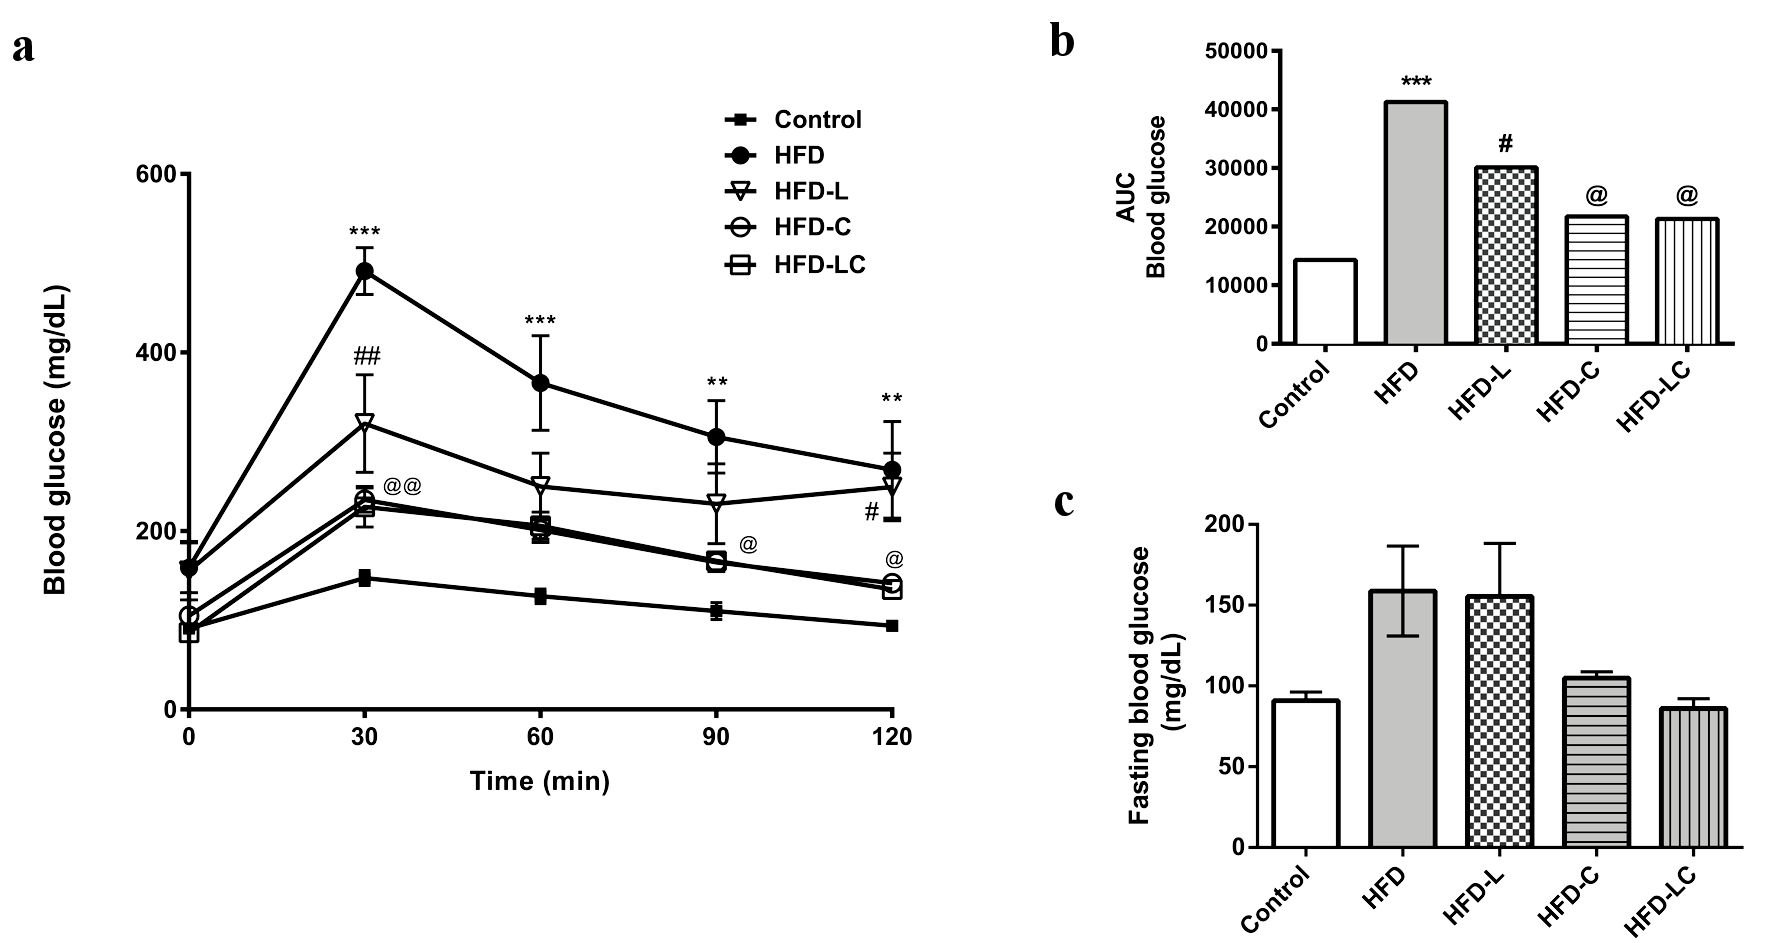
Figure 2. Effects of liraglutide and canagliflozin on the glucose metabolism of high-fat diet-fed rats. (a) Oral glucose tolerance test (OGTT) performed after the treatment period. (b) Area under the curve (AUC) of the OGTT graph. ***P < 0.001 HFD vs. control, HFD-C, and HFD-LC. **P < 0.01 HFD vs. HFD-C and HFD-LC. ##P < 0.001 HFD-L vs. HFD. @@P < 0.001 HFD-C and HFD-LC vs. HFD. @P < 0.01 HFD-C and HFD-LC vs. HFD. #P < 0.05 HFD-L vs. HFD-C and HFD-LC. (c) Fasting blood glucose before OGTT. Values are means and SEM (n = 10 per experimental group). Control: rats on a regular diet; HFD: high-fat diet; HFD-L: HFD treated with liraglutide; HFD-C: HFD treated with canagliflozin; HFD-LC: HFD treated with liraglutide plus canagliflozin; SEM: standard error of the mean.
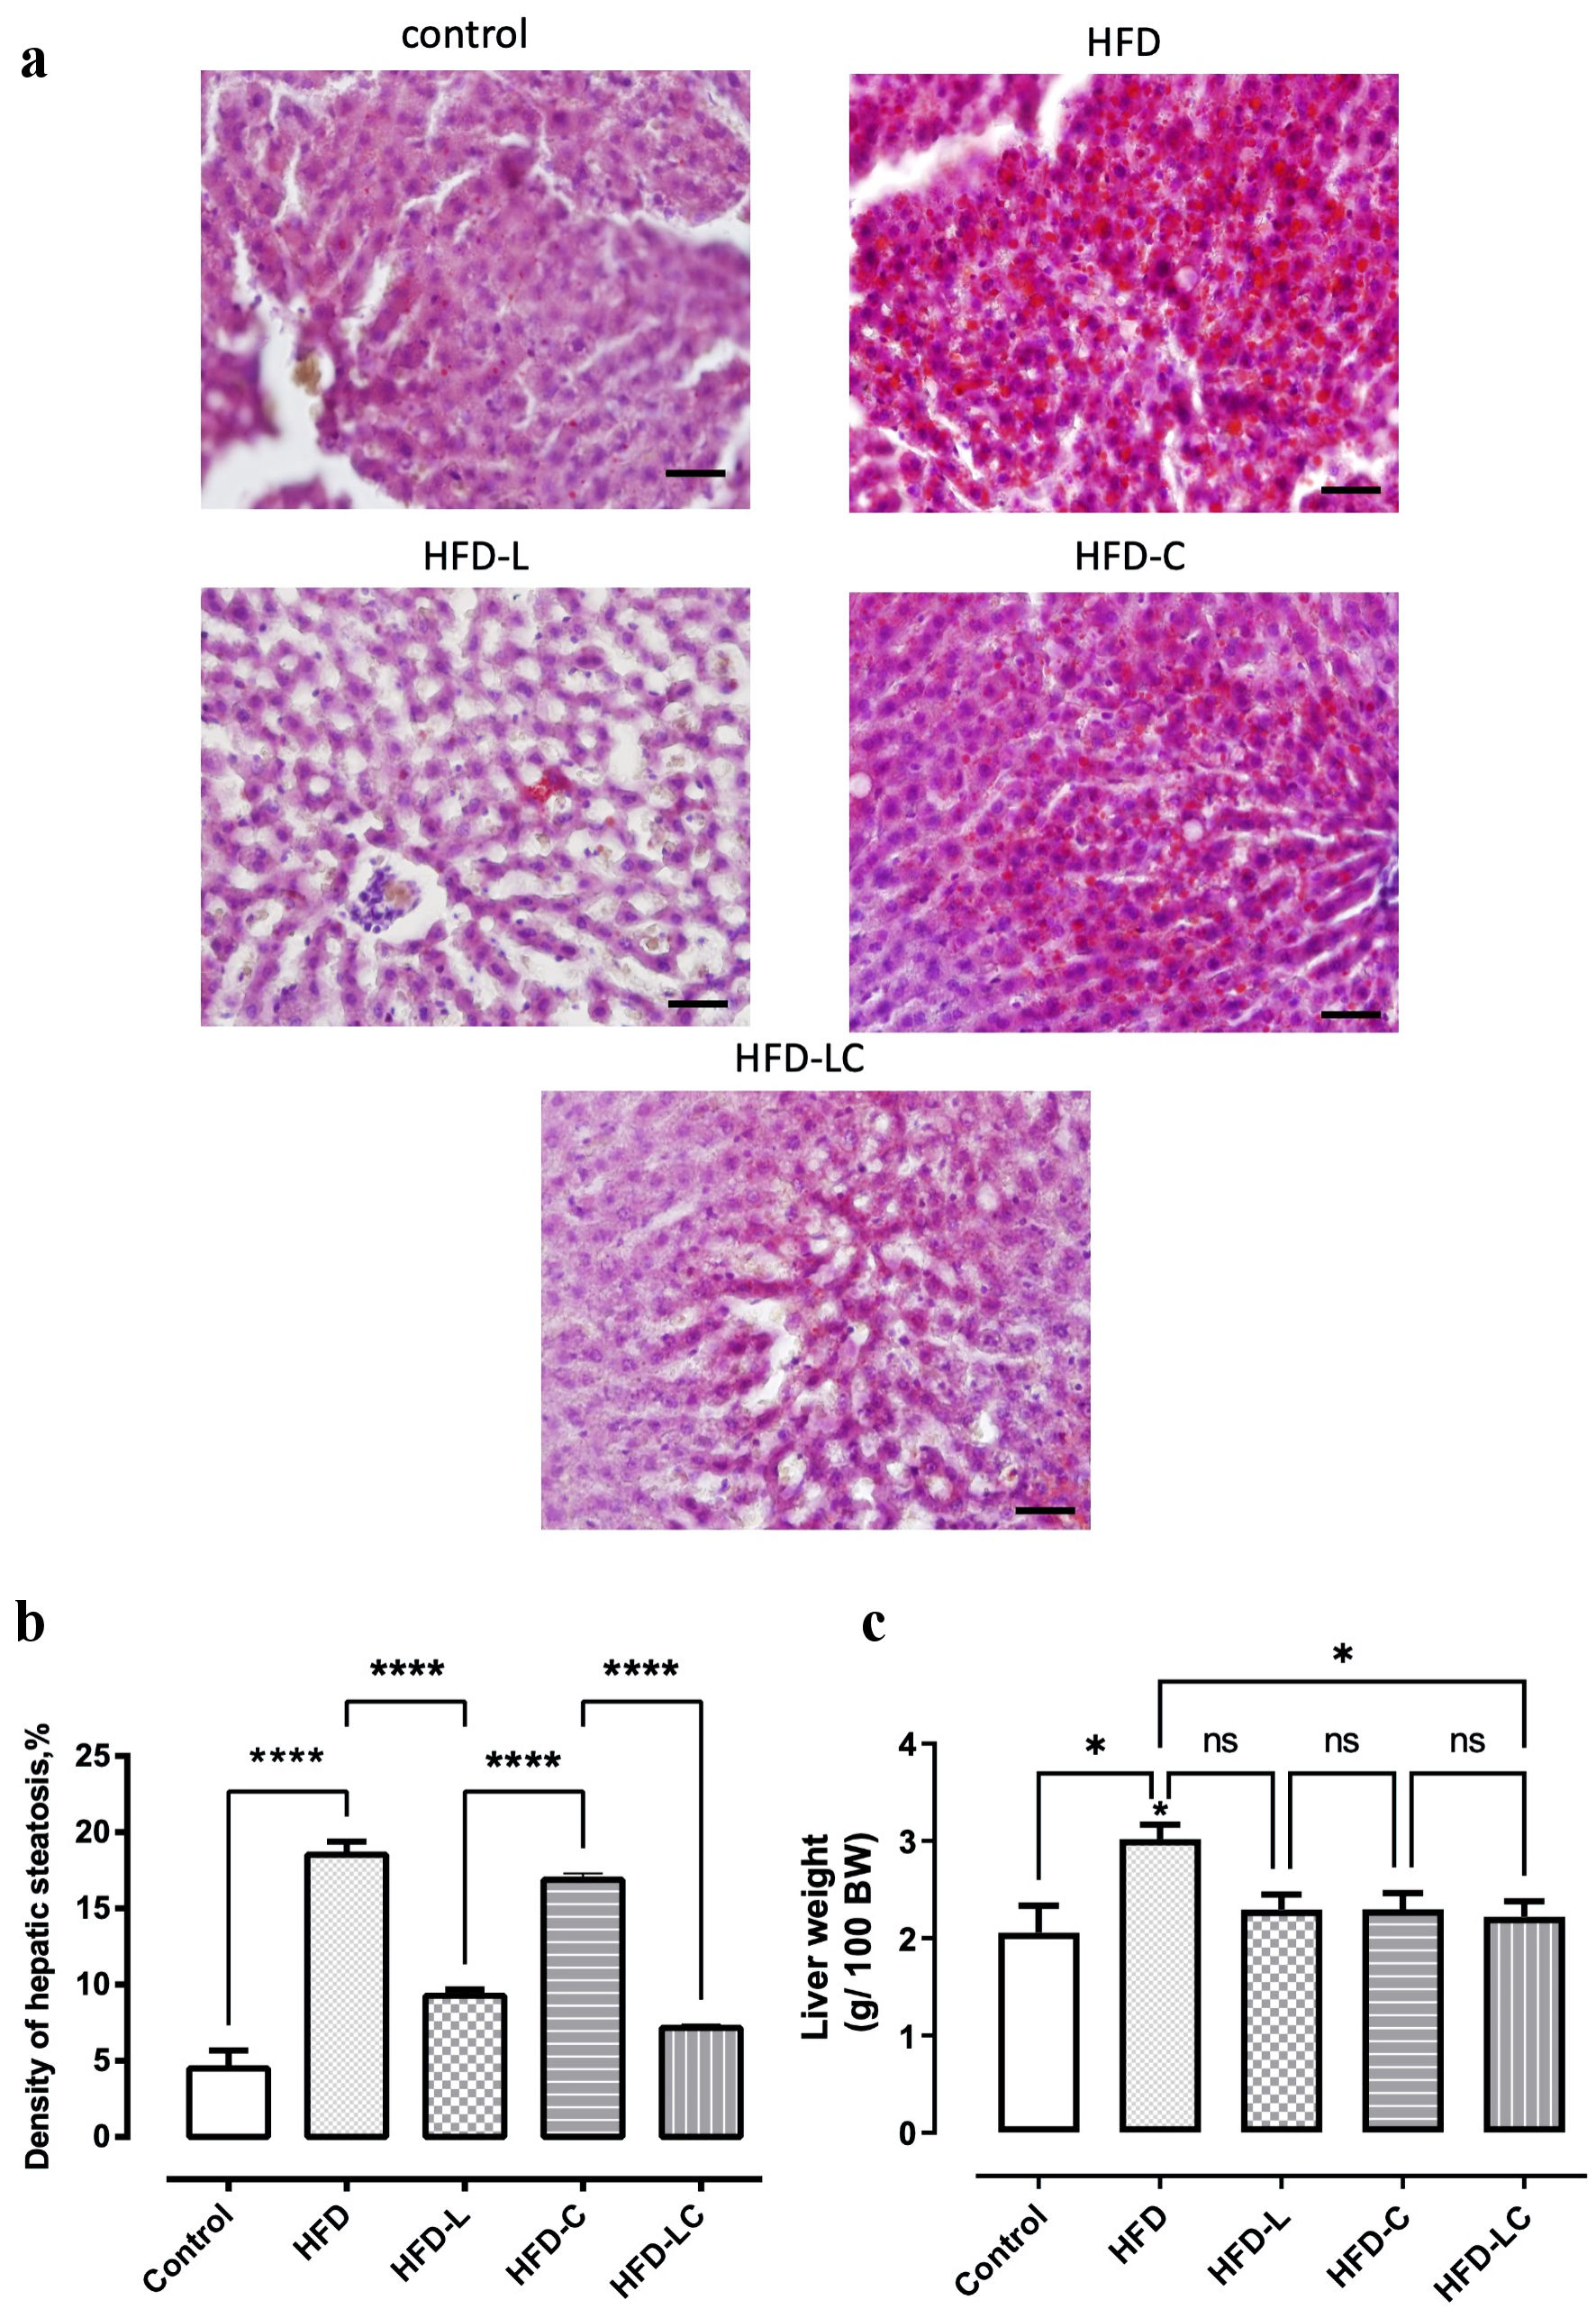
Figure 3. Treatments with liraglutide and canagliflozin reduced liver fat of high-fat diet-fed rats. Liver slices were stained with oil red O to enable observation of hepatic steatosis (red). (a) Rats on a regular diet (control). (b) High-fat diet (HFD). (c) HFD + liraglutide (HFD-L). (d) HFD + canagliflozin (HFD-C). (e) HFD + canagliflozin + liraglutide (HFD-LC). (f) Morphometric analysis of liver steatosis after treatment period. (g) Liver weights after treatment period. Values are means and SEM. *P < 0.05, ****P < 0.0001. Scale bar = 50 µm. SEM: standard error of the mean; ns: non-significant.
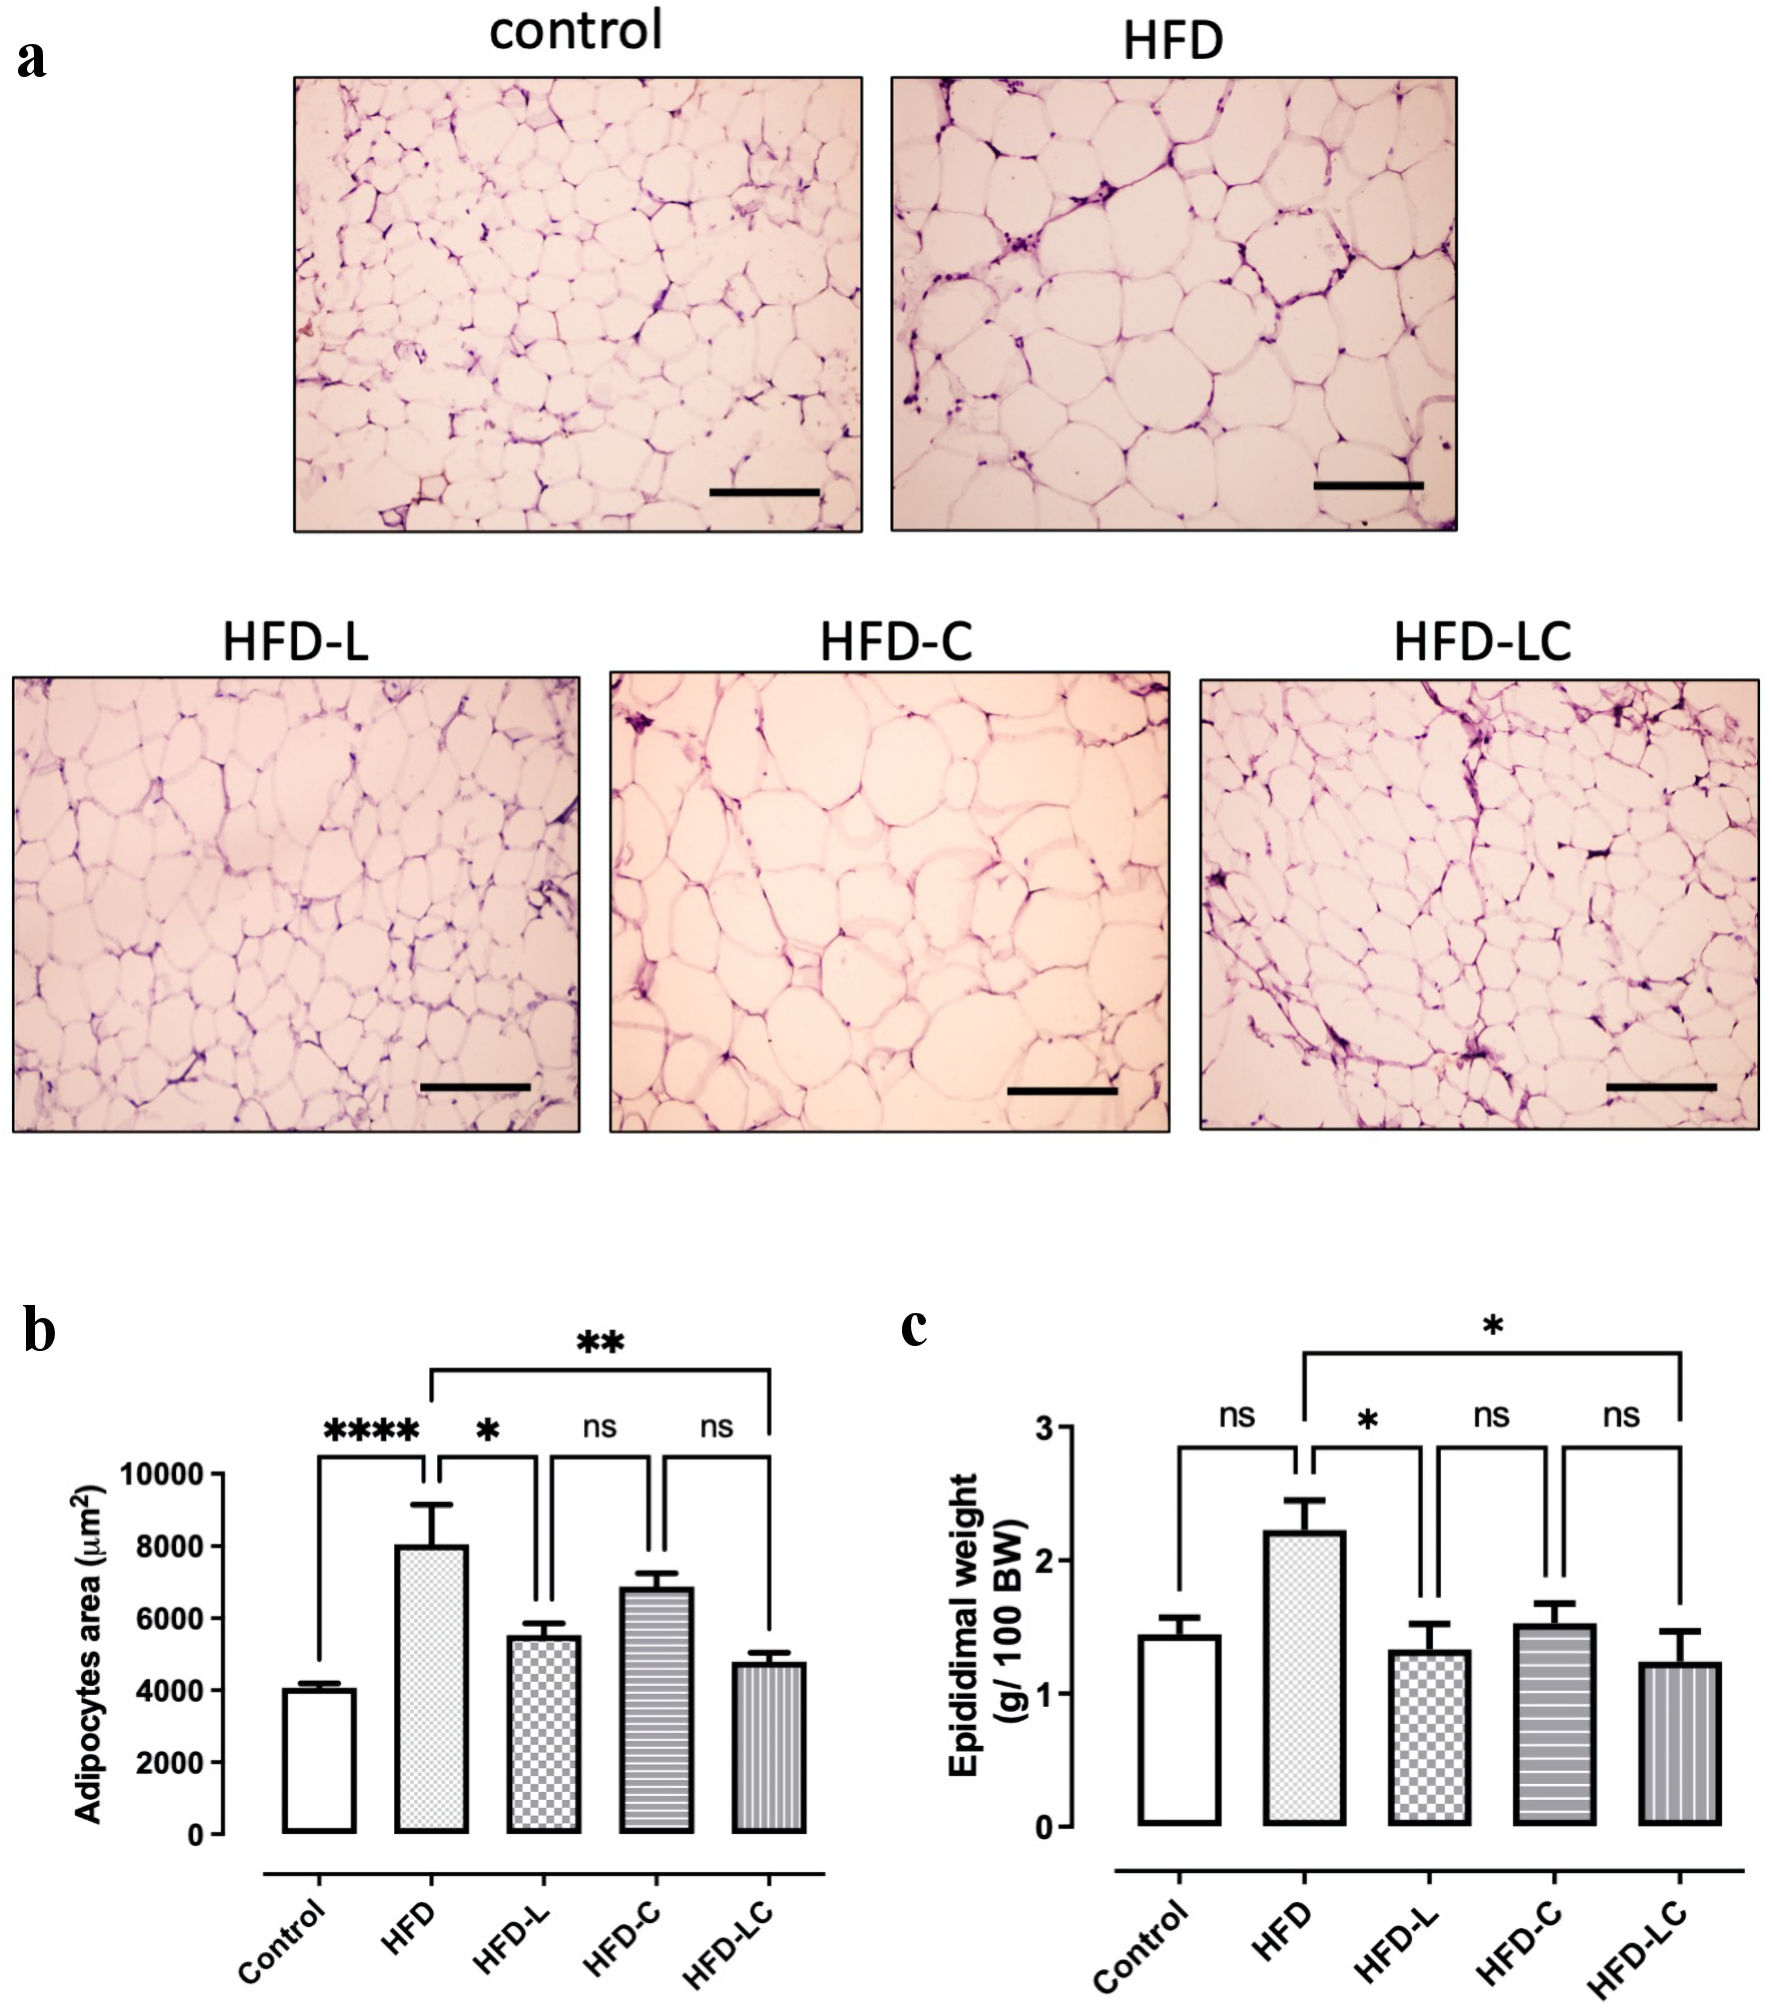
Figure 4. Effects of liraglutide and canagliflozin in the epididymal adipose tissue of high-fat diet-fed rats. Histology of the epididymal adipose tissue of: (a) rats on a regular diet (control), (b) high-fat diet (HFD), (c) HFD + liraglutide (HFD-L), (d) HFD + canagliflozin (HFD-C), (e) HFD + canagliflozin + liraglutide HFD-LC. (f) Morphometric analysis of adipocyte area after treatment period. (g) Epididymal weight after treatment period. ****P < 0.0001, **P < 0.001, *P < 0.05. Scale bar = 100 µm.
Tables
Table 1. Composition of the Experimental High-Fat Diet
| Ingredient (g/kg) | Control | HFD |
|---|
| The diet was formulated to meet the American Institute of Nutrition AIN-93G recommendations for rodent diets by Prag Solucoes. Control group was fed with a diet containing only soybean oil. The high fat diets containing soybean oil and lard. BHT: butylhydroxytoluene. |
| Casein | 140 | 175 |
| Cornstarch | 465.7 | 192.6 |
| Sucrose | 155 | 155 |
| Soybean oil | 100 | 100 |
| Lard | - | 238 |
| Fiber | 50 | 50 |
| AIN-93G mineral mix | 35 | 35 |
| AIN-93 vitamin mix | 10 | 10 |
| L-cystine | 1.8 | 1.8 |
| Choline bitartrate | 2.5 | 2.5 |
| BHT | 0.008 | 0.06 |
| Energy (kcal/g) | 15,909 | 20,934 |
| Protein (% of energy) | 76 | 36 |
| Carbohydrate (% of energy) | 14 | 14 |
| Fat (% of energy) | 10 | 50 |
Table 2. Effects of Liraglutide and Canagliflozin in Metabolic Parameters of HFD Rats
| Variables (mg/dL) | Control | HFD | HFD-L | HFD-C | HFD-LC |
|---|
| Values are expressed as means and SEM of six to eight animals per group. Total cholesterol: aP < 0.001 vs. control; bP < 0.05 vs. HFD; cP < 0.001 vs. HFD. Triglycerides: aP < 0.001 vs. control; bP < 0.001 vs. HFD; cP < 0.01 vs. HFD-LC and vs. HFD. HDL cholesterol: aP < 0.01 vs. control; bP < 0.01 vs. HFD; cP < 0.05 vs. HFD. LDL cholesterol: aP < 0.01 vs. control; bP < 0.01 vs. HFD; cP < 0.001 vs. HFD. Glucose urine: aP < 0.001 vs. control. HDL: high-density lipoprotein; LDL: low-density lipoprotein; AST: aspartate aminotransferase; ALT: alanine aminotransferase; HFD: high-fat diet; HFD-L: HFD treated with liraglutide; HFD-C: HFD treated with canagliflozin; HFD-LC: HFD treated with liraglutide plus canagliflozin; SEM: standard error of the mean. |
| Total cholesterol | 60.1 ± 4.8 | 110.6 ± 14.5a | 79.5 ± 4.3b | 85.7 ± 5.8b | 63.3 ± 3.4c |
| Triglycerides | 82.9 ± 5.9 | 215.9 ± 16.1a | 94.4 ± 9.3b | 138.9 ± 11.5c | 70.3 ± 10.3b |
| LDL cholesterol | 44.5 ± 8.0 | 92.5 ± 3.4a | 47.0 ± 11.0b | 58.2 ± 10.1b | 33.3 ± 5.5c |
| HDL cholesterol | 93.5 ± 7.9 | 38.7 ± 5.2a | 72.3 ± 8.6b | 64.1 ± 5.1c | 91.5 ± 8.9b |
| AST | 37.1 ± 3.6 | 36.0 ± 3.4 | 35.0 ± 4.5 | 33.0 ± 4.9 | 37.0 ± 5.3 |
| ALT | 47.7 ± 5.9 | 46.5 ± 1.5 | 38.3 ± 2.1 | 53.0 ± 6.4 | 54.2 ± 2.4 |
| Glucose in urine | 65.7 ± 3.3 | 68.0 ± 3.0 | 65.7 ± 3.1 | 185.3 ± 2.8a | 184.7 ± 4.1a |
Table 3. Summary of Effects on Metabolic Syndrome Parameters
| Treatments |
|---|
| Lira | Cana | Lira + Cana |
|---|
| Lira: liraglutide; Cana: canagliflozin; HDL: high-density lipoprotein. |
| Metabolic syndrome | | | |
| Body mass | ++ | + | ++ |
| Food intake | ++ | + | ++ |
| Fasting blood glucose | + | ++ | ++ |
| Abdominal fat | ++ | + | ++ |
| Liver fat | ++ | + | +++ |
| Dyslipidemia | ++ | + | +++ |
| Triglycerides | ++ | + | +++ |
| HDL cholesterol | ++ | + | +++ |