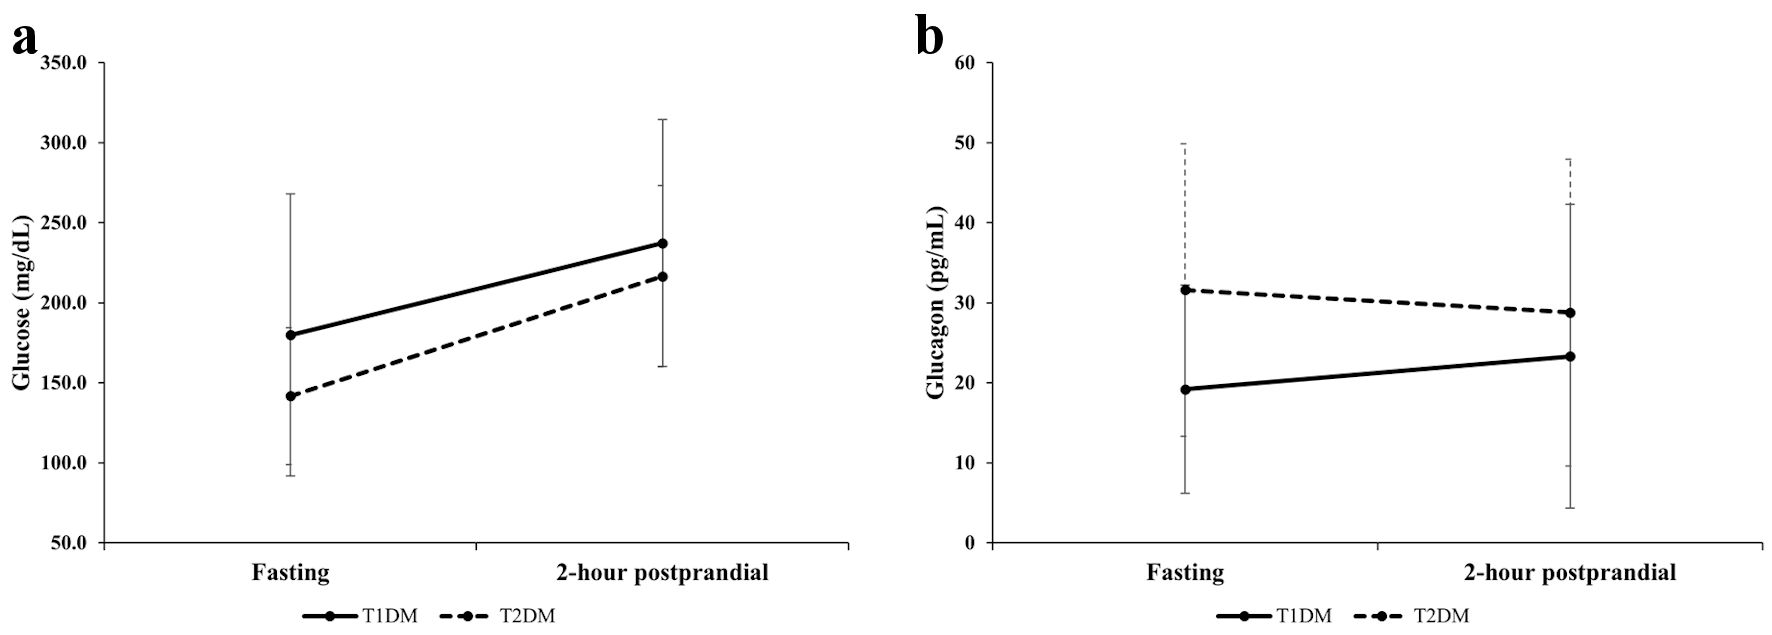
Figure 1. Comparison of changes in glucose (a) and glucagon (b) levels between patients with T1DM and those with T2DM from fasting to 2-h postprandial state. T1DM: type 1 diabetes; T2DM: type 2 diabetes.
| Journal of Endocrinology and Metabolism, ISSN 1923-2861 print, 1923-287X online, Open Access |
| Article copyright, the authors; Journal compilation copyright, J Endocrinol Metab and Elmer Press Inc |
| Journal website https://www.jofem.org |
Original Article
Volume 12, Number 4-5, October 2022, pages 134-139
The Difference in Glucagon Response to Breakfast Between Non-Obese Patients With Long-Duration Type 1 and Type 2 Diabetes
Figure
Table
| Type 1 diabetes | Type 2 diabetes | P | |
|---|---|---|---|
| Data are represented as the mean value (SD) except for the number of subjects and sex. BMI: body mass index; PG0: fasting plasma glucose; PG2h: 2-h postprandial plasma glucose; CPR0: fasting C-peptide; CPR2h: 2-h postprandial C-peptide; G0: fasting plasma glucagon; G2h: 2-h postprandial plasma glucagon; HbA1c: hemoglobin A1c; eGFR: estimated glomerular filtration rate. SD: standard deviation. | |||
| N | 13 | 13 | - |
| Age (years) | 70.1 (10.1) | 70.3 (9.9) | 1 |
| Gender (male/female) | 11/2 | 11/2 | 1 |
| BMI (kg/m2) | 22.5 (3.0) | 22.7 (3.0) | 0.92 |
| Waist circumference (cm) | 84.7 (7.8) | 87.7 (11.6) | 0.68 |
| Duration of diabetes (years) | 18.2 (14.3) | 12.2 (9.0) | 0.26 |
| PG0 (mg/dL) | 179.9 (88.1) | 141.9 (42.8) | 0.22 |
| PG2h (mg/dL) | 237.3 (77.1) | 216.6 (56.6) | 0.45 |
| CPR0 (ng/mL) | < 0.02 | 1.33 (0.72) | < 0.001 |
| CPR2h (ng/mL) | < 0.02 | 3.84 (2.57) | < 0.001 |
| G0 (pg/mL) | 19.2 (13.0) | 31.6 (18.3) | 0.029 |
| G0/PG0 | 0.12 (0.09) | 0.25 (0.19) | 0.01 |
| G2h (pg/mL) | 23.3 (19.0) | 28.8 (19.2) | 0.34 |
| G2h/PG2h | 0.10 (0.07) | 0.13 (0.07) | 0.31 |
| HbA1c (%) | 8.7 (1.4) | 8.5 (1.7) | 0.54 |
| eGFR (mL/min/1.73m2) | 63.8 (24.4) | 65.2 (16.3) | 0.92 |
| Medication | |||
| Insulin | 13 | 9 | 0.096 |
| Metformin | - | 3 | 0.22 |
| Dipeptidyl peptidase-4 inhibitors | - | 4 | 0.096 |
| Sodium-glucose cotransporter 2 inhibitors | 2 | 1 | 1 |
| Pioglitazone | - | 1 | 1 |
| Sulfonylurea | - | 1 | 1 |
| α-glucosidase inhibitor | - | 1 | 1 |