Journal of Endocrinology and Metabolism, ISSN 1923-2861 print, 1923-287X online, Open Access
Article copyright, the authors; Journal compilation copyright, J Endocrinol Metab and Elmer Press Inc
Journal website http://www.jofem.org

Original Article

Volume 2, Number 2, April 2012, pages 72-81


Clinical Validation of ELISA Assays for Insulin-Like Growth Factor-II (IGF-II)

Figures

Figure 1.
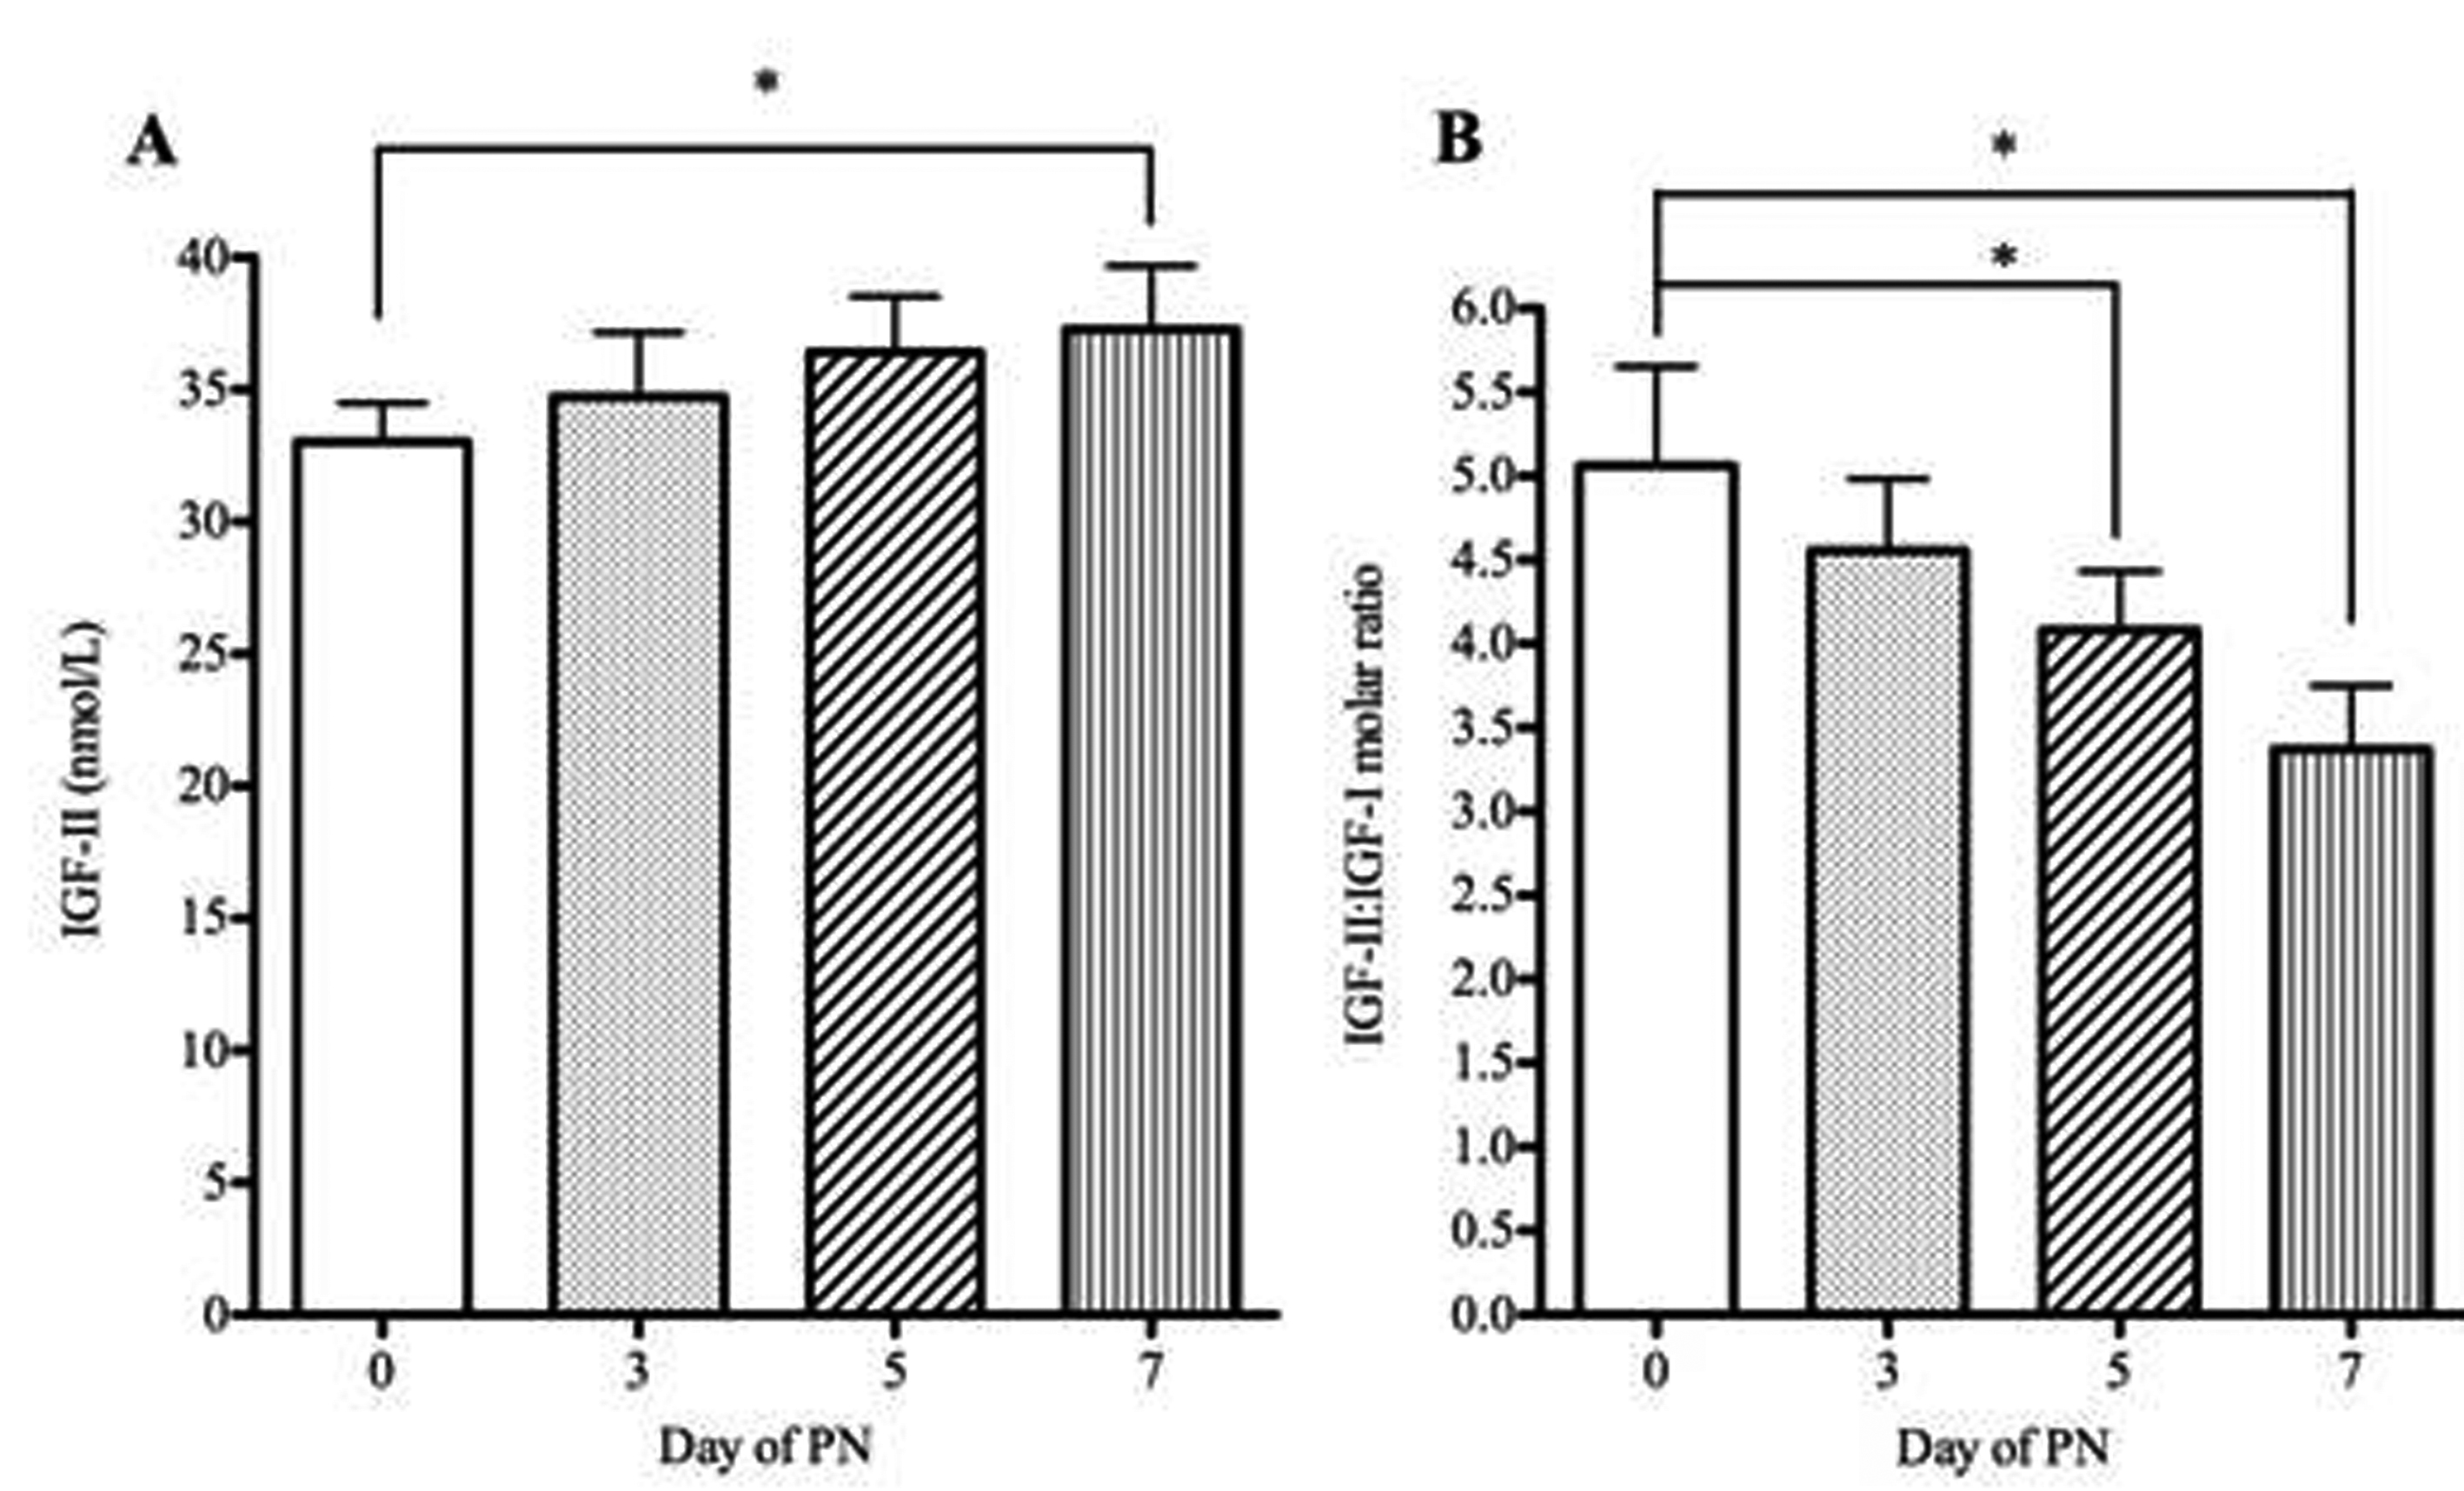
Figure 1. IGF-II concentrations measured by RIA and IGFII-IGF-I molar ratio in patients receiving parenteral nutrition. Serum IGF-II (A), IGF-II:IGF-I molar ratio (B) in patients at baseline (day 0) and days three, five and seven of PN administration. Serum IGF-II and the IGF-II: IGF-I molar ratio were tested for significance using repeated measures ANOVA with Dunnett’s multiple comparison tests. * P < 0.05. Error bars are +SEM.
Figure 2.
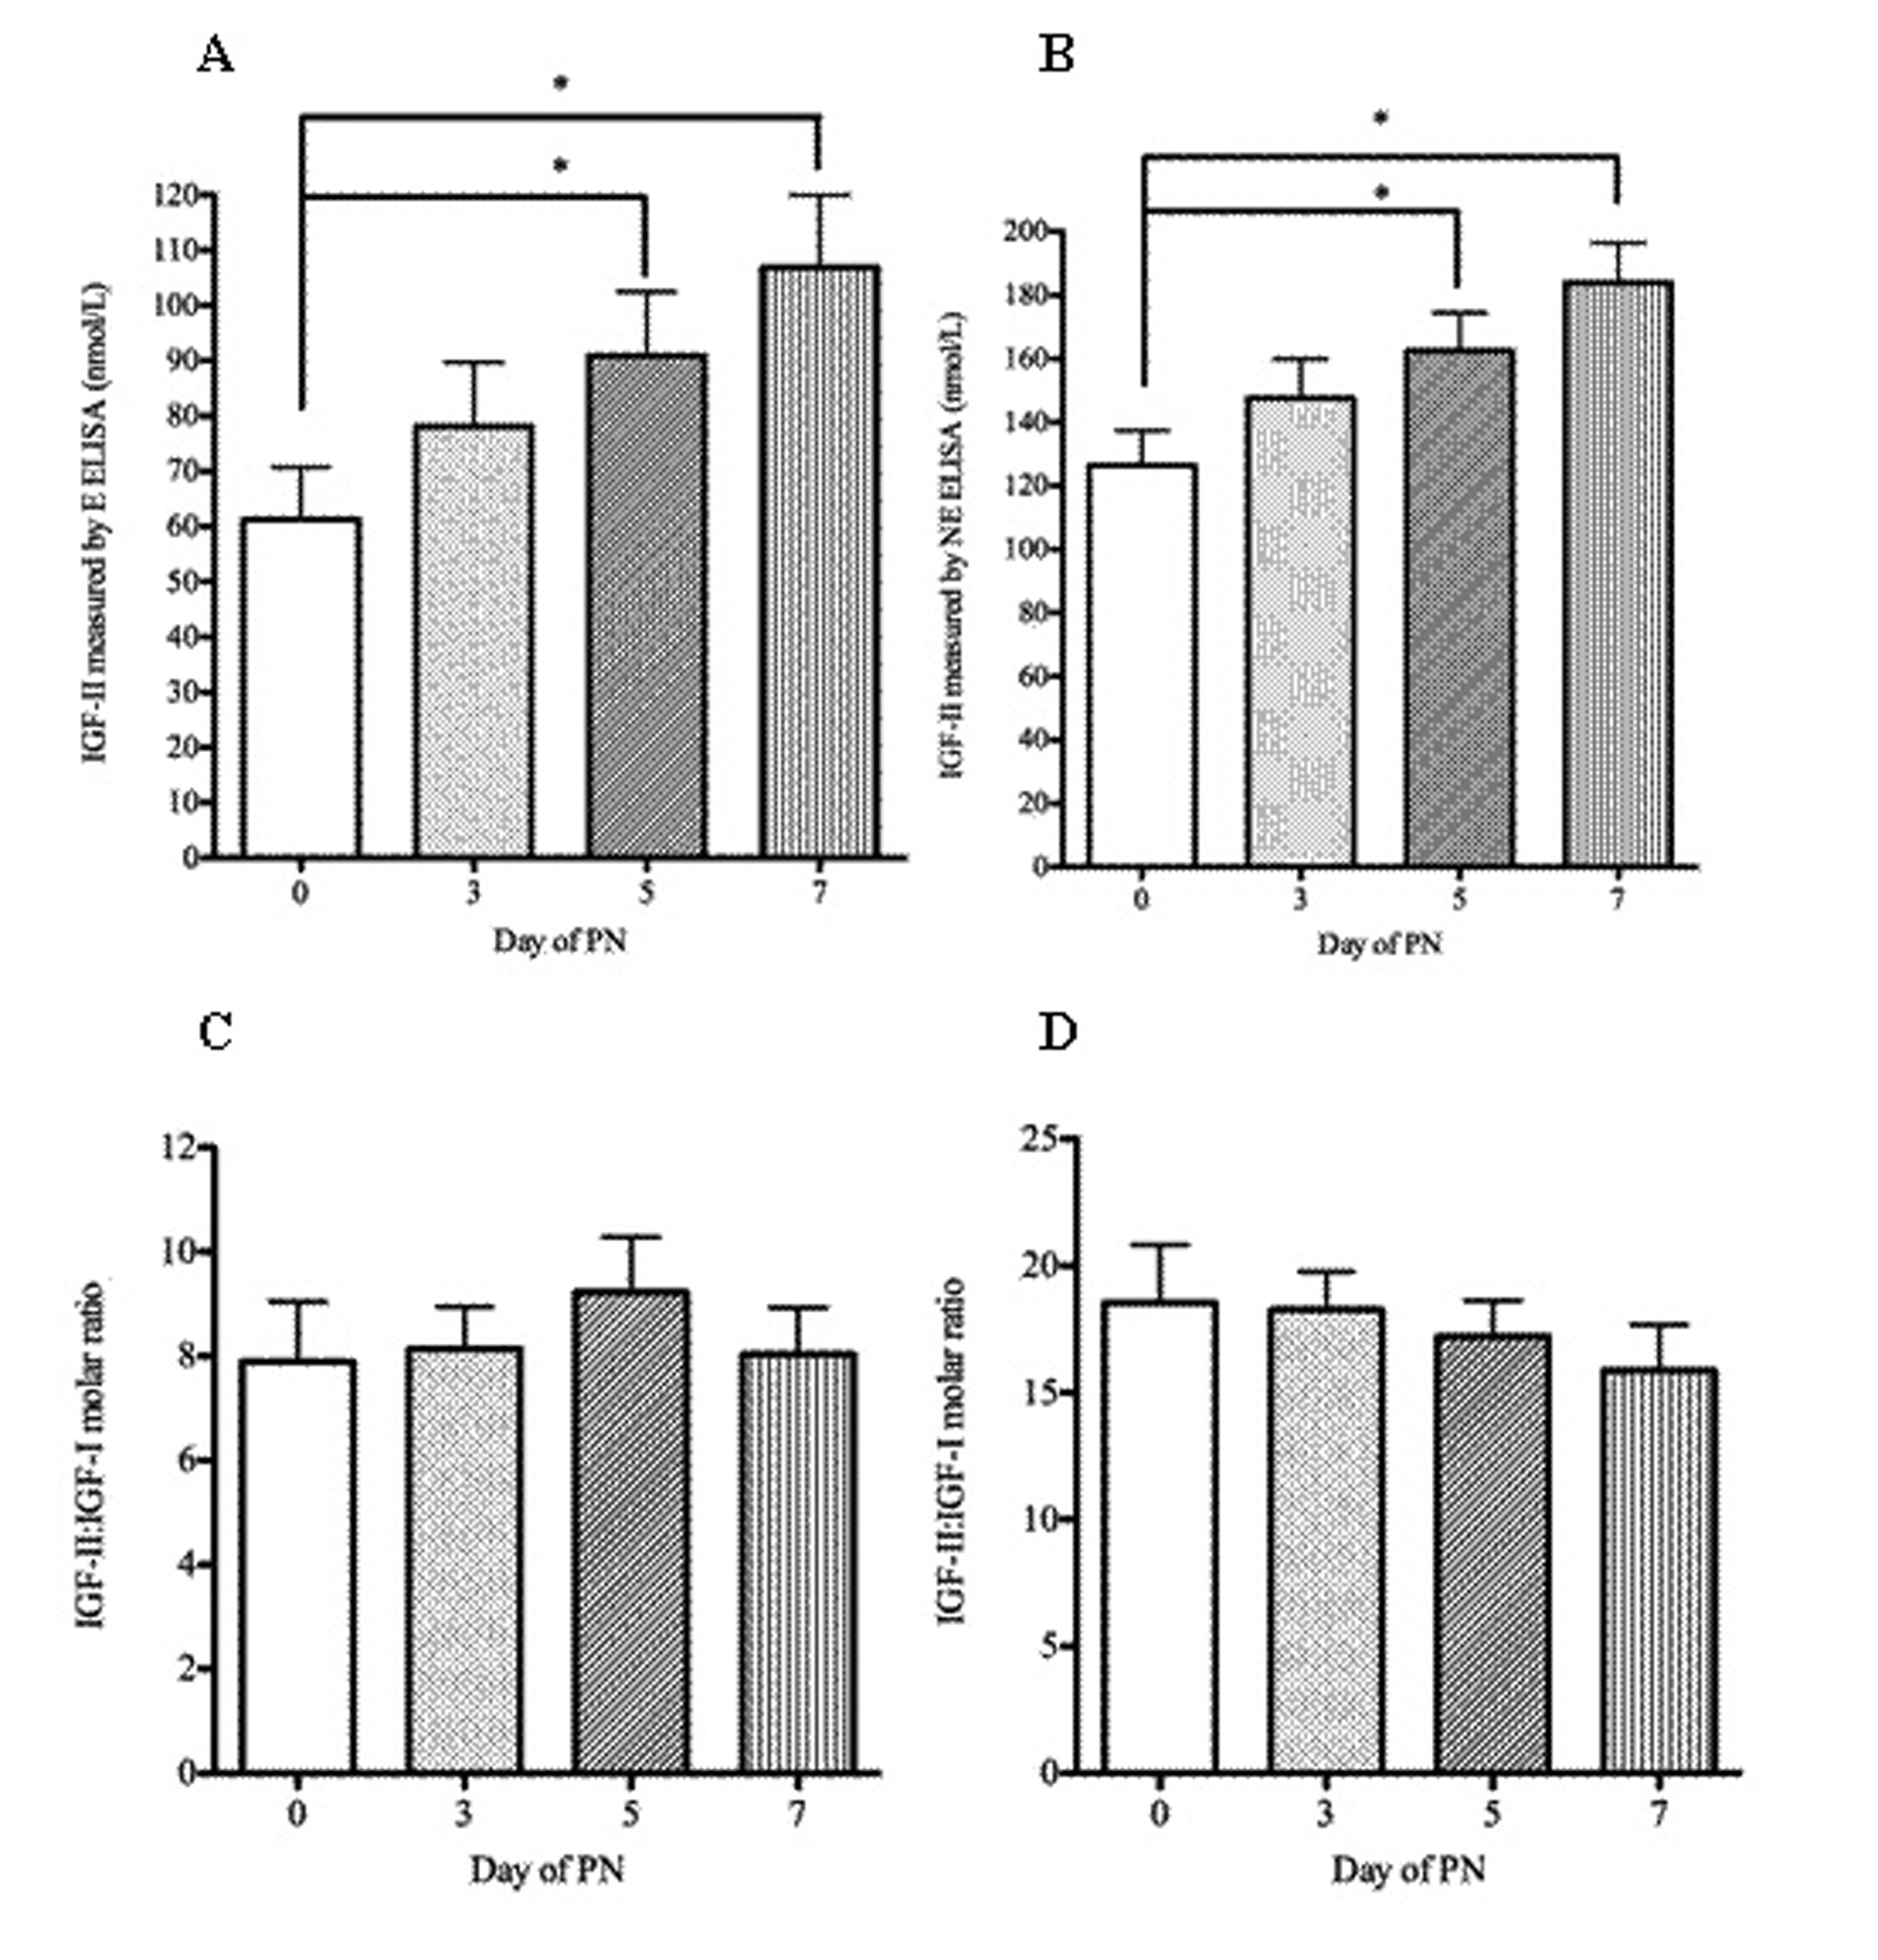
Figure 2. IGF-II concentrations measured by ELISA and IGFII-IGF-I molar ratio in patients receiving parenteral nutrition. Serum IGF-II (A, B), IGF-II: IGF-I molar ratio (C, D) in patients at baseline (day 0) and days three, five and seven of PN administration. A and C were measured by extraction ELISA and B and D by non-extraction ELISA). Serum IGF-II and the IGF-II: IGF-I molar ratio were tested for significance using repeated measures ANOVA with Dunnett’s multiple comparison tests. * P < 0.05. Error bars are +SEM.
Figure 3.
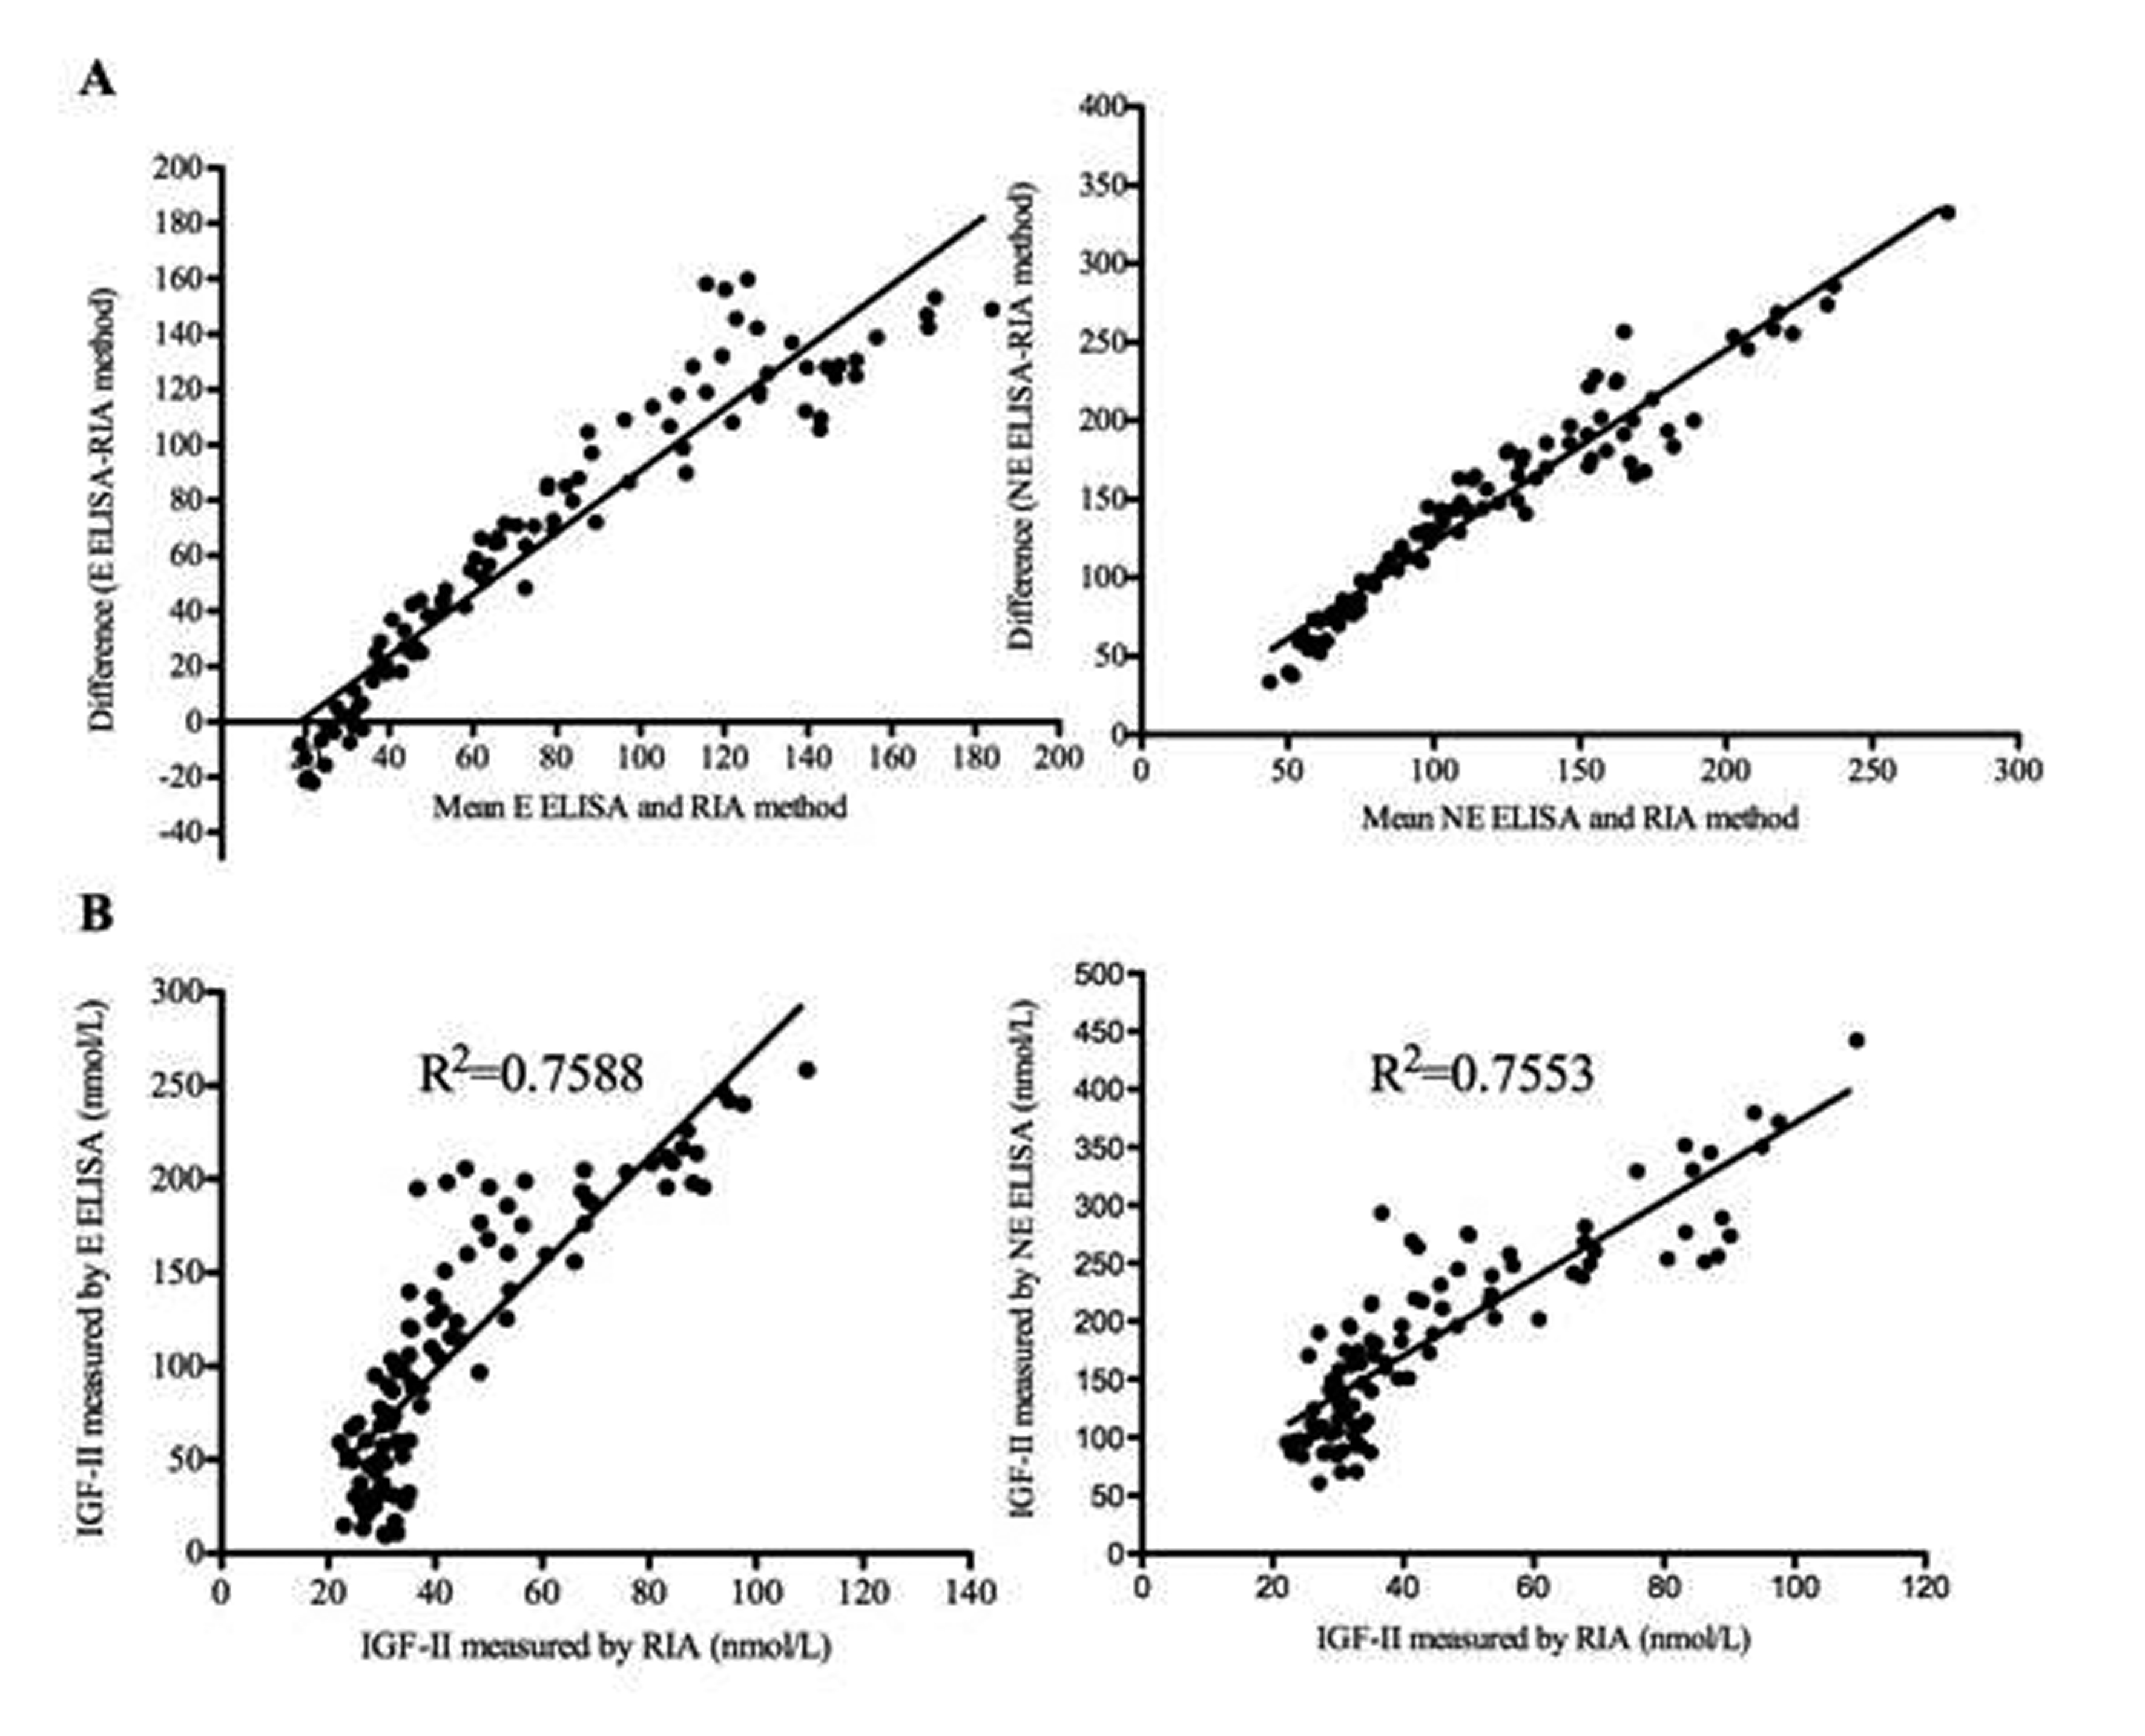
Figure 3. A. Bland Altman plots comparing IGF-II extraction (E) and non-extraction (NE) ELISA assays to RIA. B. Correlation analysis comparing IGF-II extraction and non-extraction ELISAs to the RIA, using the Pearson correlation coefficient, R2. Results are shown from IGF-II levels measured on a total of 23 healthy volunteers and 79 patient specimens.

Tables

Table 1. Baseline Characteristics of Study Subjects
 
ParameterMeanSDRange
Age58.812.537 - 77
Weight (kg)68.214.937 - 102
Weight loss (% in 6 months)6.66.80 - 21
BMI (kg/m2)24.14.314.5 - 34.1
‘MUST’ score2.90.72 - 4


Table 2. Correlates of Baseline IGF-II Concentrations (Measured By ELISA) and IGF-II: IGF-I Ratio in Patients Referred for Parenteral Nutrition
 
IGF-II (extraction ELISA)IGF-II:IGF-I molar ratio
rP valuerP value
BMI (kg/m2)0.45230.06150.46060.0410*
% weight loss (last 6 months)0.23210.32480.26860.2521
‘MUST’ score0.28200.22830.03920.8697
Weight (kg)0.52060.0186*0.39500.0848
IGF-II (non-extraction ELISA)IGF-II:IGF-I molar ratio
rP valuerP value
Pearson correlation analysis (r) was used for the IGF-II data and the IGF-II: IGF-I molar ratio. A two-tailed p-value was used to assess the significance of the correlation identified. * P < 0.05.
BMI (kg/m2)0.51310.0207*0.28140.2295
% weight loss (last 6 months)0.19970.39850.24660.2947
‘MUST’ score0.15410.5166-0.15210.5220
Weight (kg)0.53700.0146*0.08480.7221


Table 3. Correlation Analysis of IGF-II and IGF-II:IGF-I Molar Ratio With Biochemical Markers of the APR And Hepatic and Renal Function
 
(a) AnalyteIGF-II (extraction ELISA)IGF-II:IGF-I molar ratio
RsP valuersP value
CRP-0.25240.0248*-0.35090.0016*
Albumin0.7032< 0.0001*0.37910.0007*
Creatinine0.18460.10340.11650.3098
Urea-0.04980.66290.07760.4993
eGFR0.18370.10510.19490.0873
ALP-0.08340.46790.09050.4337
ALT0.15930.16370.13230.2513
aCa-0.11240.3473-0.13470.2627
(b) AnalyteIGF-II (non-extraction ELISA)IGF-II:IGF-I molar ratio
rsP valuersP value
Spearman rank correlation and two-tailed P-value were used (a) IGF-II measured using the extraction ELISA; (b) IGF-II measured using the non-extraction ELISA. * P < 0.05. Key: aCa, albumin-adjusted calcium; CRP, C-reactive protein; ALP, alkaline phosphatase; ALT, alanine transaminase; eGFR, estimated glomerular filtration rate.
CRP-0.30070.0071*-0.31940.0044*
Albumin0.7017< 0.0001*-0.13180.2533
Creatinine0.16320.1507-0.073490.5226
Urea-0.01870.87000.17180.1325
eGFR0.18370.10510.18470.1054
ALP-0.13640.23380.13080.2568
ALT0.12540.2740-0.06830.5550
aCa-0.055230.64490.05080.6739


Table 4. IGF-II Concentrations and IGF-II:IGF-I Molar Ratio in Patients With Clinical Features Suggestive of NICTH
 
PatientNon-extraction ELISAExtraction ELISARIA
IGF-II (nmol/L)IGF-II:IGF-I molar ratioIGF-II (nmol/L)IGF-II:IGF-I molar ratioIGF-II (nmol/L)IGF-II:IGF-I molar ratio
IGF-II was measured using the extraction and non-extraction IGF-II ELISA’s in serum from patients with possible NICTH in whom IGF-II had previously been measured by RIA. Key: ND = not determined due to IGF-I concentration being below the detection limit for the immunoassay (< 3.2 nmol/L). False positive and negative results are shown in bold and bold italics, respectively.
1140.030.485.318.644.29.6
2161.417.9177.719.789.09.9
369.520.412.43.725.47.3
4270.913.8196.910.074.83.8
5232.8ND246.7ND83.4ND
6121.535.749.214.592.827.3
7233.4ND159.4ND81.0ND
8196.147.866.716.3129.231.5
9281.172.1187.748.1120.730.9
10235.431.065.88.7168.522.2