Journal of Endocrinology and Metabolism, ISSN 1923-2861 print, 1923-287X online, Open Access
Article copyright, the authors; Journal compilation copyright, J Endocrinol Metab and Elmer Press Inc
Journal website https://www.jofem.org

Original Article

Volume 12, Number 2, April 2022, pages 53-58


Influence of Age on the Effects of Sodium-Glucose Cotransporter 2 Inhibitors in Japanese Patients With Type 2 Diabetes Mellitus

Figures

Figure 1.
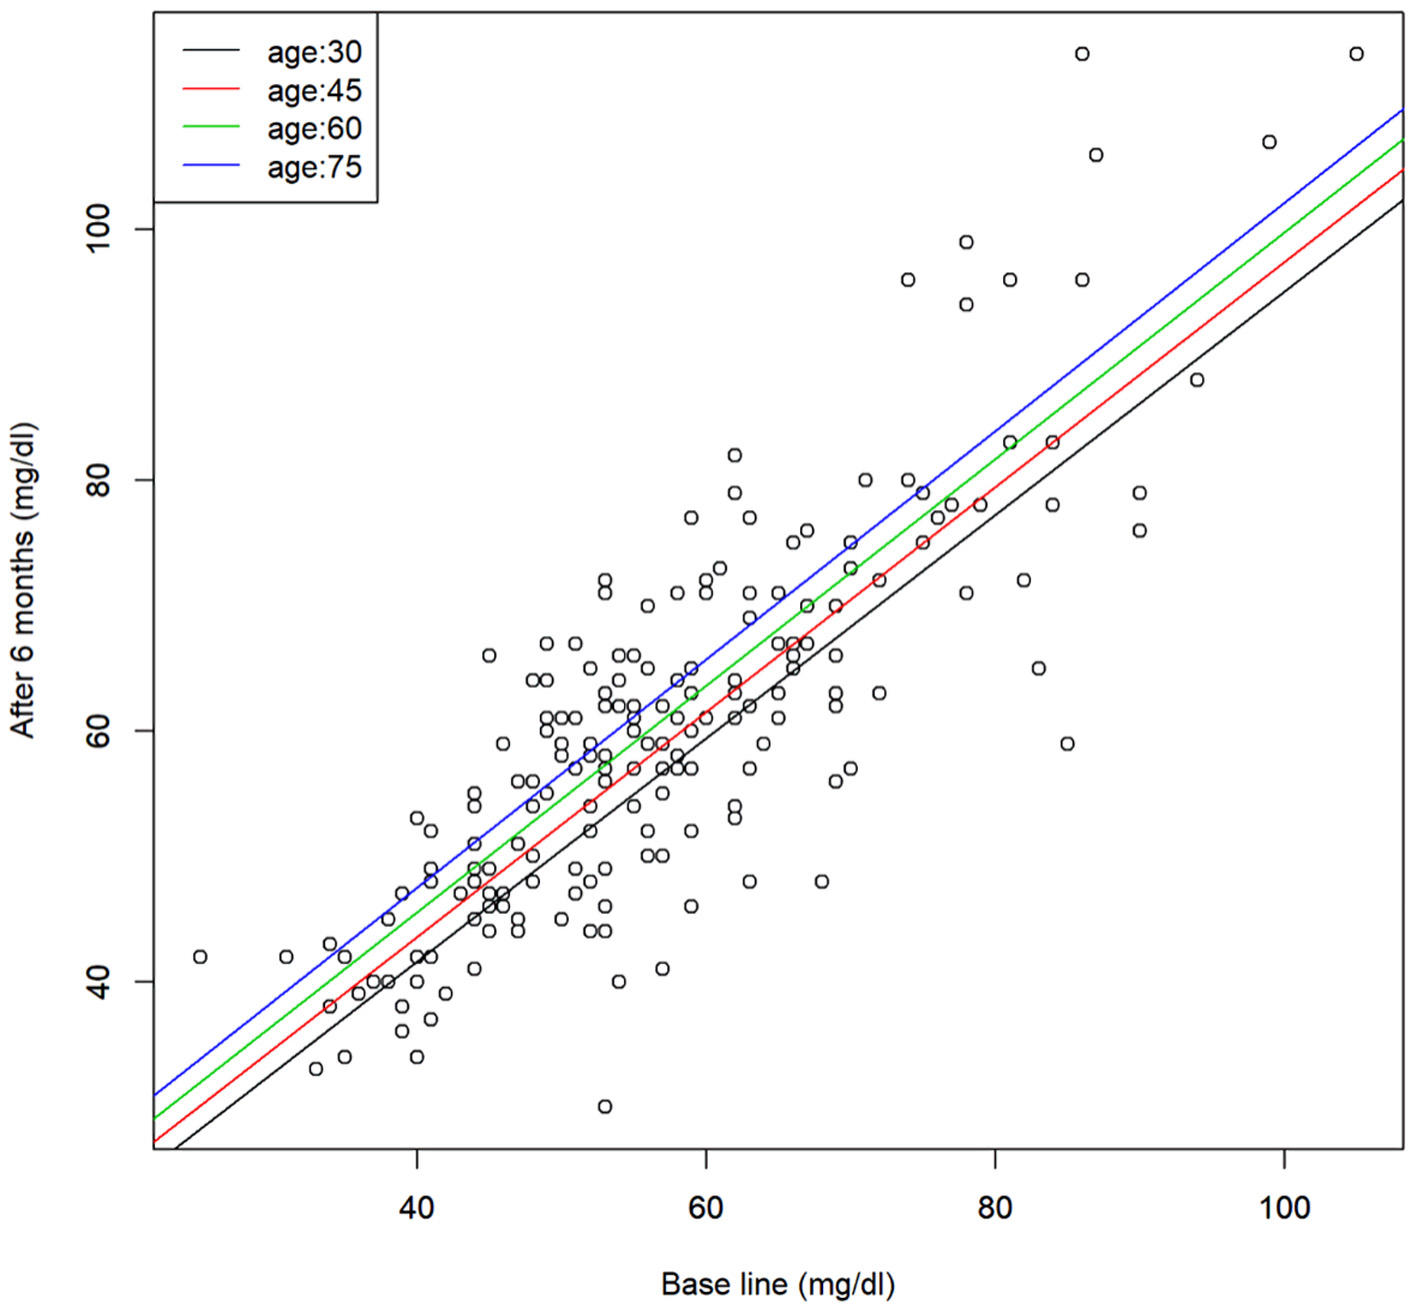
Figure 1. Scatter plot of the serum HDL-C levels before and after 6 months of SGLT2 inhibitor treatment and the regression line for representative age. Regression model, y = 1.26 + 0.9x + 0.13z (x: base line, y: after 6 months, and z: age). HDL-C: high-density lipoprotein cholesterol; SGLT2: sodium-glucose cotransporter 2.
Figure 2.
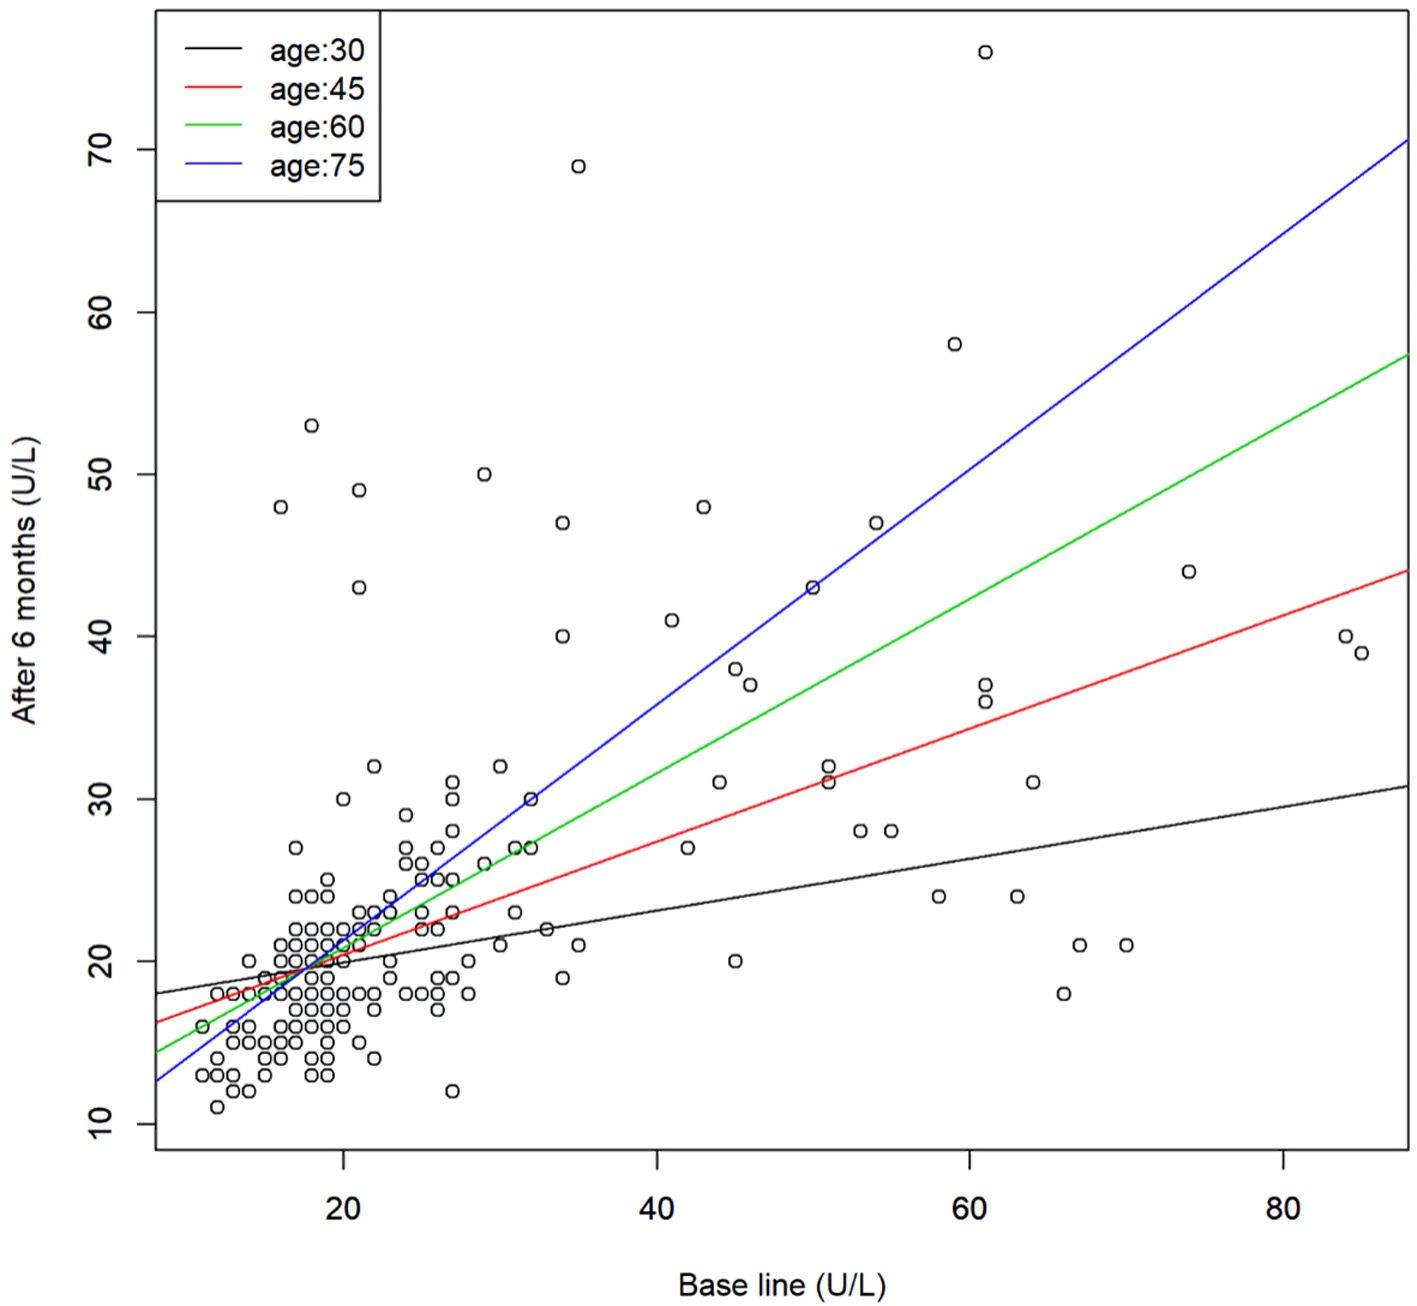
Figure 2. Scatter plot of the serum AST levels before and after 6 months of SGLT2 inhibitor treatment and the regression line for representative age. Regression model, y = 23.4 - 0.218x - 0.22z + 0.013xz (x: base line, y: after 6 months, and z: age). AST: aspartate aminotransferase; SGLT2: sodium-glucose cotransporter 2.
Figure 3.
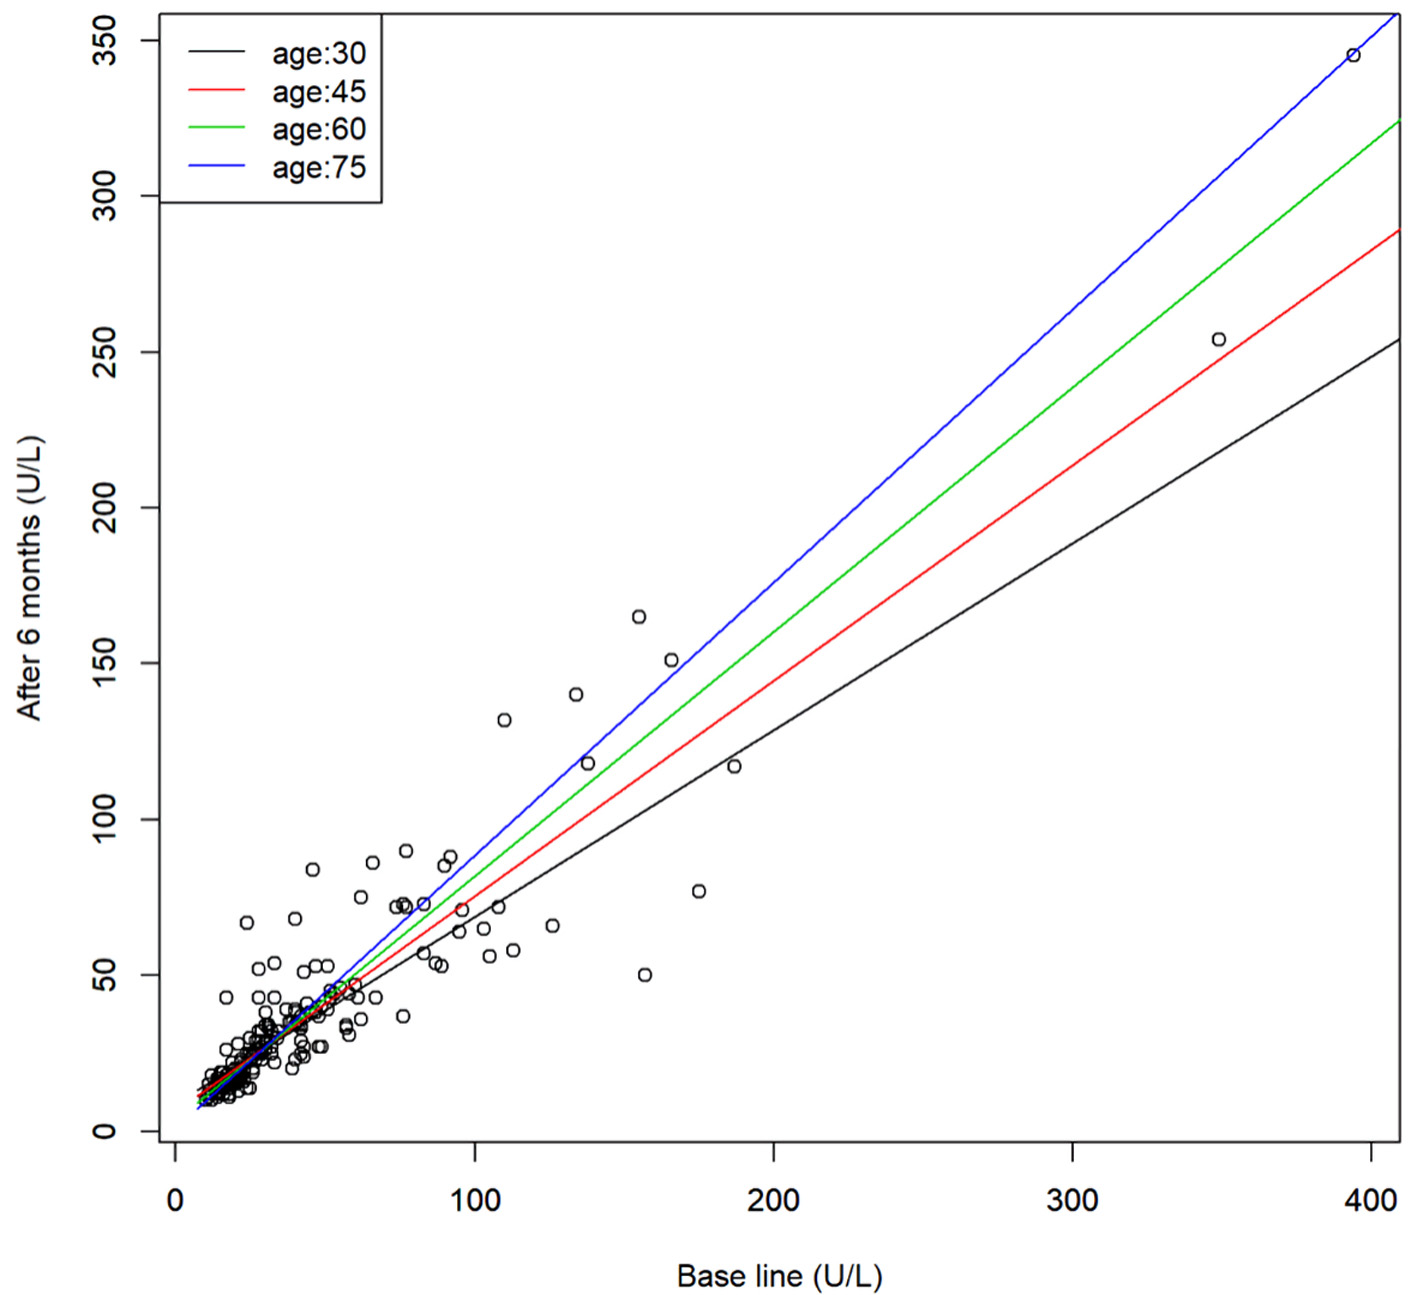
Figure 3. Scatter plot of the serum γ-GTP levels before and after 6 months of SGLT2 inhibitor treatment and the regression line for representative age. Regression model, y = 14.3 + 0.41x - 0.17z + 0.006xz (x: base line, y: after 6 months, and z: age). γ-GTP: γ-glutamyl transpeptidase; SGLT2: sodium-glucose cotransporter 2.

Tables

Table 1. Patient Characteristics at Baseline
 
Data are expressed as mean ± SD. DPP4: dipeptidyl peptidase-4; SD: standard deviation.
N199
Male/female142/57
Age (years)54 ± 11
Duration of diabetes (years)10 ± 7
Concomitant medication
  Therapy for diabetes, n
    DPP4-inhibitor160
    Biguanide95
    Sulfonylurea37
    Alpha-glucosidase inhibitor111
    Thiazolidinedione75
    Insulin30
  Lipid-modifying agents144
  Antihypertensive drugs69


Table 2. Effects of SGLT2 Inhibitors on Various Parameters (N = 199)
 
Baseline6 months
Data are expressed as mean ± SD. Paired t-test. *P < 0.05, **P < 0.01 vs. baseline (before administration). aThe results of the regression analysis show that the effects of SGLT2 inhibitors is influenced by the age (P < 0.05). bThe results of the regression analysis show that the effects of SGLT2 inhibitors are influenced by the age (P < 0.01). SGLT2: sodium-glucose cotransporter 2; BMI: body mass index; HbA1c: hemoglobin A1c; HDL-C: high-density lipoprotein cholesterol; LDL-C: low-density lipoprotein cholesterol; AST: aspartate aminotransferase; ALT: alanine aminotransferase; γ-GTP: γ-glutamyl transpeptidase; SD: standard deviation.
Body weight (kg)78.2 ± 17.875.7 ± 17.4**
BMI (kg/m2)28.2 ± 5.427.3 ± 5.2**
Visceral fat area (cm2)113 ± 49104 ± 48**
Glucose (mg/dL)114 ± 38105 ± 35**
HbA1c (%)7.0 ± 0.96.8 ± 0.8**
Insulin (µU/mL)12.4 ± 16.19.2 ± 8.4**
Total cholesterol (mg/dL)179 ± 33180 ± 34
HDL-C (mg/dL)57 ± 1460 ± 15**a
LDL-C (mg/dL)101 ± 28101 ± 28
LDL-C/HDL-C1.86 ± 0.671.78 ± 0.64*
Triglyceride (mg/dL)149 ± 90125 ± 89**
AST (U/L)25 ± 1423 ± 10**b
ALT (U/L)29 ± 2125 ± 16**
γ-GTP (U/L)42 ± 4736 ± 38**b
Uric acids (mg/dL)5.3 ± 1.34.6 ± 1.2**
Bone strength (%)89 ± 1591 ± 15**