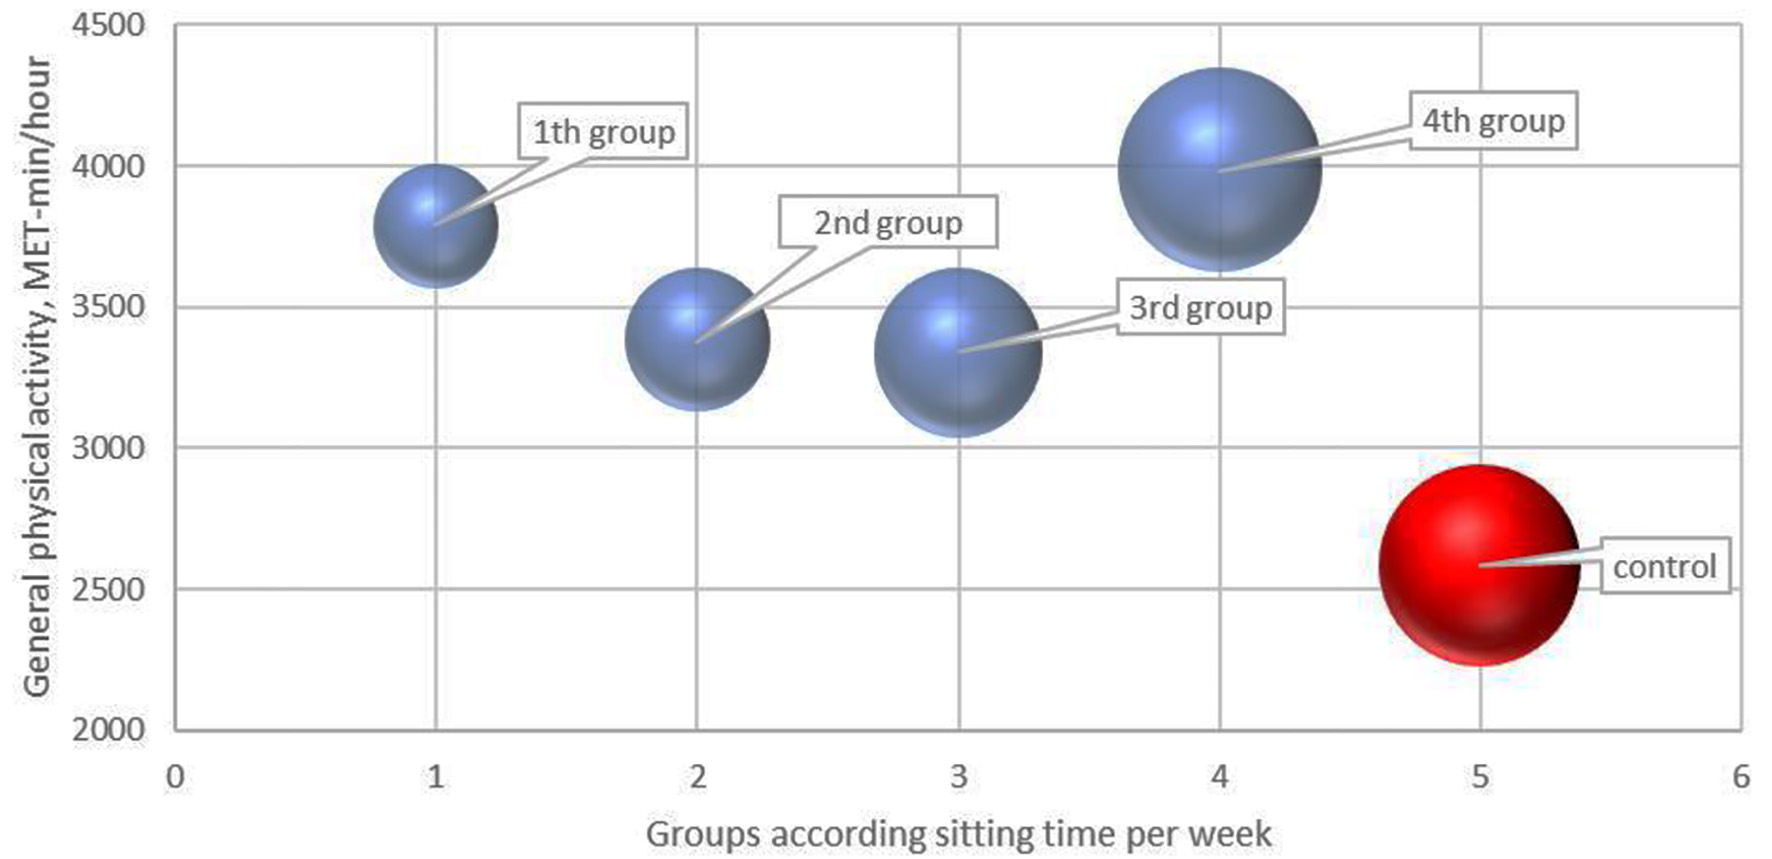
Figure 1. General physical activity levels and sitting time in the target and control groups. The size of the circle corresponds to sitting time in hours per week.
| Journal of Endocrinology and Metabolism, ISSN 1923-2861 print, 1923-287X online, Open Access |
| Article copyright, the authors; Journal compilation copyright, J Endocrinol Metab and Elmer Press Inc |
| Journal website https://www.jofem.org |
Original Article
Volume 12, Number 2, April 2022, pages 59-65
Sedentary Lifestyle Attenuates Positive Metabolic Effect of Regular Physical Exercise
Figures
Tables
| Parameters | First group (n = 53) | Second group (n = 29) | Third group (n = 47) | Fourth group (n = 40) | P value |
|---|---|---|---|---|---|
| Anthropometric parameters were compared across groups with ANOVA test after adjustment for age, sex and general physical activity. Sex was compared with Chi-square test. P value below 0.05 means the difference was statistically significant. BMI: body mass index; ANOVA: analysis of variance. | |||||
| Age, years | 31.00 (22.00 - 37.00) | 31.50 (26.00 - 38.80) | 29.00 (24.50 - 37.00) | 29.50 (23.00 - 36.50) | 0.353 |
| Male/female | 27/26 | 17/12 | 23/24 | 19/21 | 0.81 |
| Female, % | 26 (49.1%) | 12 (41.4%) | 24 (51%) | 21(52.5%) | |
| BMI, kg/m2 | 24.30 (22.50 - 27.00) | 23.10 (21.00 - 22.80) | 22.40 (20.3525.35) | 24.40 (22.20 - 30.90) | 0.135 |
| Fat tissue proportion, % | 25.6 (20.00 - 34.30) | 24.90 (13.80 - 22.70) | 25.40 (22.60 - 30.80) | 28.90 (19.30 - 39.30) | 0.261 |
| Muscle tissue proportion, % | 43.40 (28.00 - 39.70) | 42.40 (34.00 - 43.90) | 33.45 (28.40 - 36.85) | 27.90 (23.80 - 37.80) | 0.072 |
| Visceral fat proportion, % | 5.00 (4.00 - 8.00) | 4.00 (3.00 - 5.00) | 4.00 (3.00 - 6.00) | 9.90 (7.50 - 10.00) | 0.061 |
| Calipometry, mm | 13.00 (11.00 - 21.00) | 55.00 (10.00 - 18.00) | 18.00 (10.00 - 24.00) | 24.00 (10.00 - 30.00) | 0.125 |
| Waist circumference, cm | 73.00 (71.25 - 77.20) | 72.50 (68.50 - 76.25) | 72.00 (69.00 - 76.50) | 85.00 (75.75 - 89.50) | 0.086 |
| Hip circumference, cm | 93.75 (97.75 - 105.25) | 94.50 (90.50 - 96.00) | 97.50 (94.00 - 102.00) | 110.00 (97.50 - 118.00) | 0.071 |
| Parameter | First group | Second group | Third group | Fourth group | P value |
|---|---|---|---|---|---|
| The groups were compared with ANOVA test after adjustment for age, sex and general physical activity. P value below 0.05 means the difference was statistically significant. LDL: low-density lipoprotein; HDL: high-density lipoprotein; ANOVA: analysis of variance. | |||||
| Total cholesterol, mmol/L | 4.18 (0.84 - 4.91) | 4.66 (4.08 - 5.13) | 4.49 (3.95 - 5.17) | 4.99 (4.49 - 5.71) | 0.101 |
| Triglycerides, mmol/L | 1.18 (0.84 - 1.91) | 1.16 (0.83 - 1.78) | 1.08 (0.80 - 1.47) | 1.24 (1.01 - 1.83) | 0.130 |
| LDL-cholesterol, mmol/L | 2.07 (1.80 - 2.88) | 2.42 (2.05 - 3.37) | 2.57 (2.05 - 2.97) | 2.8 (1.9 - 3.3) | 0.097 |
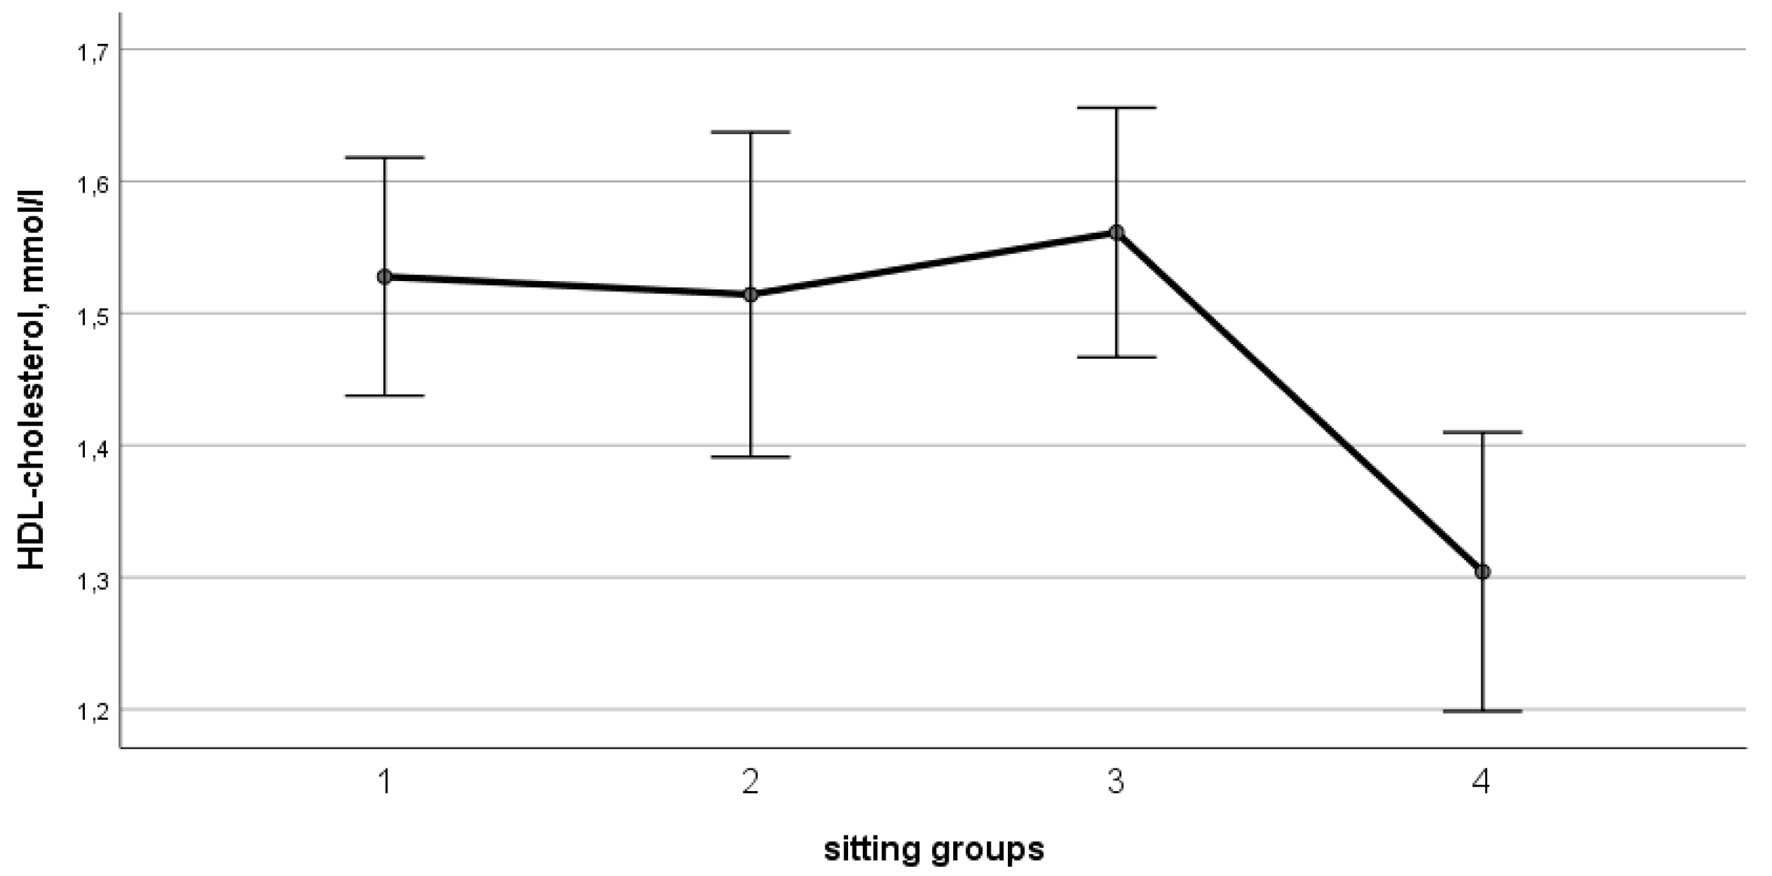
| HDL-cholesterol, mmol/L | 1.53 (1.27 - 1.67) | 1.50 (1.29 - 1.75) | 1.52 (1.13 - 1.68) | 1.37 (1.03 - 1.68) | 0.035 |
| Uric acid, µmol/L | 228.0 (183.0 - 281.0) | 250.0 (181.5 - 295.0) | 236.0 (190.0 - 265.0) | 256.0 (220.0 - 281.0) | 0.544 |
| Glucose, mmol/L | 4.27 (3.90 - 4.63) | 4.36 (4.34 - 5.26) | 4.46 (4.10 - 4.94) | 4.63 (4.24 - 5.26) | 0.001 |