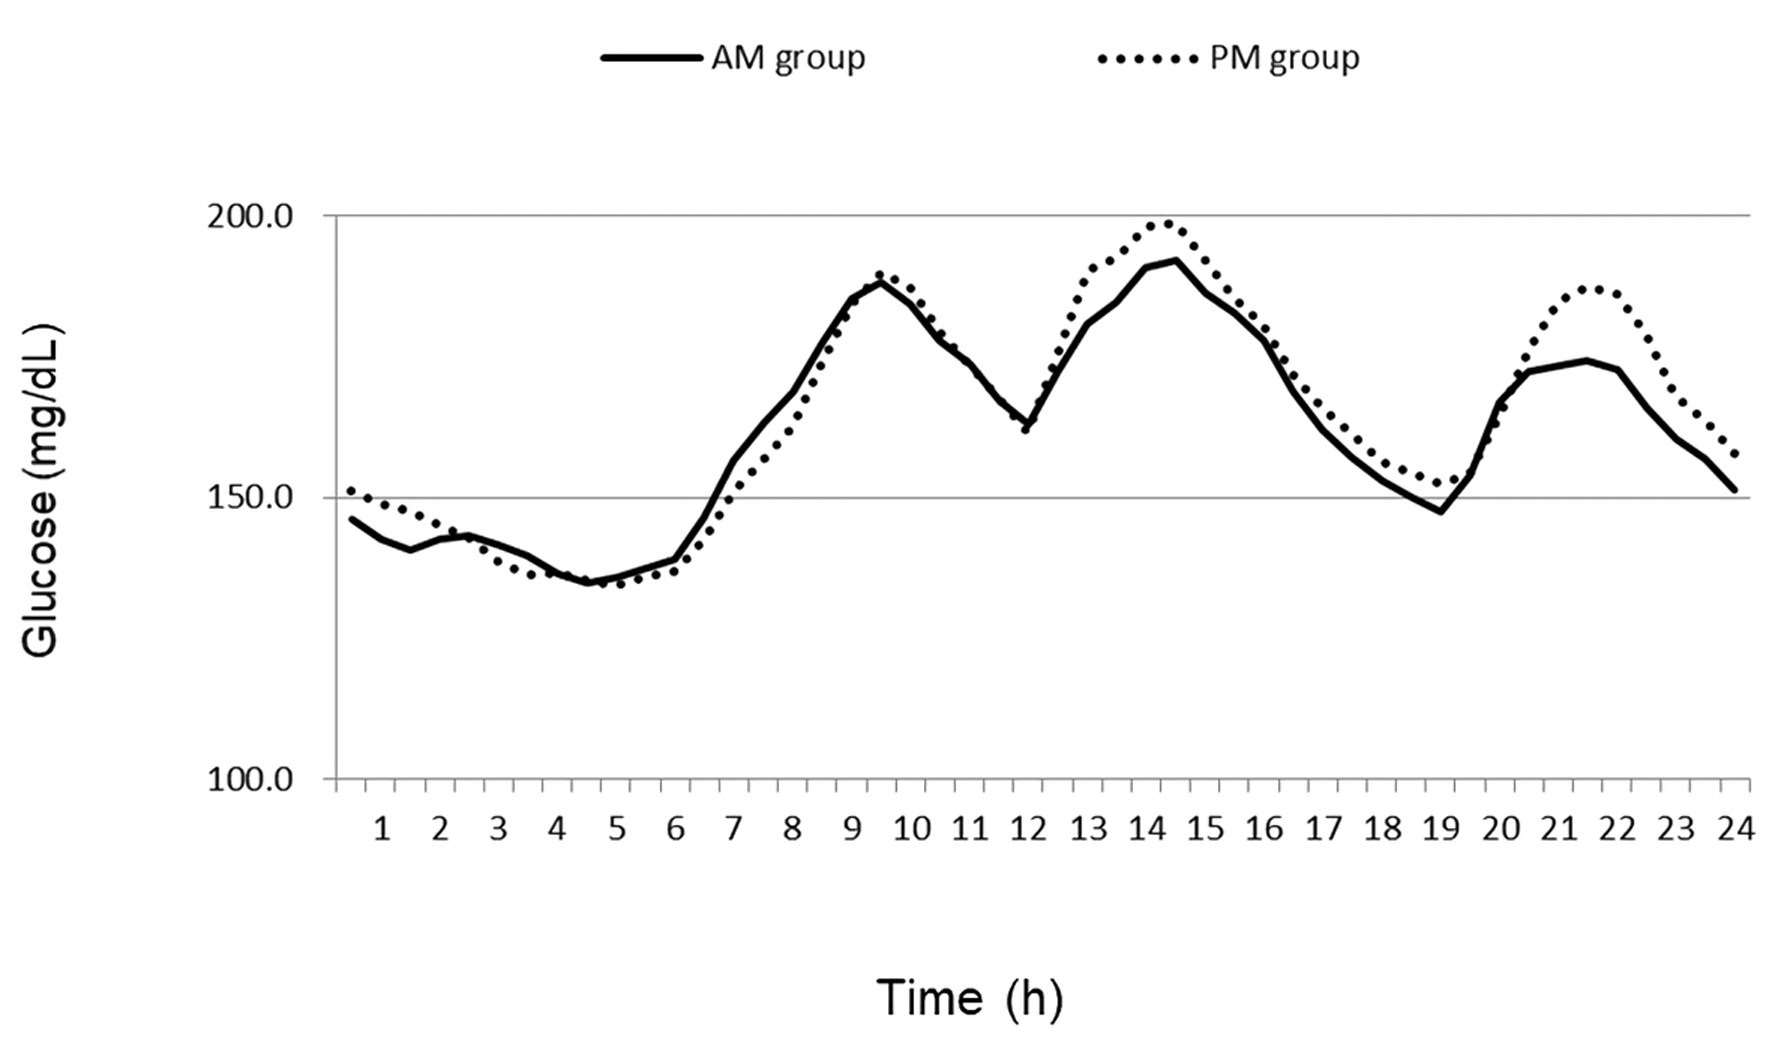
Figure 1. The average glucose levels in AM groups and PM groups.
| Journal of Endocrinology and Metabolism, ISSN 1923-2861 print, 1923-287X online, Open Access |
| Article copyright, the authors; Journal compilation copyright, J Endocrinol Metab and Elmer Press Inc |
| Journal website https://www.jofem.org |
Original Article
Volume 11, Number 1, February 2021, pages 8-13
Comparison of Metformin and Alogliptin Fixed-Dose Tablets Once a Morning Versus Once an Evening Using Continuous Glucose Monitoring (AMPM Study): An Open-Label Randomized Cross-Over Trial
Figures
Tables
| Variables | Mean (SD) |
|---|---|
| T2D: type 2 diabetes; BMI: body mass index; HbA1c: hemoglobin A1c; TC: total cholesterol; HDL-C: high-density lipoprotein cholesterol; TG: triglycerides; HLS: healthy lifestyle score; SD: standard deviation. | |
| Age, years | 57.2 (11.2) |
| BMI, kg/m2 | 26.1 (4.6) |
| HbA1c, % | 8.2 (1.5) |
| TC, mg/dL | 204 (26) |
| HDL-C, mg/dL | 52 (11) |
| TG, mg/dL | 166 (97) |
| Chronotype, % | |
| Morning type | 36.4 |
| Intermediate | 45.5 |
| Evening type | 18.2 |
| HLS, points (out of 8) | 3.8 (1.7) |
| Variables | AM group | PM group | P value | ||
|---|---|---|---|---|---|
| Baseline | Changes | Baseline | Changes | ||
| HbA1c: hemoglobin A1c; GA: glycated albumin; 1, 5-AG: 1, 5-anhydroglucitol; TC: total cholesterol; HDL-C: high-density lipoprotein cholesterol; TG: triglycerides; TC: total cholesterol; TG: triglycerides; TP: total protein; Alb: albumin; BUN: blood urea nitrogen; SCr: serum creatinine; UA: urinalysis; AST: aspartate aminotransferase; ALT: alanine aminotransferase; GGT: γ-glutamyl transferase; hs-CRP: high-sensitivity C-reactive protein. | |||||
| HbA1c, % | 7.9 (1.3) | -0.2 (0.4) | 8.0 (1.4) | -0.5 (0.7) | 0.307 |
| GA, % | 19.9 (4.8) | 0.1 (3.9) | 21.9 (5.6) | -2.1 (3.0) | 0.145 |
| 1, 5-AG, % | 7.5 (7.5) | 1.0 (1.9) | 9.3 (7.9) | -0.6 (3.9) | 0.224 |
| TC, mg/dL | 205 (39) | -7 (19) | 198 (35) | 3 (15) | 0.219 |
| HDL-C, mg/dL | 54 (10) | 2 (5) | 54 (12) | 2 (5) | 0.851 |
| TG, mg/dL | 148 (78) | -33 (74) | 145 (82) | -8 (87) | 0.466 |
| TP, mg/dL | 7.3 (0.4) | 0.1 (0.3) | 7.4 (0.3) | -0.1 (0.3) | 0.395 |
| Alb, mg/dL | 4.3 (0.2) | 0.0 (0.1) | 4.3 (0.2) | 0.1 (0.2) | 0.789 |
| BUN, mg/dL | 25.7 (28.8) | -7.9 (30.3) | 16.2 (3.3) | 1.3 (3.2) | 0.317 |
| SCr, mg/dL | 0.7 (0.1) | 0.0 (0.0) | 0.7 (0.2) | -0.0 (0.1) | 0.303 |
| UA, mg/dL | 5.1 (1.1) | 0.1 (1.0) | 5.1 (1.4) | 0.1 (0.5) | 0.960 |
| AST, IU/L | 27 (13) | 2 (11) | 24 (12) | 3 (5) | 0.794 |
| ALT, IU/L | 34 (29) | 1 (14) | 31 (27) | 1 (4) | 0.955 |
| GGT, IU/L | 37 (28) | 0 (6) | 38 (22) | 1 (7) | 0.726 |
| hs-CRP, mg/dL | 0.15 (0.22) | 0.04 (0.41) | 0.12 (0.09) | -0.02 (0.14) | 0.652 |
| Variables | Treatment time | Difference | P value | |
|---|---|---|---|---|
| AM group | PM group | |||
| AUC: area under curve; L/HBGI: low/high blood glucose indices. | ||||
| Mean | 165.7 (48.1) | 160.0 (44.1) | -5.6 (19.0) | 0.778 |
| Standard deviation | 43.5 (13.2) | 43.6 (10.3) | 0.0 (7.2) | 0.992 |
| Glucose time, % | ||||
| < 54 | 0.3 (0.9) | 0.1 (0.2) | -0.2 (0.8) | 0.533 |
| 54 - 70 | 0.3 (0.8) | 0.2 (0.4) | -0.1 (0.8) | 0.773 |
| 70 - 180 | 66.1 (27.8) | 70.6 (25.2) | 4.5 (14.1) | 0.696 |
| > 180 | 33.3 (28.0) | 29.1 (25.3) | -4.2 (14.3) | 0.714 |
| AUC, mg·h/dL | ||||
| Total | 528,705 (674,078) | 351,419 (584,807) | -177,285 (395,354) | 0.517 |
| 0:00 - 6:00 | 18,820 (40,621) | 15,126 (42,961) | -3,694 (6,850) | 0.838 |
| 6:00 - 12:00 | 27,829 (40,755) | 23,687 (43,604) | -4,142 (16,392) | 0.820 |
| 12:00 - 18:00 | 32,132 (40,347) | 28,699 (37,962) | -3,433 (29,372) | 0.839 |
| 18:00 - 24:00 | 37,391 (47,698) | 23,593 (36,091) | -13,798 (27,844) | 0.453 |
| HBGI | 7.8 (8.8) | 7.0 (7.9) | -0.8 (3.1) | 0.817 |
| LBGI | 0.3 (0.4) | 0.3 (0.2) | 0.0 (0.4) | 0.946 |
| Variables | HBGI | LBGI | ||||
|---|---|---|---|---|---|---|
| AM group | PM group | Difference (PM - AM) | AM group | PM group | Difference (PM - AM) | |
| BMI: body mass index; HLS: healthy lifestyle score; HbA1c: hemoglobin A1c; GA: glycated albumin; TC: total cholesterol; HDL-C: high-density lipoprotein cholesterol; TG: triglycerides; L/HBGI: low/high blood glucose indices. | ||||||
| Age | -0.284 | -0.449 | -0.347 | 0.309 | 0.121 | -0.222 |
| BMI | 0.180 | 0.388 | 0.489 | -0.117 | 0.126 | 0.180 |
| Male | 0.253 | 0.243 | -0.099 | 0.105 | -0.454 | -0.351 |
| Evening type in chronotype | -0.499 | -0.325 | 0.592 | 0.206 | 0.322 | -0.013 |
| HLS | -0.180 | -0.405 | -0.532 | -0.163 | 0.241 | 0.287 |
| HbA1c | -0.054 | -0.007 | 0.137 | -0.189 | 0.081 | 0.222 |
| GA | 0.163 | 0.078 | -0.268 | 0.036 | 0.108 | 0.027 |
| TC | 0.063 | 0.019 | -0.133 | -0.298 | -0.265 | 0.130 |
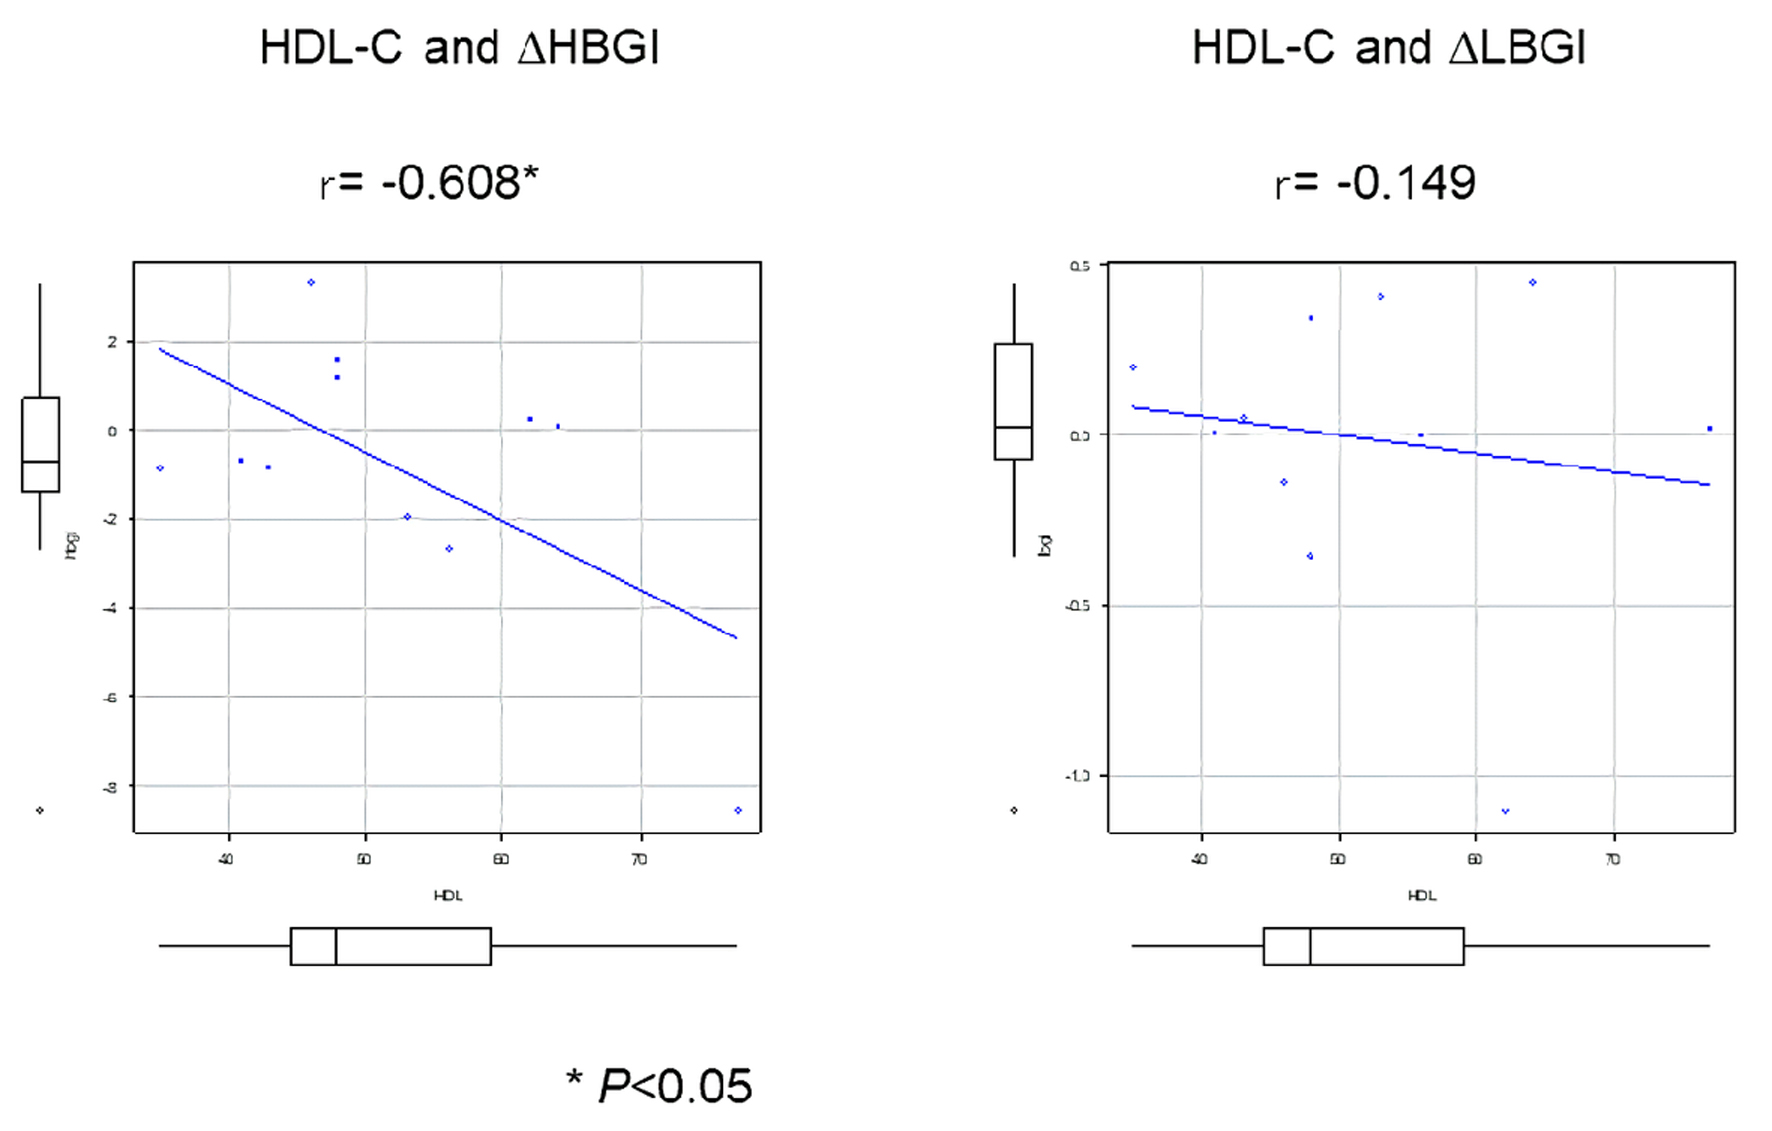
| HDL-C | 0.261 | 0.055 | -0.608 * | 0.161 | 0.003 | -0.149 |
| TG | -0.095 | -0.072 | 0.088 | -0.439 | -0.136 | 0.334 |