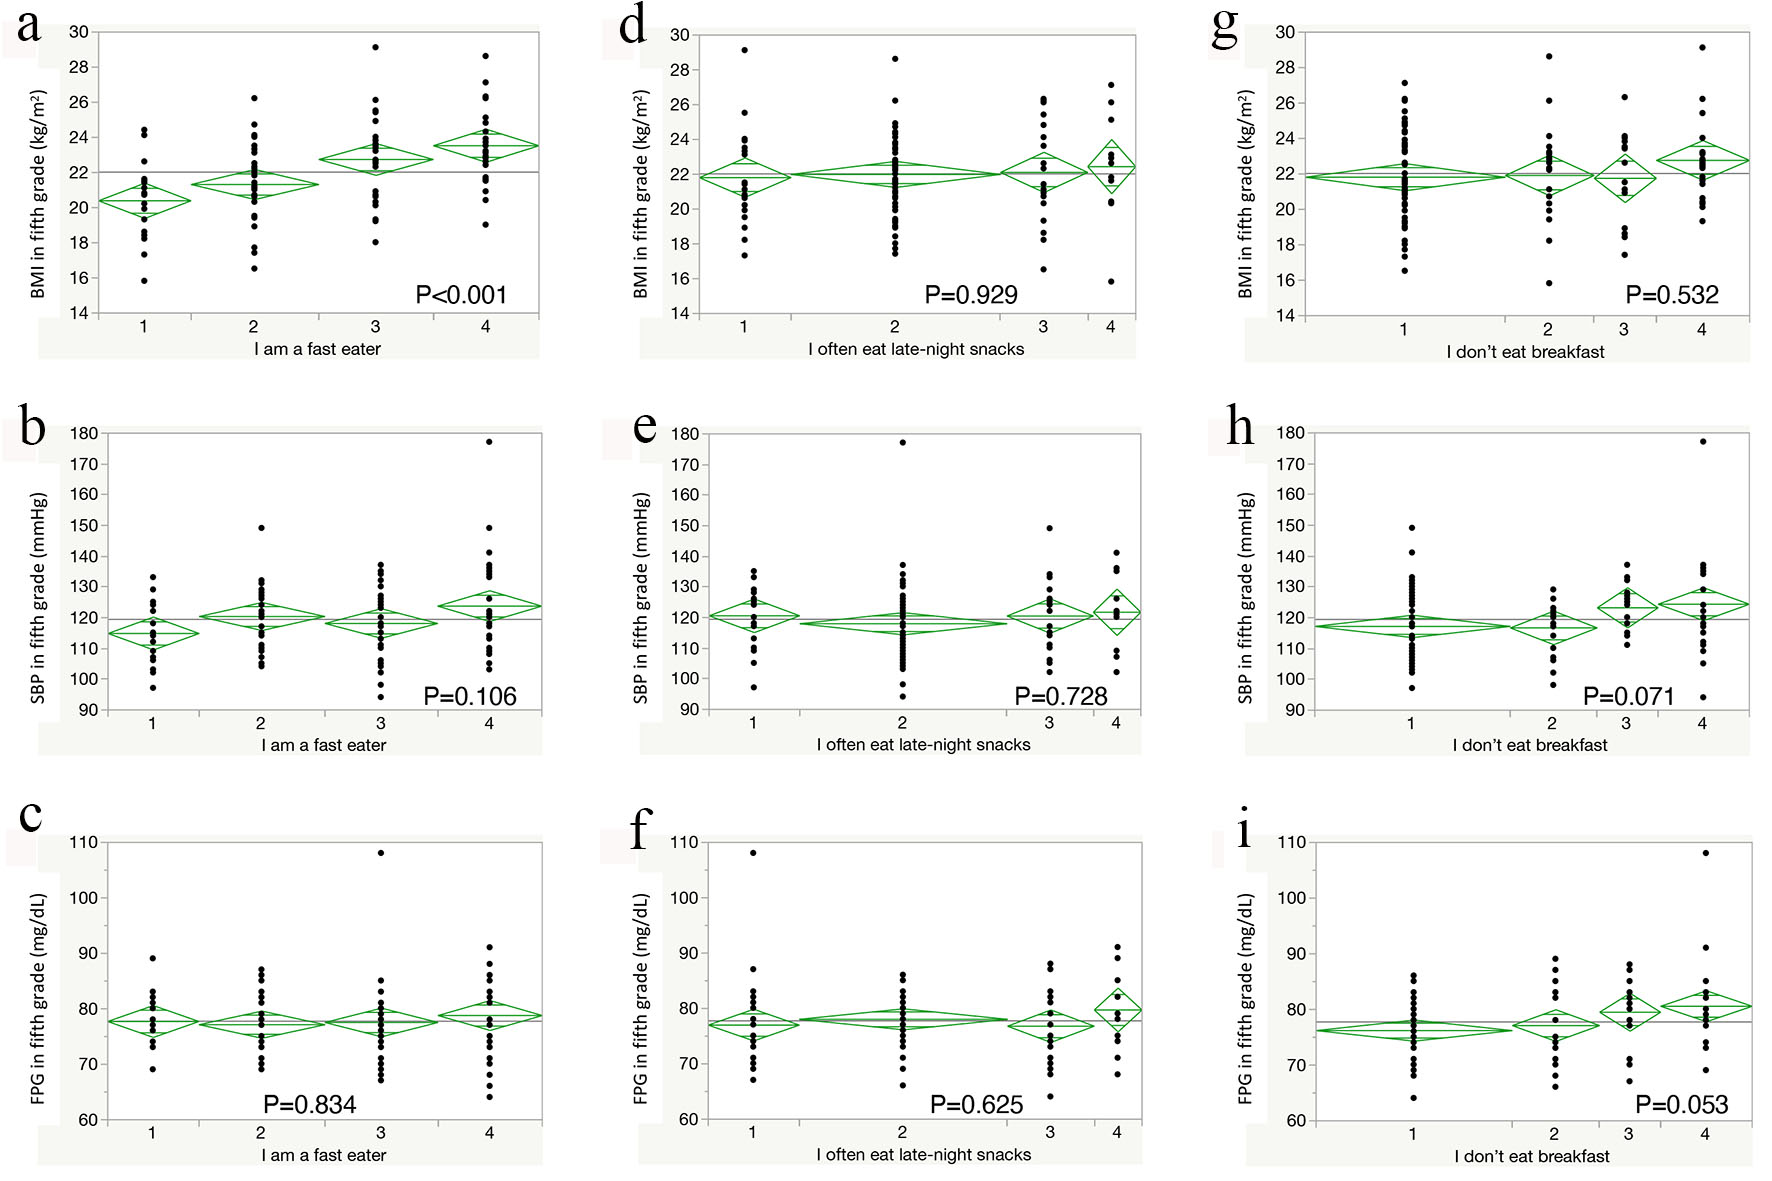
Journal of Endocrinology and Metabolism, ISSN 1923-2861 print, 1923-287X online, Open Access |
Article copyright, the authors; Journal compilation copyright, J Endocrinol Metab and Elmer Press Inc |
Journal website https://www.jofem.org |
Original Article
Volume 10, Number 5, October 2020, pages 131-139
Effects of Self-Awareness of Eating Behaviors and Differences in Daily Habits Among Japanese University Students on Changes in Weight and Metabolism
Figure
Tables
Total | Men | Women | P value | |
---|---|---|---|---|
Data are expressed as mean ± standard deviation or (%); differences with a value of P < 0.05 were considered statistically significant. BMI: body mass index. | ||||
Number | 100 | 63 | 37 | |
Age in fifth grade (years) | 25.4 ± 5.5 | 26.1 ± 5.5 | 24.3 ± 5.4 | 0.116 |
Height in fifth grade (cm) | 166.6 ± 8.7 | 171.4 ± 6.0 | 158.4 ± 6.1 | < 0.001 |
Weight in fifth grade (kg) | 61.5 ± 10.8 | 66.5 ± 8.3 | 52.8 ± 8.7 | < 0.001 |
BMI in fifth grade (kg/m2) | 22.0 ± 2.6 | 22.6 ± 2.3 | 21.0 ± 2.7 | 0.002 |
Systolic blood pressure in fifth grade (mm Hg) | 119.4 ± 12.5 | 123.3 ± 12.7 | 112.9 ± 9.3 | < 0.001 |
Diastolic blood pressure in fifth grade (mm Hg) | 71.9 ± 9.8 | 72.7 ± 10.6 | 70.5 ± 8.3 | 0.279 |
Fasting plasma glucose in fifth grade (mg/dL) | 77.8 ± 6.6 | 78 ± 5.9 | 77.4 ± 7.6 | 0.704 |
Fasting plasma insulin in fifth grade (μU/mL) | 6.3 ± 2.8 | 6.0 ± 2.7 | 6.8 ± 3.1 | 0.158 |
BMI in first grade (kg/m2) | 21.5 ± 2.5 | 22.1 ± 2.2 | 20.6 ± 2.7 | 0.003 |
Age difference between first and fifth grade (years) | 4.1 ± 1.0 | 4.1 ± 1.1 | 4.2 ± 0.7 | 0.494 |
Weight change from first to fifth grade (kg) | 1.3 ± 4.2 | 1.5 ± 4.4 | 0.9 ± 3.8 | 0.558 |
Daily self-weighing (%) | 33.0 | 27.0 | 43.2 | 0.124 |
Regular exercise (%) | 48.0 | 63.5 | 21.6 | < 0.001 |
Skipping breakfast (%) | 37.0 | 42.9 | 27.0 | 0.136 |
Frequent late-night eating (%) | 18.0 | 22.2 | 10.8 | 0.185 |
Excess soft drink consumption (%) | 23.0 | 28.6 | 13.5 | 0.093 |
Daily self-weighing | Regular exercise | Skipping breakfast | Frequent late-night eating | Excess soft drink consumption | ||||||
---|---|---|---|---|---|---|---|---|---|---|
Yes | No | Yes | No | Yes | No | Yes | No | Yes | No | |
Data are expressed as mean ± standard deviation or (%). Statistically significant data; *P < 0.05, **P < 0.005 vs. No. BMI: body mass index; SBP: systolic blood pressure; FPG: fasting plasma glucose. | ||||||||||
Number | 33 | 67 | 48 | 52 | 37 | 63 | 18 | 82 | 23 | 77 |
Age in fifth grade (years) | 26.5 ± 3.6 | 25.9 ± 6.2 | 24.5 ± 3.6 | 26.3 ± 6.8 | 25.4 ± 5.8 | 25.4 ± 5.4 | 24.3 ± 3.3 | 25.6 ± 5.9 | 23.3 ± 1.6* | 26.0 ± 6.1 |
BMI in fifth grade (kg/m2) | 22.5 ± 2.3 | 20.8 ± 2.7 | 22.7 ± 2.2* | 21.4 ± 2.8 | 22.0 ± 2.7 | 22.0 ± 2.5 | 21.9 ± 3.1 | 22.0 ± 2.5 | 22.6 ± 2.0 | 21.9 ± 2.7 |
SBP in fifth grade (mmHg) | 119.7 ± 15.1 | 119.3 ± 11.2 | 121.5 ± 10.5 | 117.5 ± 14.0 | 121.3 ± 14.1 | 118.3 ± 11.5 | 120.3 ± 11.9 | 119.2 ± 12.7 | 120.6 ± 11.2 | 119.1 ± 13.0 |
FPG in fifth grade (mg/dL) | 78.2 ± 5.3 | 77.6 ± 7.1 | 77.8 ± 5.7 | 77.7 ± 7.3 | 80.3 ± 7.0** | 76.3 ± 5.8 | 77.8 ± 6.4 | 77.7 ± 6.6 | 77.3±5.0 | 77.9 ± 7.0 |
BMI in first grade (kg/m2) | 22.1 ± 2.5 | 21.3 ± 2.5 | 22.1 ± 2.4* | 21.0 ± 2.5 | 21.2 ± 2.4 | 21.7 ± 2.5 | 21.2 ± 2.8 | 21.6 ± 2.4 | 21.9 ± 2.3 | 21.4 ± 2.6 |
Age difference between first and fifth grade (years) | 4.2 ± 0.8 | 4.1 ± 1.0 | 4.1 ± 0.9 | 4.2 ± 1.0 | 4.2 ± 1.1 | 4.1 ± 0.8 | 4.6 ± 1.0* | 4.0 ± 0.9 | 4.3 ± 0.7 | 4.1 ± 1.0 |
Weight change from first to fifth grade (kg) | 1.3 ± 5.0 | 1.2 ± 3.7 | 1.7 ± 4.6 | 0.9 ± 3.8 | 2.3 ± 4.6 | 0.7 ± 3.8 | 2.2 ± 4.4 | 1.1 ± 4.1 | 2.0 ± 4.3 | 1.1 ± 4.2 |
Men (%) | 51.5 | 68.7 | 83.3** | 44.2 | 73.0 | 57.1 | 77.8 | 59.8 | 78.3 | 58.4 |
Daily self-weighing (%) | 100.0** | 0.0 | 39.6 | 26.9 | 32.4 | 33.3 | 27.8 | 34.2 | 26.1 | 35.1 |
Regular exercise (%) | 57.6 | 43.3 | 100.0** | 0.0 | 51.4 | 46.0 | 66.7 | 42.9 | 73.9* | 40.3 |
Skipping breakfast (%) | 38.4 | 37.3 | 39.6 | 34.6 | 100.0** | 0.0 | 38.9 | 36.6 | 39.1 | 36.4 |
Frequent late-night eating (%) | 15.2 | 19.4 | 25.0 | 11.5 | 18.9 | 17.5 | 100.0** | 0.0 | 21.7 | 16.9 |
Excess soft drink consumption (%) | 18.2 | 25.4 | 35.4* | 11.5 | 24.3 | 22.2 | 27.8 | 22.0 | 100.0** | 0.0 |
Weight change from first to fifth grade | |||
---|---|---|---|
Weight gain (≥ 3%) | Weight gain (< 3%) | Weight loss | |
Data are expressed as mean ± standard deviation or (%). In the questionnaire on eating behaviors, only question items that had a significant difference are shown. Statistically significant data; *P < 0.05, **P < 0.005 vs. weight gain (< 3%); ***P < 0.05, ****P < 0.005 vs. weight loss. BMI: body mass index; SBP: systolic blood pressure; FPG: fasting plasma glucose. | |||
Number | 40 | 33 | 37 |
Age in fifth grade (years) | 26.0 ± 7.3 | 24.4 ± 3.6 | 25.4 ± 4.1 |
BMI in fifth grade (kg/m2) | 23.1 ± 2.6*, *** | 21.2 ± 2.4 | 21.4 ± 2.3 |
SBP in fifth grade (mm Hg) | 120.7 ± 15.1 | 116.8 ± 10.6 | 119.8 ± 10.6 |
FPG in fifth grade (mg/dL) | 79 ± 7.1 | 77.0 ± 6.8 | 76.9 ± 5.7 |
BMI in first grade (kg/m2) | 21.2 ± 2.3 | 21.0 ± 2.3 | 22.3 ± 2.7 |
Age difference between first and fifth grade (years) | 4.2 ± 0.8 | 4.2 ± 1.2 | 4.0 ± 1.0 |
Weight change from first to fifth grade (kg) | 5.1 ± 3.3**, **** | 0.8 ± 0.6**** | -2.5 ± 2.2 |
Men (%) | 67.5 | 47.8 | 67.6 |
Daily self-weighing (%) | 32.5 | 34.8 | 32.4 |
Regular exercise (%) | 52.5 | 43.5 | 46.0 |
Skipping breakfast (%) | 50.0 | 30.4 | 27.0 |
Frequent late-night eating (%) | 20.0 | 17.4 | 16.2 |
Excess soft drink consumption (%) | 35.0 | 13.0 | 16.2 |
External eating behavior | |||
I often eat socially | 1.33 ± 0.57*, **** | 1.96 ± 0.93 | 1.97 ± 0.93 |
Eating style | |||
I am a fast eater. | 2.88 ± 1.04* | 2.17 ± 1.15 | 2.38 ± 0.98 |
During meals, I end up having one mouthful after another. | 2.75 ± 0.87* | 1.96 ± 1.19 | 2.35 ± 0.98 |
Regularity of eating habits | |||
I often eat late-night snacks. | 2.45 ± 0.88*** | 2.26 ± 0.86 | 1.92 ± 0.89 |
I do not eat breakfast. | 2.55 ± 1.26*** | 1.83 ± 0.98 | 1.81 ± 1.13 |