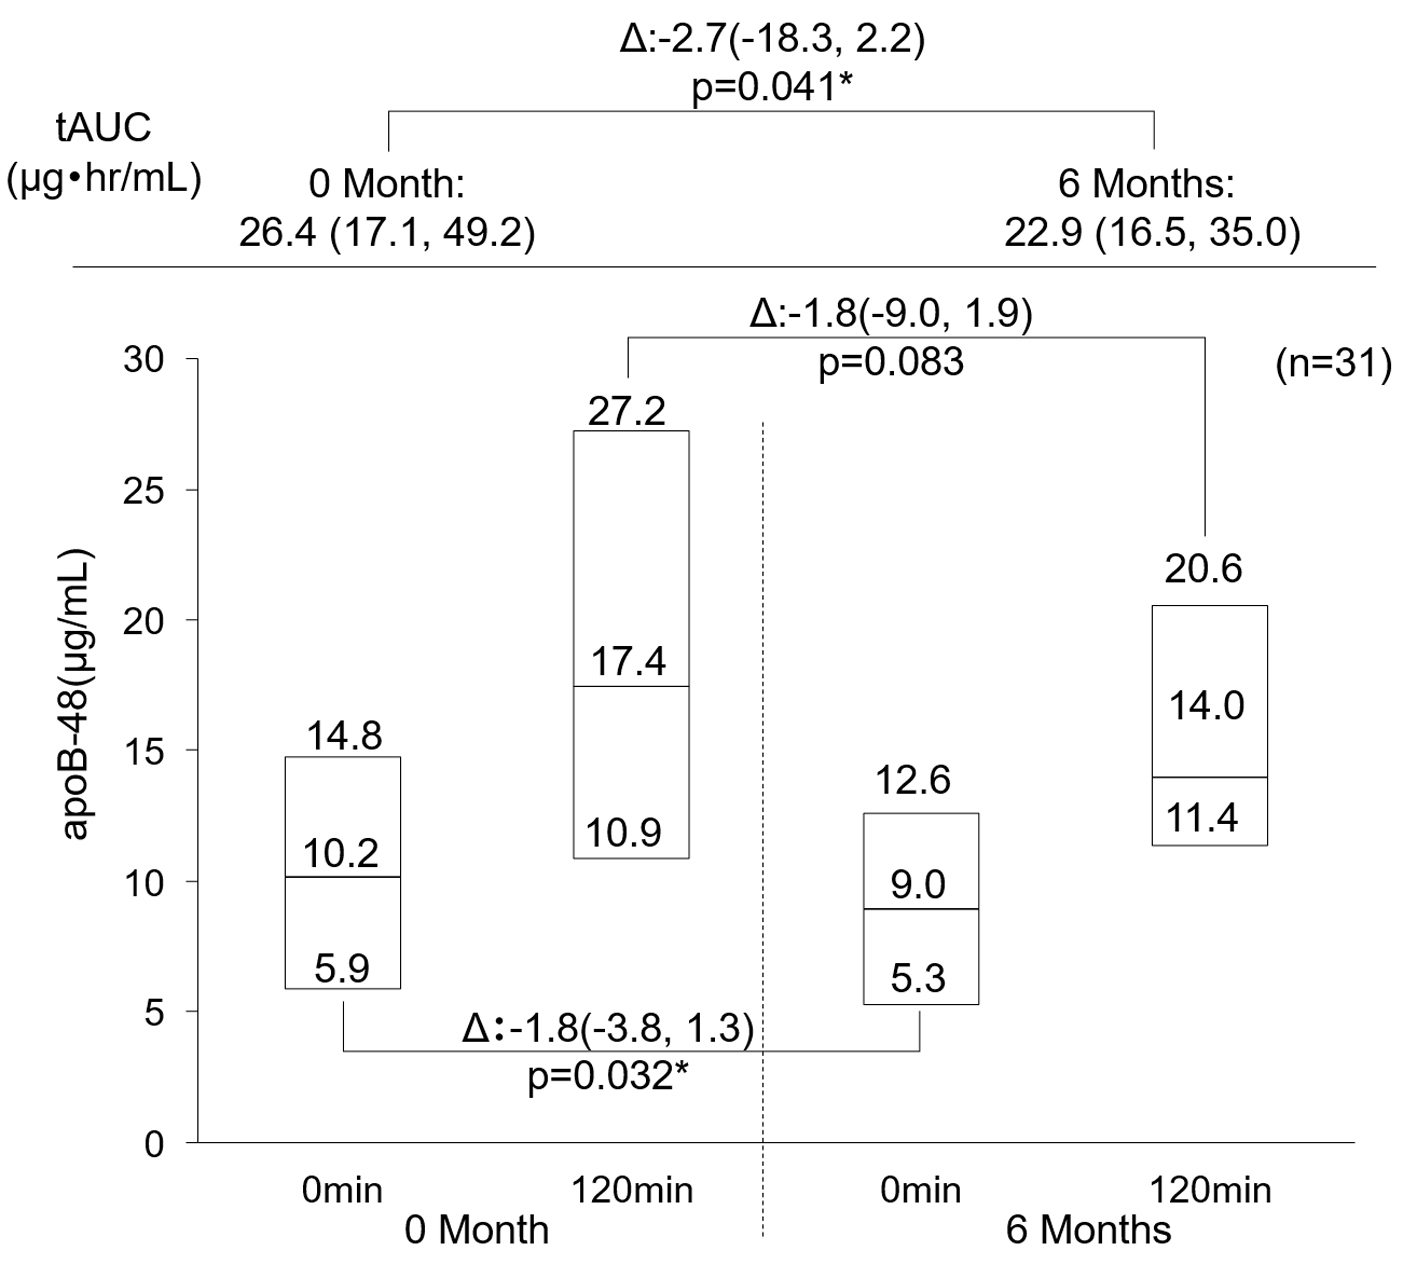
Figure 1. Change in apoB-48. Data are first, second, third quartile. *P < 0.05 Wilcoxon signed-rank test. apoB-48: apolipoprotein B-48.
| Journal of Endocrinology and Metabolism, ISSN 1923-2861 print, 1923-287X online, Open Access |
| Article copyright, the authors; Journal compilation copyright, J Endocrinol Metab and Elmer Press Inc |
| Journal website https://www.jofem.org |
Original Article
Volume 10, Number 3-4, August 2020, pages 79-88
The Effects of Teneligliptin on Lipid Profile: A Prospective Study for Comparison of Biomarkers Before and After a Meal
Figures
Tables
| Data are presented as number (%) or mean ± SD. HbA1c: hemoglobin A1c; SGLT-2: sodium-glucose linked transporter-2; GLP-1: glucagon-like peptide-1; BMI: body mass index; SD: standard deviation. | |
| N | 31 |
| Age (years) | 55.2 ± 7.0 |
| Gender | Male/female: 27 (87.1%)/4 (12.9%) |
| Height (cm) | 167.9 ± 6.6 |
| Weight (kg) | 72.3 ± 11.9 |
| BMI (kg/m2) | 25.5 ± 3.2 |
| Duration of disease (years) | 7.3 ± 4.1 |
| HbA1c (%) | 8.26 ± 1.25 |
| Diabetic retinopathy | |
| Diabetic retinopathy | 4 (12.9%) |
| Simple retinopathy | 2 (6.5%) |
| Advanced proliferative retinopathy | 2 (6.5%) |
| Renal stage | 1/2/3: 27 (87.1%)/3 (9.7%)/1 (3.2%) |
| Antidiabetic agent | |
| Sulfonylurea | 0 (0%) |
| Biguanide | 7 (22.6%) |
| Thiazolidine | 0 (0%) |
| α-glucosidase inhibitors | 2 (6.5%) |
| SGLT-2-inhibitors | 0 (0%) |
| GLP-1-agonist | 0 (0%) |
| Insulin | 0 (0%) |
| Antidyslipidemic drug | |
| Statin | 12 (38.7%) |
| Ezetimibe | 1 (3.2%) |
| Fibrate | 0 (0%) |
| Eicosapentaenoic acid | 0 (0%) |
| 0 months | 6 months | P | |
|---|---|---|---|
| Data are median (first quartile, third quartile). *P < 0.05 Wilcoxon signed-rank test. iAUC: incremental area under the curve; tAUC: total area under the curve; TC: total cholesterol; HDL-C: high-density lipoprotein cholesterol; LDL-C: low-density lipoprotein cholesterol; LDL-FC: low-density lipoprotein free cholesterol; TG: triglyceride. | |||
| TC | |||
| 0 min (mg/dL) | 198.0 (179.5, 222.0) | 187.0 (171.5, 206.0) | 0.245 |
| 120 min (mg/dL) | 183.0 (170, 204.5) | 180.0 (162.0, 198.0) | 0.91 |
| iAUC (mg·h/dL) | -11.0 (-15.5, -7.0) | -8 (-13.0, -4.0) | 0.003* |
| tAUC (mg·h/dL) | 380.0 (347.0, 422.5) | 366 (328.0, 404.5) | 0.487 |
| HDL-C | |||
| 0 min (mg/dL) | 55.0 (44.5, 64.0) | 51.0 (44.0, 60.5) | 0.009* |
| 120 min (mg/dL) | 51.0 (41.0, 59.5) | 49.0 (42.0, 58.5) | 0.072 |
| iAUC (mg·h/dL) | -3.0 (-4.0, -2.0) | -2.0 (-3.0, -1.0) | 0.023* |
| tAUC (mg·h/dL) | 105.0 (85.5, 124.0) | 100 (85.5, 117.5) | 0.024* |
| LDL-C | |||
| 0 min (mg/dL) | 120.0 (99.5, 136.0) | 110.0 (100.5, 127.5) | 0.629 |
| 120 min (mg/dL) | 112.0 (91.5, 125.5) | 105.0 (94.5, 125.0) | 0.705 |
| iAUC (mg·h/dL) | -7.0 (-10.5, -4.5) | -5.0 (-7, -3.5) | 0.004* |
| tAUC (mg·h/dL) | 236.0 (191.5, 262.5) | 214 (194.5, 253.5) | 0.984 |
| LDL-FC | |||
| 0 min (mg/dL) | 116.7 (94.8, 136.5) | 113.7 (98.9, 125.8) | 0.422 |
| 120 min (mg/dL) | 106.6 (82.8, 122.2) | 98.8 (83.4, 116.8) | 0.393 |
| iAUC (mg·h/dL) | -12.3 (-16.4, -7.1) | -10.6 (-16.2, -7.6) | 0.586 |
| tAUC (mg·h/dL) | 222.2 (179.8, 257.5) | 213.4 (181.3, 237.3) | 0.678 |
| TG | |||
| 0 min (mg/dL) | 101.0 (75.5, 161.0) | 115.0 (82.5, 167.0) | 0.164 |
| 120 min (mg/dL) | 142.0 (107.5, 169.5) | 138.0 (106.5, 214.5) | 0.236 |
| iAUC (mg·h/dL) | 12.0 (0.5, 35.0) | 11.0 (3.5, 44.0) | 0.168 |
| tAUC (mg·h/dL) | 226.0 (186.5, 325.0) | 254 (191.0, 372.0) | 0.153 |
| Item | Model 1 | Model 2 | ||||||
|---|---|---|---|---|---|---|---|---|
| Standard partial regression coefficient | Partial regression coefficient | Standard error | P | Standard partial regression coefficient | Partial regression coefficient | Standard error | P | |
| The values of explanatory variables are baseline values. Model 1: The case where all explanatory variables were adopted. Model 2: The case with the stepwise method using the Akaike information criterion as a sensitivity analysis. apoB-48: apolipoprotein B; HbA1c: hemoglobin A1c; BMI: body mass index; LDL-C: low-density lipoprotein cholesterol; AUC: area under the curve; tAUC: total area under the curve. *P < 0.05 multiple regression analysis. | ||||||||
| Age | 0.047 | 0.010 | 0.021 | 0.633 | ||||
| Gender (male) | 0.195 | 0.900 | 0.377 | 0.027* | 0.196 | 0.902 | 0.307 | 0.007* |
| Duration of disease | -0.116 | -0.044 | 0.033 | 0.203 | ||||
| Statin | -0.046 | -0.147 | 0.316 | 0.648 | ||||
| ApoB-48 (AUC) | -0.959 | -0.594 | 0.045 | < 0.001* | -0.958 | -0.593 | 0.040 | < 0.001* |
| HbA1c | -0.017 | -0.021 | 0.167 | 0.900 | ||||
| BMI | -0.045 | -0.022 | 0.041 | 0.593 | ||||
| Fasting blood sugar | 0.118 | 0.005 | 0.006 | 0.402 | 0.107 | 0.005 | 0.003 | 0.124 |
| Fasting insulin | 0.089 | 0.042 | 0.037 | 0.271 | ||||
| LDL-C | -0.103 | -0.006 | 0.005 | 0.265 | ||||