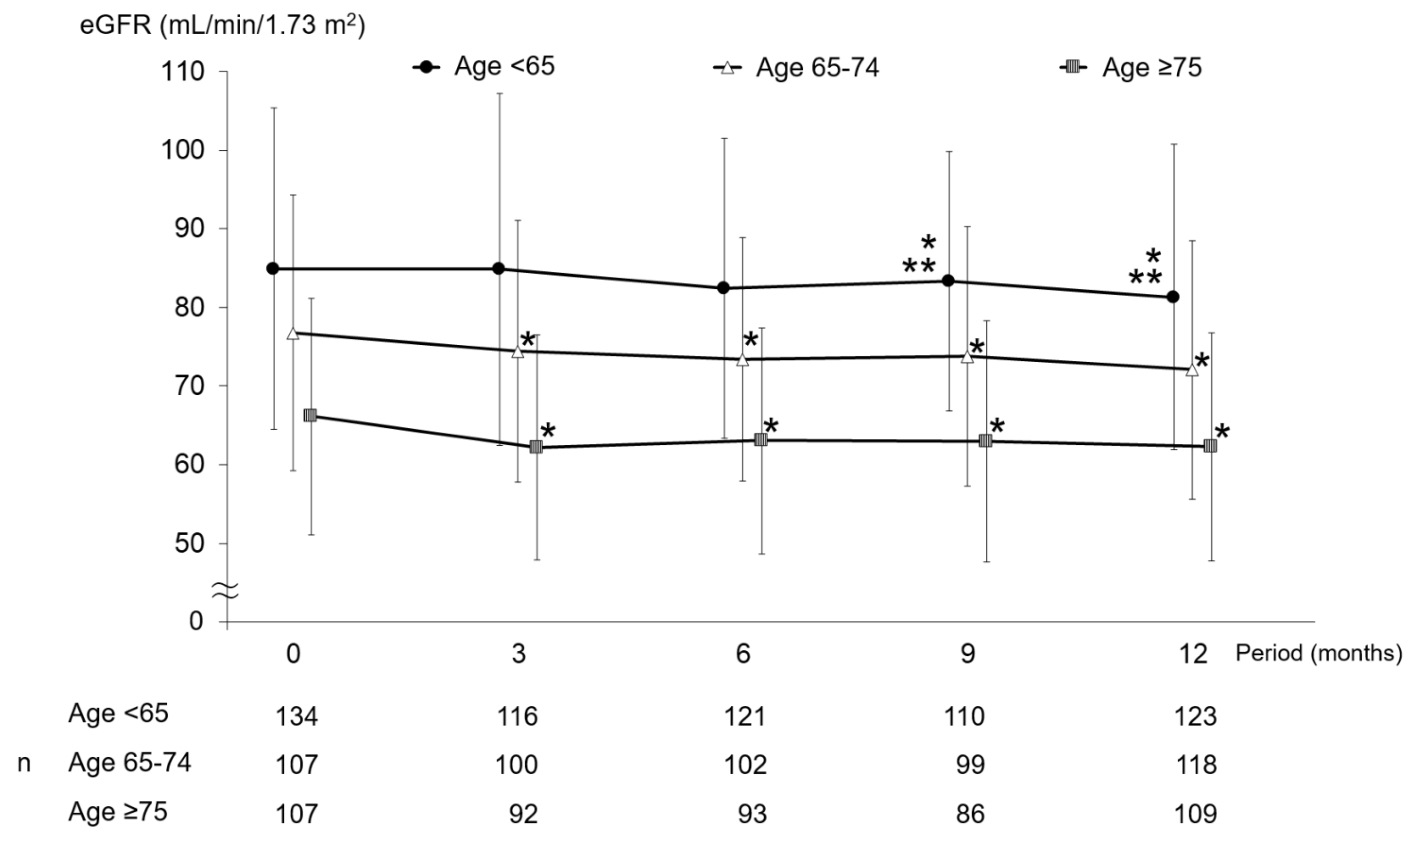
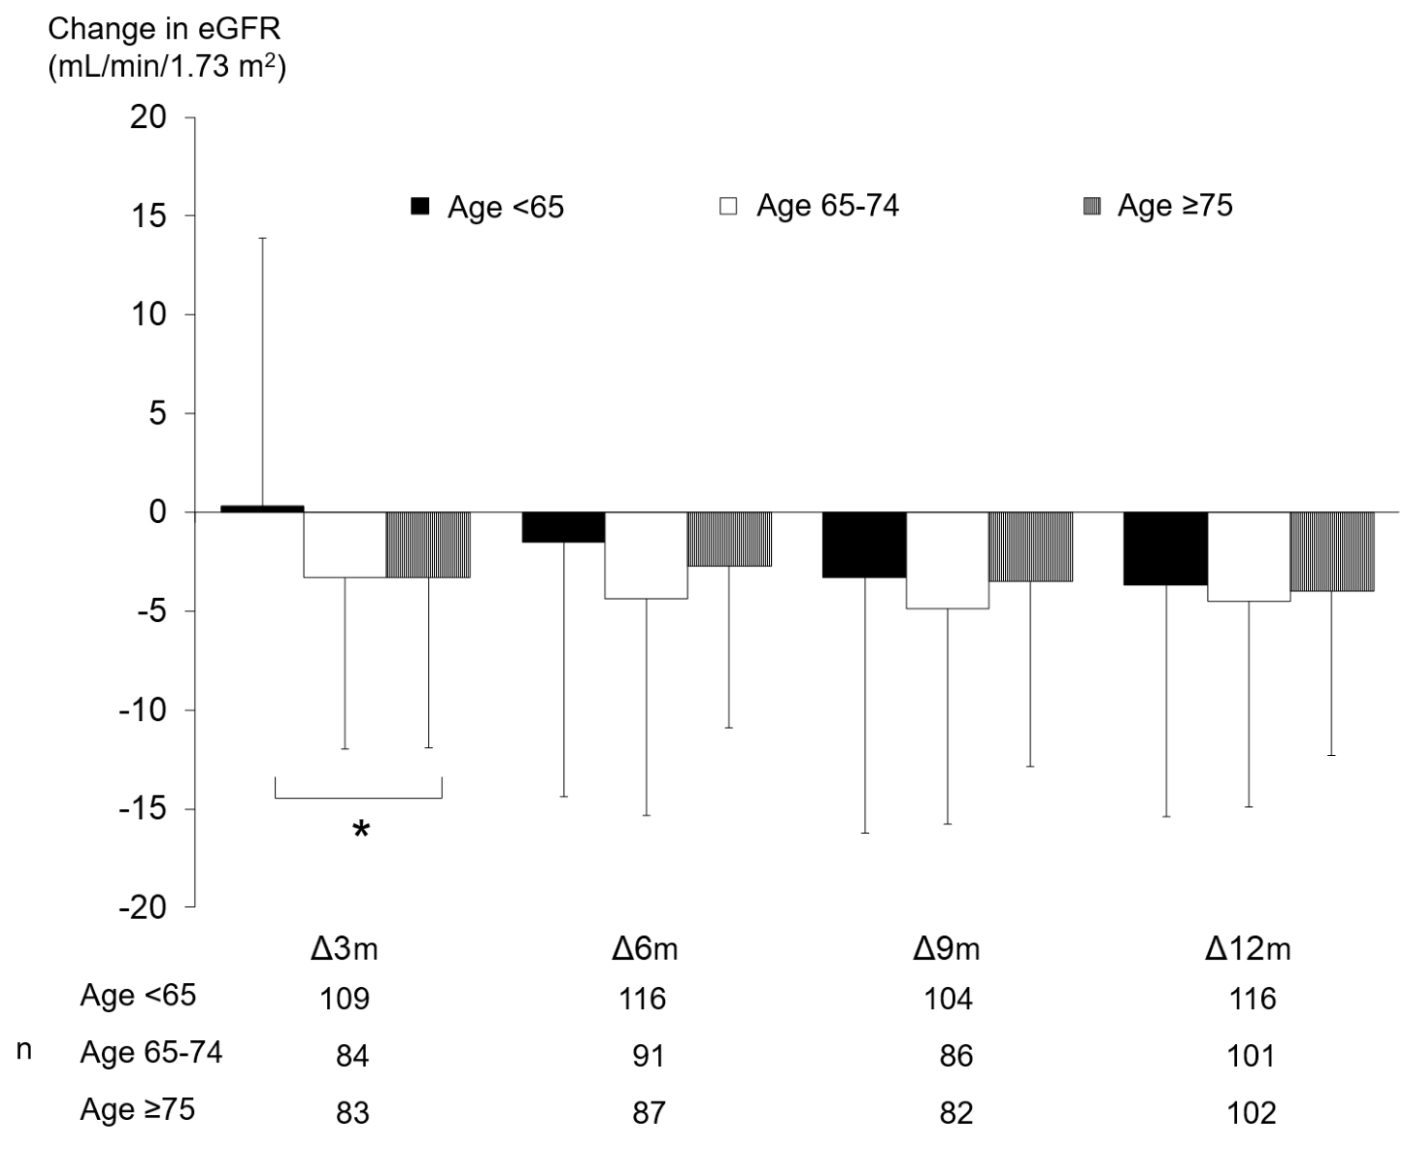
Figure 1. Changes in eGFR. *P < 0.05 versus month 0 paired t-test; **P < 0.05 versus month 3 paired t-test. eGFR: estimated glomerular filtration rate.
| Journal of Endocrinology and Metabolism, ISSN 1923-2861 print, 1923-287X online, Open Access |
| Article copyright, the authors; Journal compilation copyright, J Endocrinol Metab and Elmer Press Inc |
| Journal website http://www.jofem.org |
Original Article
Volume 10, Number 1, February 2020, pages 23-29
Evaluation of Age-Specific Efficacy and Safety of 12 Months of Sitagliptin Therapy Administered by Non-Diabetologists
Figures
Tables
| Age < 65 (n = 148) | Age 65 - 74 (n = 134) | Age ≥ 75 (n = 127) | P | Unknown | |||
|---|---|---|---|---|---|---|---|
| Age < 65 | Age 65 - 74 | Age ≥ 75 | |||||
| ANOVA: analysis of variance. *P < 0.05 Chi-squared test; **P < 0.05 ANOVA. | |||||||
| Age | 56.2 ± 7.3 | 69.6 ± 2.8 | 80.0 ± 4.4 | < 0.001** | 0 (0%) | 0 (0%) | 0 (0%) |
| Men/women | 89 (60.1%)/56 (37.8%) | 78 (58.2%)/54 (40.3%) | 56 (44.1%)/66 (52%) | 0.061 | 3 (2%) | 2 (1.5%) | 5 (3.9%) |
| Disease duration | 7.5 ± 5.7 | 8.8 ± 6.8 | 11.8 ± 9.1 | 0.001** | 60 (40.5%) | 52 (38.8%) | 57 (44.9%) |
| Diabetic retinopathy | 11 (7.4%) | 12 (9%) | 9 (7.1%) | 0.856 | 29 (19.6%) | 30 (22.4%) | 31 (24.4%) |
| Diabetic neuropathy | 10 (6.8%) | 11 (8.2%) | 9 (7.1%) | 0.690 | 13 (8.8%) | 9 (6.7%) | 15 (11.8%) |
| Diabetic nephropathy | 24 (16.2%) | 16 (11.9%) | 27 (21.3%) | 0.073 | 8 (5.4%) | 11 (8.2%) | 15 (11.8%) |
| Cerebrovascular disorders | 5 (3.4%) | 17 (12.7%) | 19 (15%) | 0.013* | 3 (2%) | 2 (1.5%) | 4 (3.1%) |
| Myocardial infarction | 2 (1.4%) | 7 (5.2%) | 5 (3.9%) | 0.380 | 3 (2%) | 2 (1.5%) | 4 (3.1%) |
| Angina pectoris | 7 (4.7%) | 12 (9%) | 10 (7.9%) | 0.585 | 4 (2.7%) | 2 (1.5%) | 4 (3.1%) |
| Arteriosclerosis obliterans | 2 (1.4%) | 5 (3.7%) | 3 (2.4%) | 0.535 | 4 (2.7%) | 3 (2.2%) | 6 (4.7%) |
| Hypertension | 92 (62.2%) | 100 (74.6%) | 103 (81.1%) | 0.001* | 0 (0%) | 3 (2.2%) | 1 (0.8%) |
| Dyslipidemia | 109 (73.6%) | 91 (67.9%) | 89 (70.1%) | 0.749 | 2 (1.4%) | 4 (3%) | 2 (1.6%) |
| Hepatic steatosis | 39 (26.4%) | 28 (20.9%) | 21 (16.5%) | 0.044* | 39 (26.4%) | 43 (32.1%) | 27 (21.3%) |
| Smoking history | 37 (25%) | 38 (28.4%) | 16 (12.6%) | 0.032* | 19 (12.8%) | 15 (11.2%) | 17 (13.4%) |
| Drinking history | 55 (37.2%) | 45 (33.6%) | 36 (28.3%) | 0.330 | 19 (12.8%) | 13 (9.7%) | 21 (16.5%) |
| Time | Age < 65 | Age 65 - 74 | Age ≥ 75 | P | |
|---|---|---|---|---|---|
| N/A: not available; m: months. *P < 0.05 Chi-squared test. | |||||
| Dose of sitagliptin (mg/day) | Before | N/A | N/A | N/A | N/A |
| 0 m | 51.2 ± 15.0 | 49.2 ± 12.7 | 47.2 ± 14.7 | 0.068 | |
| 12 m | 53.4 ± 15.4 | 52.7 ± 15.8 | 49.7 ± 15.1 | 0.119 | |
| Sulfonylurea | Before | 54 (36.5%) | 48 (35.8%) | 43 (33.9%) | 0.897 |
| 0 m | 51 (34.5%) | 42 (31.3%) | 38 (29.9%) | 0.708 | |
| 12 m | 54 (36.5%) | 41 (30.6%) | 45 (35.4%) | 0.548 | |
| Biguanide | Before | 38 (25.7%) | 27 (20.1%) | 24 (18.9%) | 0.342 |
| 0 m | 42 (28.4%) | 27 (20.1%) | 24 (18.9%) | 0.119 | |
| 12 m | 50 (33.8%) | 34 (25.4%) | 23 (18.1%) | 0.013* | |
| Thiazolidine | Before | 27 (18.2%) | 32 (23.9%) | 20 (15.7%) | 0.230 |
| 0 m | 19 (12.8%) | 21 (15.7%) | 13 (10.2%) | 0.425 | |
| 12 m | 20 (13.5%) | 19 (14.2%) | 14 (11%) | 0.727 | |
| α-glucosidase inhibitors | Before | 32 (21.6%) | 22 (16.4%) | 23 (18.1%) | 0.520 |
| 0 m | 16 (10.8%) | 10 (7.5%) | 15 (11.8%) | 0.466 | |
| 12 m | 19 (12.8%) | 10 (7.5%) | 17 (13.4%) | 0.237 | |
| Glinide | Before | 7 (4.7%) | 9 (6.7%) | 7 (5.5%) | 0.768 |
| 0 m | 0 (0%) | 0 (0%) | 0 (0%) | N/A | |
| 12 m | 0 (0%) | 0 (0%) | 0 (0%) | N/A | |
| Insulin | Before | 5 (3.4%) | 2 (1.5%) | 2 (1.6%) | 0.473 |
| 0 m | 5 (3.4%) | 2 (1.5%) | 3 (2.4%) | 0.590 | |
| 12 m | 6 (4.1%) | 2 (1.5%) | 3 (2.4%) | 0.399 | |