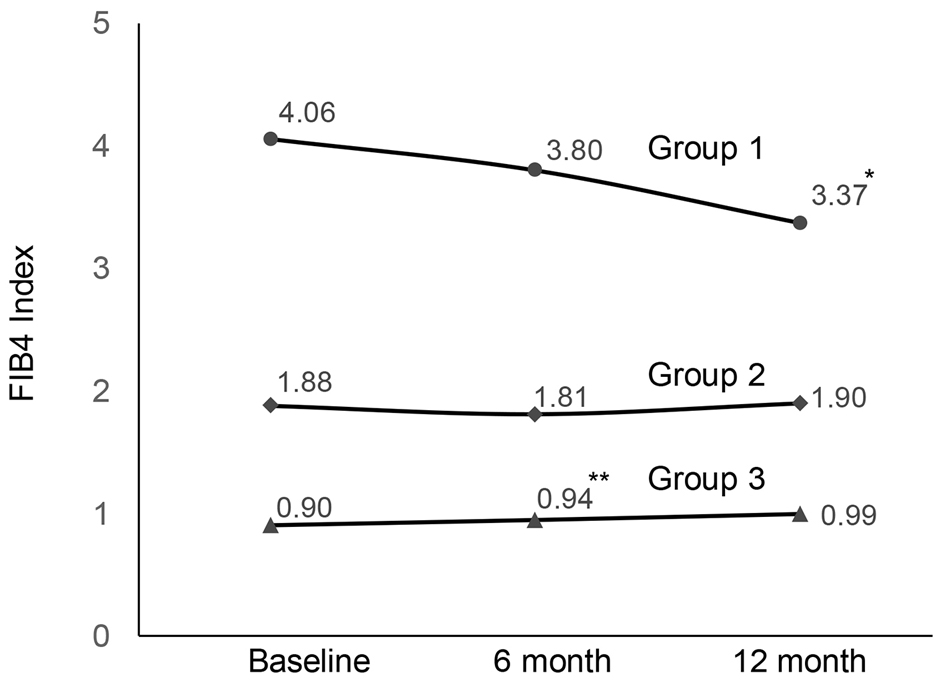
Figure 1. Changes in FIB4 index during SGLT2i treatment (*P = 0.003, **P = 0.005). FIB4: fibrosis-4; SGLT2i: sodium-glucose cotransporter 2 inhibitor.
| Journal of Endocrinology and Metabolism, ISSN 1923-2861 print, 1923-287X online, Open Access |
| Article copyright, the authors; Journal compilation copyright, J Endocrinol Metab and Elmer Press Inc |
| Journal website http://www.jofem.org |
Original Article
Volume 10, Number 1, February 2020, pages 1-7
Effects of Sodium-Glucose Cotransporter 2 Inhibitors on Hepatic Fibrosis in Patients With Type 2 Diabetes: A Chart-Based Analysis
Figure
Tables
| BMI: body mass index; HbA1c: hemoglobin A1c; SGLT2i: sodium-glucose cotransporter 2 inhibitor. | |
| Age | 57.2 ± 14.6 |
| Sex (M/F) | 173/142 |
| Body height (cm) | 163 ± 9 |
| Body weight (kg) | 77.3 ± 18.9 |
| BMI (kg/m2) | 29.2 ± 6.4 |
| Systolic blood pressure (mm Hg) | 132 ± 18 |
| Diastolic blood pressure (mm Hg) | 77 ± 12 |
| Plasma glucose (mg/dL) | 197 ± 82 |
| HbA1c (%) | 8.4 ± 1.6 |
| SGLT2i prescribed | |
| Luseogliflozin | 116 (33%) |
| Dapagliflozin | 74 (23%) |
| Tofogliflozin | 39 (12%) |
| Ipragliflozin | 22 (7%) |
| Empagliflozin | 30 (9%) |
| Canagliflozin | 34 (10%) |
| Baseline | 6 months | P* | 12 months | P* | |
|---|---|---|---|---|---|
| *Compared to baseline. SGLT2i: sodium-glucose cotransporter 2 inhibitor; BMI: body mass index; HbA1c: hemoglobin A1c; AST: aspartate aminotransferase; ALT: alanine aminotransferase; γGTP: γ-glutamyl transferase; HDL: high-density lipoprotein; LDL: low-density lipoprotein; eGFR: estimated glomerular filtration rate; FIB4: fibrosis-4. | |||||
| Body weight (kg) | 77.3 ± 18.9 | 75.4 ± 18.5 | < 0.001 | 74.7 ± 18.5 | < 0.001 |
| BMI (kg/m2) | 29.2 ± 6.4 | 28.5 ± 6.2 | < 0.001 | 28.3 ± 6.3 | < 0.001 |
| Plasma glucose (mg/dL) | 195 ± 82 | 159 ± 64 | < 0.001 | 160 ± 61 | < 0.001 |
| HbA1c (%) | 8.5 ± 1.6 | 7.5 ± 1.3 | < 0.001 | 7.6 ± 1.4 | < 0.001 |
| AST (IU/L) | 33 ± 25 | 28 ± 20 | < 0.001 | 28 ± 17 | < 0.001 |
| ALT (IU/L) | 40 ± 35 | 33 ± 30 | < 0.001 | 32 ± 27 | < 0.001 |
| γGTP (IU/L) | 58 ± 82 | 49 ± 63 | < 0.001 | 49 ± 63 | < 0.001 |
| Total cholesterol (mg/dL) | 192 ± 43 | 188 ± 37 | 0.019 | 186 ± 36 | 0.003 |
| HDL cholesterol (mg/dL) | 50 ± 14 | 52 ± 14 | 0.002 | 53 ±15 | < 0.001 |
| LDL cholesterol (mg/dL) | 109 ± 35 | 106 ± 30 | 0.007 | 107 ± 30 | 0.018 |
| Triglyceride (mg/dL) | 197 ± 135 | 183 ± 126 | 0.025 | 172 ± 126 | < 0.001 |
| Creatinine (mg/dL) | 0.79 ± 0.36 | 0.84 ± 0.45 | < 0.001 | 0.85 ± 0.46 | < 0.001 |
| eGFR (mL/min/1.73 m2) | 79 ± 30 | 76 ± 27 | < 0.001 | 75 ± 29 | < 0.001 |
| Hemoglobin (g/dL) | 13.9 ± 2.5 | 14.3 ±1.8 | < 0.001 | 14.2 ± 1.9 | 0.001 |
| Hematocrit (%) | 41.6 ± 4.9 | 43.6 ± 4.9 | < 0.001 | 43.3 ± 5.4 | < 0.001 |
| Platelet (× 104/µL) | 23.9 ± 6.9 | 23.4 ± 6.5 | 0.032 | 23.2 ± 6.3 | 0.002 |
| FIB4 index | 1.46 ± 1.15 | 1.45 ±1.21 | 0.560 | 1.46 ± 1.15 | 0.880 |
| Group | 1 | 2 | 3 | P |
|---|---|---|---|---|
| FIB4: fibrosis-4; BMI: body mass index; HbA1c: hemoglobin A1c; AST: aspartate aminotransferase; ALT: alanine aminotransferase; γGTP: γ-glutamyl transferase; HDL: high-density lipoprotein; LDL: low-density lipoprotein; eGFR: estimated glomerular filtration rate. | ||||
| Baseline FIB4 index | ≥ 2.67 | < 2.67, ≥ 1.30 | < 1.30 | |
| n (M/F) | 32 (17/15) | 104 (56/48) | 179 (100/79) | - |
| Age | 69.8 ± 12.1 | 64.7 ± 12.7 | 50.7 ± 12.4 | < 0.001 |
| Body weight (kg) | 71.7 ± 18.2 | 74.0 ± 19.4 | 80.1 ± 18.2 | 0.010 |
| BMI (kg/m2) | 28.5 ± 6.6 | 27.9 ± 5.8 | 30.0 ± 6.6 | 0.038 |
| Systolic blood pressure (mm Hg) | 131 ± 16 | 133 ± 19 | 131 ± 17 | 0.702 |
| Diastolic blood pressure (mm Hg) | 76 ± 10 | 74 ± 13 | 78 ± 12 | 0.055 |
| Plasma glucose (mg/dL) | 226 ± 76 | 191 ± 89 | 192 ± 77 | 0.116 |
| HbA1c (%) | 8.1 ± 1.3 | 8.5 ± 1.8 | 8.5 ± 1.6 | 0.472 |
| AST (IU/L) | 54 ± 30 | 39 ± 30 | 25 ± 15 | < 0.001 |
| ALT (IU/L) | 45 ± 30 | 45 ±43 | 37 ± 30 | 0.149 |
| γGTP (IU/L) | 114 ± 145 | 68 ± 98 | 45 ± 37 | < 0.001 |
| Total cholesterol (mg/dL) | 173 ± 32 | 194 ± 41 | 195 ± 42 | 0.183 |
| HDL cholesterol (mg/dL) | 47 ± 13 | 53 ± 14 | 49 ± 12 | 0.027 |
| LDL cholesterol (mg/dL) | 93 ± 29 | 106 ± 27 | 112 ± 36 | 0.079 |
| Triglyceride (mg/dL) | 187 ± 112 | 188 ± 134 | 206 ± 141 | 0.507 |
| Creatinine (mg/dL) | 0.83 ± 0.22 | 0.80 ± 0.30 | 0.78 ± 0.41 | 0.589 |
| eGFR (mL/min/1.73 m2) | 65 ± 22 | 74 ± 25 | 85 ± 32 | < 0.001 |
| Hemoglobin (g/dL) | 12.9 ± 1.9 | 13.8 ± 1.6 | 14.0 ± 2.9 | 0.055 |
| Hematocrit (%) | 39.3 ± 5.2 | 41.8 ± 4.5 | 41.9 ± 4.9 | 0.018 |
| Platelet (× 104/µL) | 15.1 ± 4.9 | 21.5 ± 4.3 | 26.9 ± 6.5 | < 0.001 |
| Baseline | 6 months | P* | 12 months | P* | |
|---|---|---|---|---|---|
| *Compared to baseline. BMI: body mass index; HbA1c: hemoglobin A1c; AST: aspartate aminotransferase; ALT: alanine aminotransferase; γGTP: γ-glutamyl transferase. | |||||
| Body weight (kg) | |||||
| Group 1 | 71.7 ± 18.2 | 70.2 ± 18.2 | < 0.004 | 69.9 ± 19.2 | 0.010 |
| Group 2 | 74.0 ± 19.4 | 72.0 ± 18.4 | < 0.001 | 70.6 ± 17.7 | < 0.001 |
| Group 3 | 80.1 ± 18.2 | 78.1 ± 17.5 | < 0.001 | 77.8 ± 18.1 | < 0.001 |
| BMI (kg/m2) | |||||
| Group 1 | 28.5 ± 6.6 | 27.9 ± 6.7 | 0.003 | 27.8 ± 7.0 | 0.009 |
| Group 2 | 27.9 ± 5.8 | 27.3 ± 5.6 | < 0.001 | 26.8 ± 5.4 | < 0.001 |
| Group 3 | 30.0 ± 6.6 | 29.3 ± 6.3 | < 0.001 | 29.2 ± 6.4 | < 0.001 |
| Plasma glucose (mg/dL) | |||||
| Group 1 | 226 ± 76 | 176 ± 69 | 0.004 | 168 ± 39 | < 0.001 |
| Group 2 | 191 ± 89 | 166 ± 67 | 0.010 | 160 ± 51 | < 0.001 |
| Group 3 | 192 ± 77 | 151 ± 60 | < 0.001 | 158 ± 69 | < 0.001 |
| HbA1c (%) | |||||
| Group 1 | 8.1 ± 1.3 | 7.5 ± 1.3 | 0.005 | 7.5 ± 1.4 | 0.029 |
| Group 2 | 8.6 ± 1.7 | 7.5 ± 1.3 | < 0.001 | 7.7 ± 1.5 | < 0.001 |
| Group 3 | 8.5 ± 1.6 | 7.5 ± 1.3 | < 0.001 | 7.5 ± 1.4 | < 0.001 |
| AST (IU/L) | |||||
| Group 1 | 54 ± 30 | 45 ± 29 | 0.038 | 38 ± 23 | 0.007 |
| Group 2 | 39 ± 30 | 30 ± 22 | < 0.001 | 30 ± 19 | < 0.001 |
| Group 3 | 25 ± 15 | 24 ± 15 | 0.098 | 24 ± 14 | 0.092 |
| ALT (IU/L) | |||||
| Group 1 | 45 ± 30 | 39 ± 29 | 0.087 | 35 ± 32 | 0.051 |
| Group 2 | 45 ± 43 | 32 ± 37 | < 0.001 | 30 ± 24 | < 0.001 |
| Group 3 | 37 ± 30 | 32 ± 26 | 0.002 | 32 ± 27 | 0.003 |
| γGTP (IU/L) | |||||
| Group 1 | 114 ± 145 | 85 ± 101 | 0.320 | 88 ± 107 | 0.183 |
| Group 2 | 68 ± 98 | 52 ± 77 | < 0.001 | 53 ± 73 | 0.075 |
| Group 3 | 45 ± 37 | 39 ± 33 | < 0.001 | 38 ± 34 | 0.001 |
| Platelet (× 104/µL) | |||||
| Group 1 | 15.1 ± 4.9 | 15.2 ± 6.0 | 0.737 | 15.5 ± 5.3 | 0.355 |
| Group 2 | 21.5 ± 4.3 | 21.3 ± 5.1 | 0.460 | 21.1 ± 5.1 | 0.174 |
| Group 3 | 23.9 ± 6.9 | 23.3 ± 6.5 | 0.032 | 23.2 ± 6.3 | 0.002 |
| R | P | |
|---|---|---|
| FIB4: fibrosis-4; SGLT2i: sodium-glucose cotransporter 2 inhibitor; BMI: body mass index; HbA1c: hemoglobin A1c; AST: aspartate aminotransferase; ALT: alanine aminotransferase; γGTP: γ-glutamyl transferase. | ||
| Age | 0.012 | 0.828 |
| Baseline body weight | -0.097 | 0.290 |
| Change of body weight | 0.014 | 0.809 |
| Baseline BMI | -0.064 | 0.269 |
| Change of BMI | -0.005 | 0.927 |
| Baseline HbA1c | 0.028 | 0.626 |
| Chang of HbA1c | -0.002 | 0.977 |
| Baseline AST | -0.300 | < 0.001 |
| Change of AST | 0.454 | < 0.001 |
| Baseline ALT | -0.128 | 0.023 |
| Change of ALT | -0.154 | 0.006 |
| Baseline γGTP | -0.187 | 0.003 |
| Change of γGTP | 0.348 | < 0.001 |
| Baseline platelet | 0.139 | 0.014 |
| Change of platelet | -0.175 | 0.002 |
| Baseline FIB4 index | -0.375 | < 0.001 |
| R | P | |
|---|---|---|
| FIB4: fibrosis-4; SGLT2i: sodium-glucose cotransporter 2 inhibitor; BMI: body mass index; HbA1c: hemoglobin A1c; AST: aspartate aminotransferase; ALT: alanine aminotransferase; γGTP: γ-glutamyl transferase. | ||
| Age | 0.105 | 0.567 |
| Baseline body weight | 0.034 | 0.860 |
| Change of body weight | -0.325 | 0.085 |
| Baseline BMI | 0.081 | 0.676 |
| Change of BMI | -0.312 | 0.099 |
| Baseline HbA1c | 0.145 | 0.452 |
| Chang of HbA1c | -0.010 | 0.960 |
| Baseline AST | -0.420 | 0.017 |
| Change of AST | 0.646 | < 0.001 |
| Baseline ALT | -0.133 | 0.467 |
| Change of ALT | 0.513 | 0.003 |
| Baseline γGTP | -0.061 | 0.774 |
| Change of γGTP | 0.319 | 0.121 |
| Baseline platelet | -0.028 | 0.880 |
| Change of platelet | -0.533 | 0.002 |
| Baseline FIB4 index | -0.510 | 0.003 |