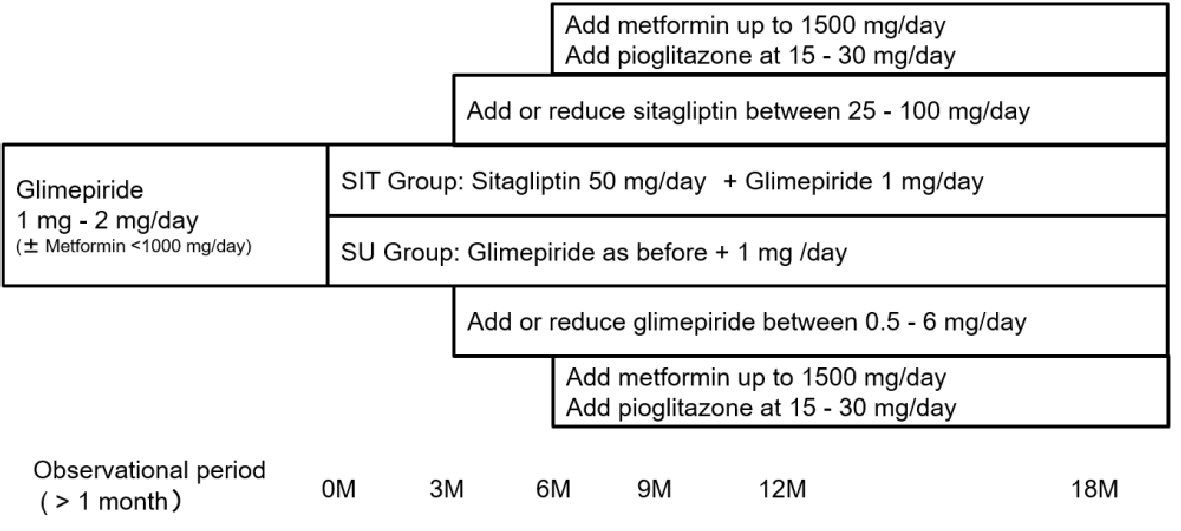
Figure 1. Study design.
| Journal of Endocrinology and Metabolism, ISSN 1923-2861 print, 1923-287X online, Open Access |
| Article copyright, the authors; Journal compilation copyright, J Endocrinol Metab and Elmer Press Inc |
| Journal website http://www.jofem.org |
Original Article
Volume 9, Number 6, December 2019, pages 171-179
Long-Term Efficacy and Safety of Add-On Therapy of Sitagliptin to a Very Small Dose of Glimepiride Versus a Small Dose of Glimepiride Over Eighteen Months
Figures
Tables
| SIT group | SU group | |
|---|---|---|
| BMI: body mass index; HbA1c: hemoglobin A1c; FPG: fasting plasma glucose; SBP: systolic blood pressure; DBP: diastolic blood pressure; LDL-C: low-density lipoprotein cholesterol; TG: triglycerides; HDL-C: high-density lipoprotein cholesterol. | ||
| Age (years) | 65.8 ± 8.6 | 64.7 ± 6.9 |
| Sex (%) | 16 (53.3%) | 17 (56.7%) |
| Body weight (kg) | 63.1 ± 12.0 | 64.5 ± 9.4 |
| BMI | 24.0 ± 3.4 | 25.4 ± 3.3 |
| Duration of diabetes mellitus | ||
| < 1 year | 1 (3.3%) | 1 (3.3%) |
| 1 to < 5 years | 5 (16.7%) | 5 (16.7%) |
| 5 to < 10 years | 10 (33.3%) | 5 (16.7%) |
| > 10 years | 12 (40.0%) | 15 (50.0%) |
| Not known | 2 (6.7%) | 4 (13.3%) |
| HbA1c (%) | 7.8 ± 1.1 | 7.7 ± 0.6 |
| FPG (mg/dL) | 162.4 ± 39.9 | 153.2 ± 27.0 |
| SBP (mm Hg) | 127.2 ± 10.2 | 131.9 ± 16.8 |
| DBP (mm Hg) | 72.1 ± 9.6 | 76.0 ± 10.3 |
| LDL-C (mg/dL) | 111.4 ± 31.8 | 113.8 ± 23.5 |
| TG (mg/dL) | 142.4 ± 73.6 | 132.1 ± 77.5 |
| HDL-C (mg/dL) | 52.5 ± 13.3 | 52.5 ± 10.7 |
| Smoking (%) | 5 (16.7%) | 1 (3.3%) |
| Drinking habit (%) | 7 (23.3%) | 7 (23.3%) |
| Comorbidities | ||
| Hypertension | 17 (56.7%) | 22 (73.3%) |
| Dyslipidemia | 13 (43.3%) | 13 (43.3%) |
| Hyperuricemia | 2 (6.7%) | 1 (3.3%) |
| Myocardial infarction | 0 (0%) | 1 (3.3%) |
| Angina pectoris | 1 (3.3%) | 0 (0) |
| Arteriosclerosis obliterans | 0 (0%) | 1 (3.3%) |
| SIT group | SU group | |||||||||
|---|---|---|---|---|---|---|---|---|---|---|
| 0 M | 3 M | 6 M | 12 M | 18 M | 0 M | 3 M | 6 M | 12 M | 18 M | |
| Mean ± standard deviation (SD). *P < 0.05, **P < 0.01, ***P < 0.001 vs. 0 M. M: month; BMI: body mass index; FPG: fasting plasma glucose; HbA1c: hemoglobin A1c; CPR: C-peptide; PI/I: proinsulin/insulin; HOMA-β: homeostasis model assessment-β cell; HOMA-R: homeostasis model assessment for insulin resistance; SBP: systolic blood pressure; DBP: diastolic blood pressure; LDL-C: low-density lipoprotein cholesterol; TG: triglycerides; HDL-C: high-density lipoprotein cholesterol; eGFR: estimated glomerular filtration rate; UACR: urinary albumin/creatinine ratio. UACR (mg/gCr) has been log-transformed. | ||||||||||
| Body weight (kg) | 63.1 ± 12.0 | 63.2 ± 12.0 | 63.8 ± 12.5 | 63.0 ± 12.0 | 62.8 ± 12.4 | 64.5 ± 9.4 | 64.8 ± 9.0 | 64.9 ± 9.2 | 64.7 ± 9.3 | 64.9 ± 8.9 |
| BMI | 24.0 ± 3.4 | 24.0 ± 3.4 | 24.3 ± 3.6 | 23.9 ± 3.4 | 23.9 ± 3.5 | 25.4 ± 3.3 | 25.4 ± 3.3 | 25.5 ± 3.4 | 25.5 ± 3.6 | 25.6 ± 3.6 |
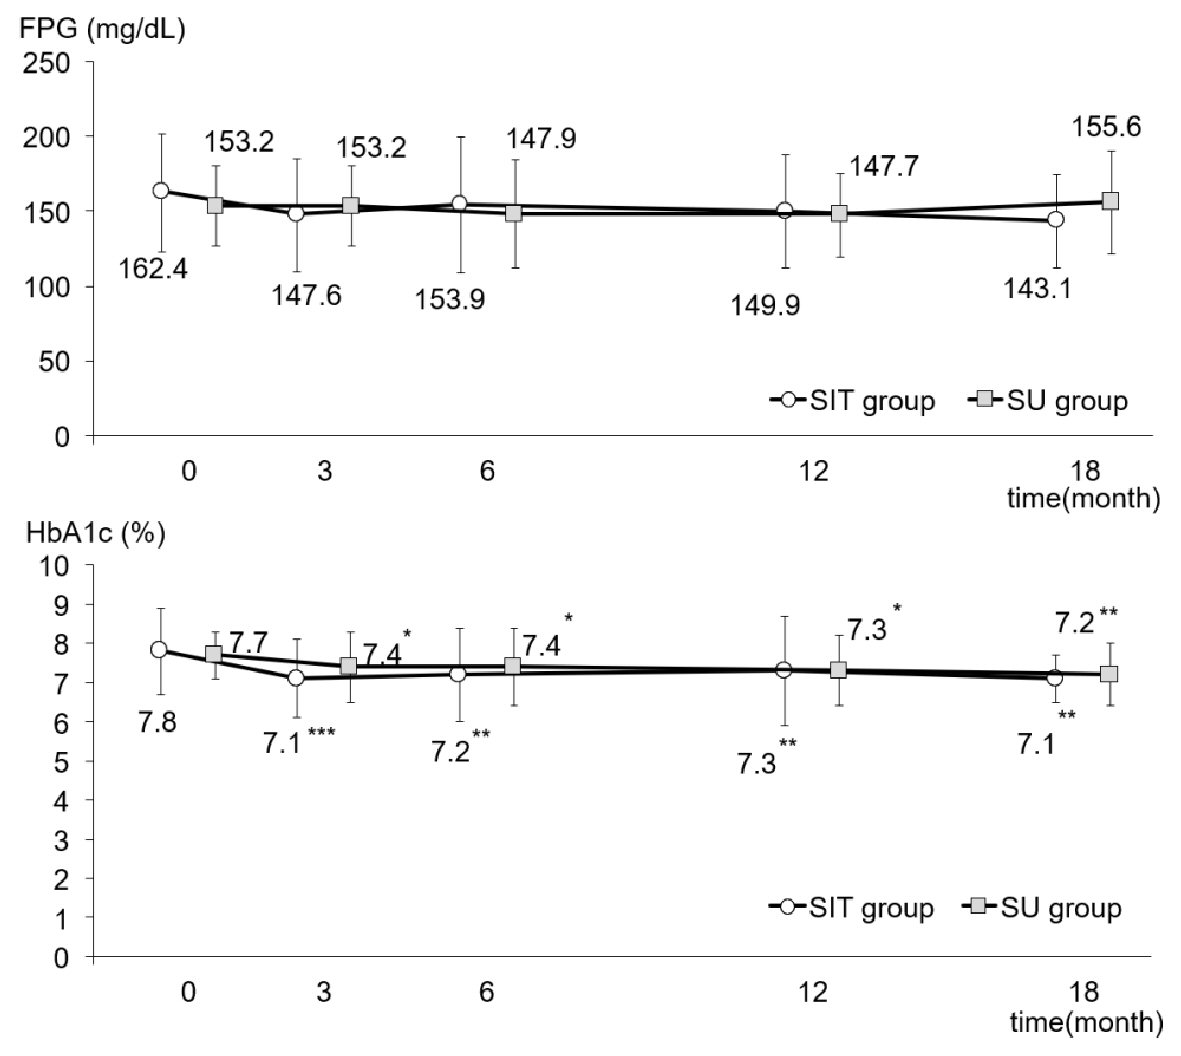
| FPG (mg/dL) | 162.4 ± 39.9 | 147.6 ± 37.8 | 153.9 ± 45.5 | 149.9 ± 37.4 | 143.1 ± 31.2 | 153.2 ± 27.0 | 153.2 ± 27.0 | 147.9 ± 35.9 | 147.7 ± 28.0 | 155.6 ± 34.6 |
| HbA1c (%) | 7.8 ± 1.1 | 7.1 ± 1.0*** | 7.2 ± 1.2** | 7.3 ± 1.4** | 7.1 ± 0.6** | 7.7 ± 0.6 | 7.4 ± 0.9* | 7.4 ± 1.0* | 7.3 ± 0.9* | 7.2 ± 0.8** |
| Insulin (µU/mL) | 8.2 ± 3.9 | 9.4 ± 4.7 | 9.6 ± 5.1 | 9.9 ± 6.4 | 10.4 ± 6.7 | 8.8 ± 10.0 | 11.5 ± 11.7 | 10.1 ± 8.4 | 10.7 ± 10.3 | 10.3 ± 9.2 |
| CPR (ng/mL) | 2.1 ± 0.5 | 2.4 ± 0.8 | 2.4 ± 0.8 | 2.3 ± 0.7 | 2.3 ± 0.8 | 2.2 ± 1.1 | 2.4 ± 1.4 | 2.3 ± 1.0 | 2.3 ± 1.0 | 2.3 ± 1.0 |
| Proinsulin (pmol/L) | 28.6 ± 16.6 | 30.1 ± 14.3 | 31.6 ± 16.8 | 30.8 ± 20.4 | 29.7 ± 19.5 | 25.6 ± 11.0 | 30.8 ± 16.2 | 26.4 ± 10.2 | 25.1 ± 11.4 | 21.9 ± 11.2 |
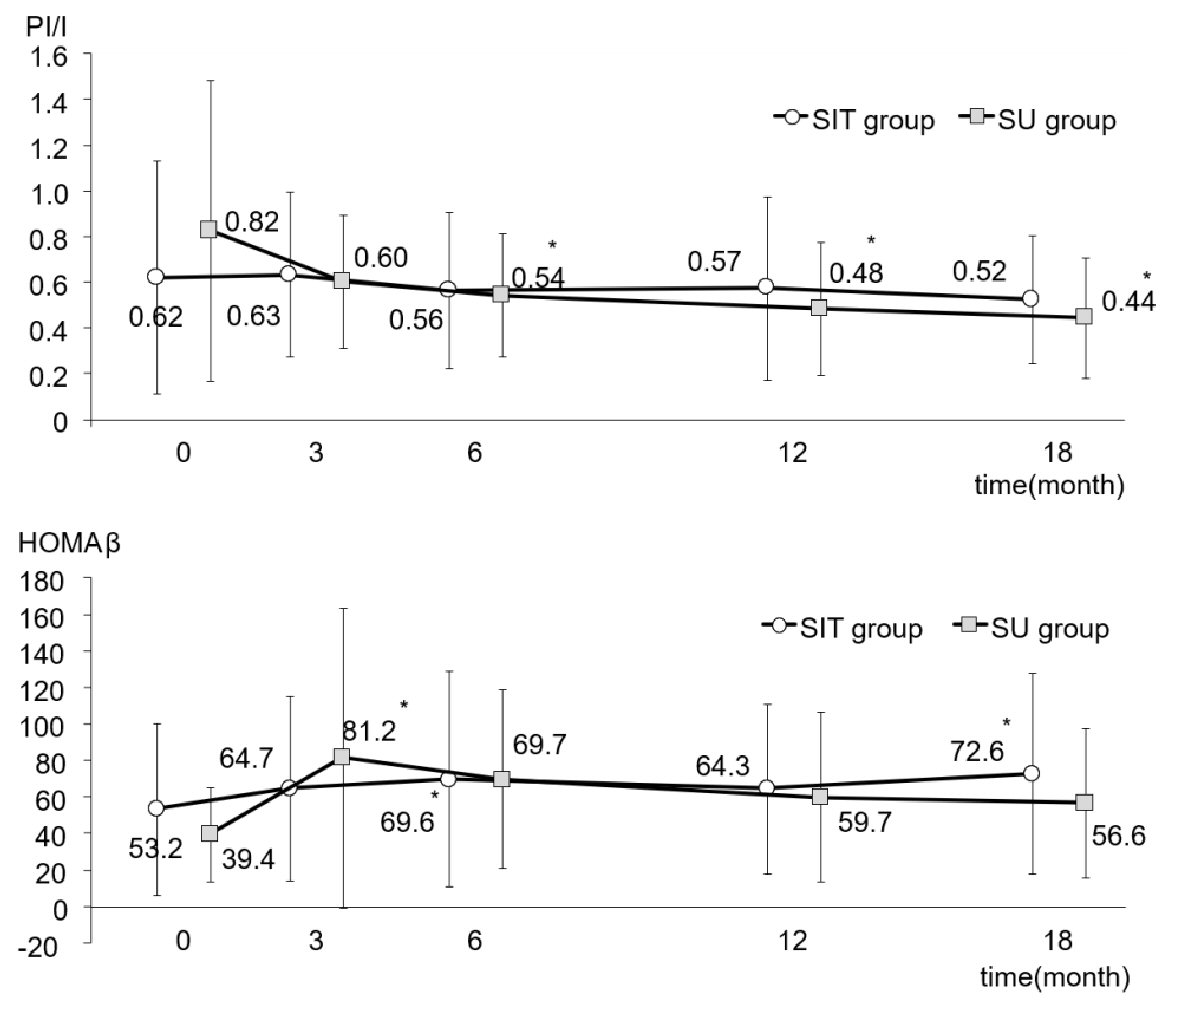
| PI/I | 0.62 ± 0.51 | 0.63 ± 0.36 | 0.56 ± 0.34 | 0.57 ± 0.40 | 0.52 ± 0.28 | 0.82 ± 0.66 | 0.60 ± 0.29 | 0.54 ± 0.27* | 0.48 ± 0.29* | 0.44 ± 0.26* |
| HOMA-β | 53.2 ± 46.7 | 64.7 ± 50.4 | 69.6 ± 58.6* | 64.3 ± 46.7 | 72.6 ± 54.9* | 39.4 ± 26.0 | 81.2 ± 82.1 | 69.7 ± 49.5* | 59.7 ± 46.5 | 56.6 ± 40.9 |
| HOMA-R | 3.0 ± 1.4 | 3.0 ± 1.2 | 3.5 ± 1.9 | 3.1 ± 1.5 | 3.3 ± 1.7 | 3.1 ± 2.8 | 3.8 ± 3.6 | 3.7 ± 3.1 | 3.7 ± 3.3 | 3.6 ± 2.8 |
| SBP (mm Hg) | 127.2 ± 10.2 | 125.9 ± 10.3 | 126.9 ± 15.1 | 123.6 ± 13.1 | 126.2 ± 14.4 | 131.9 ± 16.8 | 131.8 ± 17.5 | 132.9 ± 17.2 | 129.9 ± 14.6 | 130.4 ± 15.0 |
| DBP (mm Hg) | 72.1 ± 9.6 | 72.0 ± 9.6 | 72.2 ± 9.4 | 67.9 ± 9.9 | 70.4 ± 9.0 | 76.0 ± 10.3 | 75.6 ± 14.0 | 76.8 ± 10.7 | 74.9 ± 9.9 | 73.3 ± 8.5 |
| LDL-C (mg/dL) | 111.4 ± 31.8 | 112.5 ± 35.4 | 113.8 ± 32.2 | 116.4 ± 37.1 | 110.5 ± 34.7 | 113.8 ± 23.5 | 113.8 ± 23.5 | 114.0 ± 34.6 | 119.5 ± 29.7 | 107.3 ± 6.4 |
| TG (mg/dL) | 142.4 ± 73.6 | 142.4 ± 73.6 | 136.1 ± 63.1 | 135.9 ± 58.3 | 140.9 ± 66.2 | 132.1 ± 77.5 | 126.4 ± 75.3 | 131.2 ± 68.3 | 164.5 ± 221.4 | 139.4 ± 78.0 |
| HDL-C (mg/dL) | 52.5 ± 13.3 | 49.2 ± 12.2 | 50.4 ± 12.3 | 49.6 ± 13.0 | 50.0 ± 13.4 | 52.5 ± 10.7 | 51.9 ± 12.1 | 52.1 ± 11.4 | 51.9 ± 10.6 | 52.9 ± 10.8 |
| eGFR (mL/min/1.73 m2) | 79.2 ± 19.9 | 76.9 ± 18.7 | 78.8 ± 22.8 | 74.2 ± 18.4* | 72.7 ± 19.5* | 80.8 ± 22.2 | 79.8 ± 22.0 | 81.6 ± 22.2 | 80.5 ± 24.3 | 76.6 ± 20.4 |
| log UACR | 1.46 ± 0.7 | 1.31 ± 0.7 | 1.40 ± 0.7 | 1.35 ± 0.6 | 1.36 ± 0.7 | 1.34 ± 0.4 | 1.42 ± 0.5 | 1.57 ± 0.5 | 1.55 ± 0.5 | 1.48 ± 0.4 |