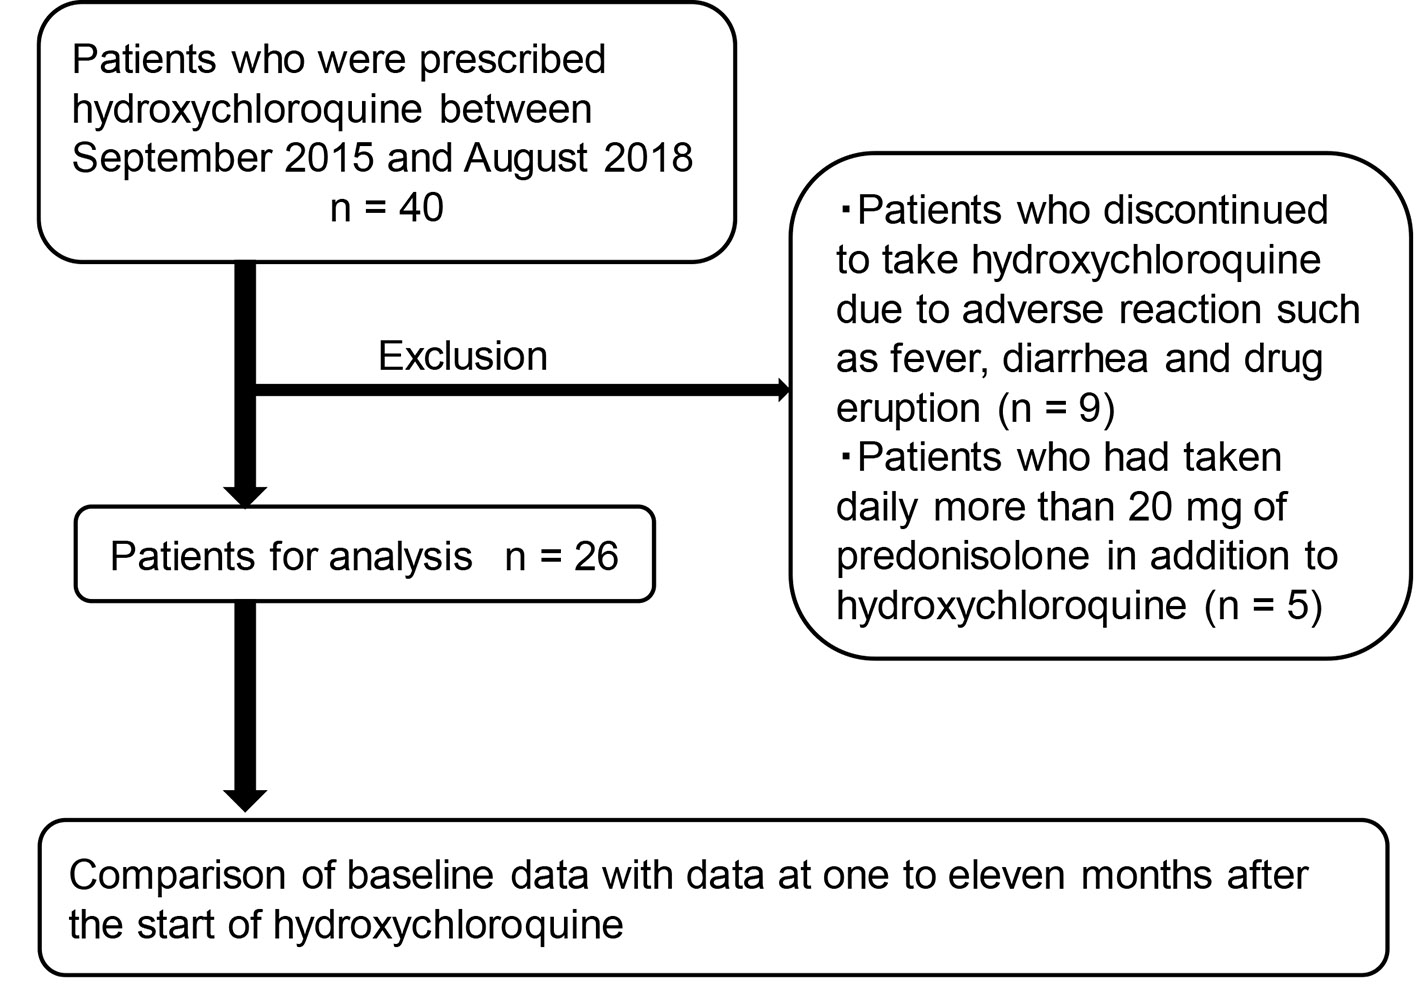
Figure 1. The recruitment of studied subjects.
| Journal of Endocrinology and Metabolism, ISSN 1923-2861 print, 1923-287X online, Open Access |
| Article copyright, the authors; Journal compilation copyright, J Endocrinol Metab and Elmer Press Inc |
| Journal website http://www.jofem.org |
Original Article
Volume 9, Number 5, October 2019, pages 159-164
Effects of Anti-Malarial Drug, Hydroxychloroquine, on Glucose and Lipid Metabolism in Japanese Population
Figure
Tables
| SD: standard deviation. | |
| Anthropometric data | |
| Sex (female, n (%)) | 22 (84.6%) |
| Age (years, mean ± SD) | 46 ± 16 |
| Body height (cm, mean ± SD) | 159.9 ± 6.3 |
| Body weight (kg, mean ± SD) | 51.8 ± 4.6 |
| Body mass index (kg/m2, mean ± SD) | 20.8 ± 2.4 |
| Rheumatic diseases | |
| Systemic lupus erythematosus (n (%)) | 22 (84.6%) |
| Rheumatoid arthritis (n (%)) | 4 (15.4%) |
| Metabolic diseases | |
| Diabetes (n (%)) | 3 (11.5%) |
| Dyslipidemia (n (%)) | 7 (26.9%) |
| SD: standard deviation. | |
| Daily dose of hydroxychloroquine (mg, mean ± SD) | 284.6 ± 67.5 |
| For rheumatic diseases | |
| Prednisolone | |
| Patients who had taken prednisolone (n (%)) | 23 (88.5%) |
| Daily dose (mg) | 6.5 ± 3.5 |
| Immunosuppressants (n (%)) | 7 (26.9%) |
| For diabetes | |
| Oral anti-diabetic drugs (n (%)) | 2 (7.7%) |
| Insulin (n (%)) | 0 (0%) |
| For dyslipidemia | |
| Statin (n (%)) | 6 (23.1%) |
| Fibrate (n (%)) | 2 (7.7%) |
| Month | n | Values at baseline | Values after hydroxychloroquine use | P value |
|---|---|---|---|---|
| HbA1c: hemoglobin A1c. | ||||
| 1 | 11 | 5.91 ± 0.60 | 5.87 ± 0.54 | 0.397 |
| 2 | 11 | 5.83 ± 0.59 | 5.75 ± 0.48 | 0.221 |
| 3 | 10 | 6.02 ± 0.50 | 5.92 ± 0.44 | 0.348 |
| 4 | 11 | 5.88 ± 0.62 | 5.74 ± 0.55 | 0.202 |
| 5 | 7 | 5.99 ± 0.57 | 5.74 ± 0.41 | 0.075 |
| 6 | 9 | 5.91 ± 0.69 | 5.66 ± 0.47 | 0.048 |
| 7 | 8 | 6.01 ± 0.55 | 5.76 ± 0.32 | 0.154 |
| 8 | 7 | 5.73 ± 0.72 | 5.50 ± 0.51 | 0.331 |
| 9 | 7 | 5.86 ± 0.77 | 5.71 ± 0.50 | 0.441 |
| 10 | 6 | 5.80 ± 0.76 | 5.52 ± 0.50 | 0.164 |
| 11 | 7 | 5.97 ± 0.64 | 5.70 ± 0.46 | 0.184 |
| Month | n | Values at baseline | Values after hydroxychloroquine use | P value |
|---|---|---|---|---|
| 1 | 12 | 101.0 ± 27.1 | 93.7 ± 26.8 | 0.005 |
| 2 | 10 | 102.3 ± 27.9 | 99.3 ± 30.5 | 0.657 |
| 3 | 11 | 102.6 ± 21.7 | 90.1 ± 24.5 | 0.011 |
| 4 | 13 | 99.2 ± 25.7 | 96.2 ± 32.5 | 0.618 |
| 5 | 10 | 101.8 ± 19.7 | 96.5 ± 16.2 | 0.228 |
| 6 | 9 | 88.1 ± 20.7 | 81.7 ± 20.6 | 0.318 |
| 7 | 9 | 105.2 ± 22.8 | 88.8 ± 17.6 | 0.006 |
| 8 | 8 | 98.0 ± 28.7 | 81.5 ± 24.1 | 0.045 |
| 9 | 9 | 93.2 ± 25.2 | 88.0 ± 18.8 | 0.438 |
| 10 | 9 | 97.2 ± 27.0 | 95.0 ± 30.5 | 0.876 |
| 11 | 9 | 104.1 ± 22.2 | 87.6 ± 17.2 | 0.022 |
| Month | n | Values at baseline | Values after hydroxychloroquine use | P value |
|---|---|---|---|---|
| HDL-C: high-density lipoprotein-cholesterol. | ||||
| 1 | 13 | 59.5 ± 22.9 | 59.1 ± 21.5 | 0.722 |
| 2 | 11 | 59.2 ± 24.5 | 57.8 ± 24.4 | 0.393 |
| 3 | 12 | 61.2 ± 23.2 | 61.0 ± 23.0 | 0.908 |
| 4 | 14 | 58.2 ± 21.3 | 60.4 ± 21.7 | 0.104 |
| 5 | 10 | 60.7 ± 23.6 | 63.3 ± 21.8 | 0.164 |
| 6 | 10 | 61.6 ± 22.4 | 59.1 ± 24.4 | 0.231 |
| 7 | 10 | 66.4 ± 21.8 | 64.9 ± 20.9 | 0.696 |
| 8 | 8 | 62.9 ± 24.5 | 62.8 ± 22.9 | 0.955 |
| 9 | 10 | 63.2 ± 22.9 | 67.5 ± 21.6 | 0.217 |
| 10 | 10 | 61.8 ± 22.5 | 65.4 ± 22.9 | 0.287 |
| 11 | 10 | 65.3 ± 21.1 | 65.7 ± 22.5 | 0.846 |
| Month | n | Values at baseline | Values after hydroxychloroquine use | P value |
|---|---|---|---|---|
| LDL-C: low-density lipoprotein-cholesterol. | ||||
| 1 | 14 | 157.4 ± 102.6 | 141.5 ± 138.0 | 0.382 |
| 2 | 13 | 179.9 ± 100.3 | 134.8 ± 68.1 | 0.009 |
| 3 | 13 | 143.2 ± 64.6 | 131.7 ± 58.1 | 0.373 |
| 4 | 16 | 173.9 ± 101.5 | 149.6 ± 128.1 | 0.133 |
| 5 | 10 | 151.0 ± 75.2 | 115.9 ± 47.2 | 0.132 |
| 6 | 12 | 190.8 ± 106.5 | 176.8 ± 127.1 | 0.551 |
| 7 | 11 | 133.1 ± 65.9 | 101.5 ± 37.3 | 0.099 |
| 8 | 9 | 182.9 ± 132.5 | 158.1 ± 125.1 | 0.291 |
| 9 | 12 | 180.8 ± 108.7 | 155.6 ± 95.5 | 0.558 |
| 10 | 11 | 180.3 ± 120.3 | 134.0 ± 52.3 | 0.098 |
| 11 | 11 | 141.8 ± 69.8 | 125.4 ± 70.7 | 0.392 |
| Month | n | Values at baseline | Values after hydroxychloroquine use | P value |
|---|---|---|---|---|
| HDL-C: high-density lipoprotein-cholesterol. | ||||
| 1 | 13 | 135.2 ± 26.9 | 120.8 ± 20.2 | 0.051 |
| 2 | 11 | 143.3 ± 22.8 | 127.8 ± 27.4 | 0.038 |
| 3 | 12 | 132.7 ± 28.3 | 119.0 ± 23.9 | 0.008 |
| 4 | 14 | 133.7 ± 26.0 | 126.5 ± 24.3 | 0.157 |
| 5 | 9 | 131.4 ± 25.9 | 119.8 ± 17.6 | 0.074 |
| 6 | 10 | 127.8 ± 24.2 | 122.4 ± 22.2 | 0.579 |
| 7 | 10 | 134.0 ± 29.1 | 111.7 ± 15.1 | 0.011 |
| 8 | 8 | 129.5 ± 26.2 | 115.9 ± 18.4 | 0.202 |
| 9 | 10 | 131.9 ± 26.6 | 122.7 ± 19.2 | 0.278 |
| 10 | 10 | 133.2 ± 24.9 | 124.5 ± 25.7 | 0.361 |
| 11 | 10 | 133.0 ± 28.1 | 120.8 ± 23.6 | 0.164 |