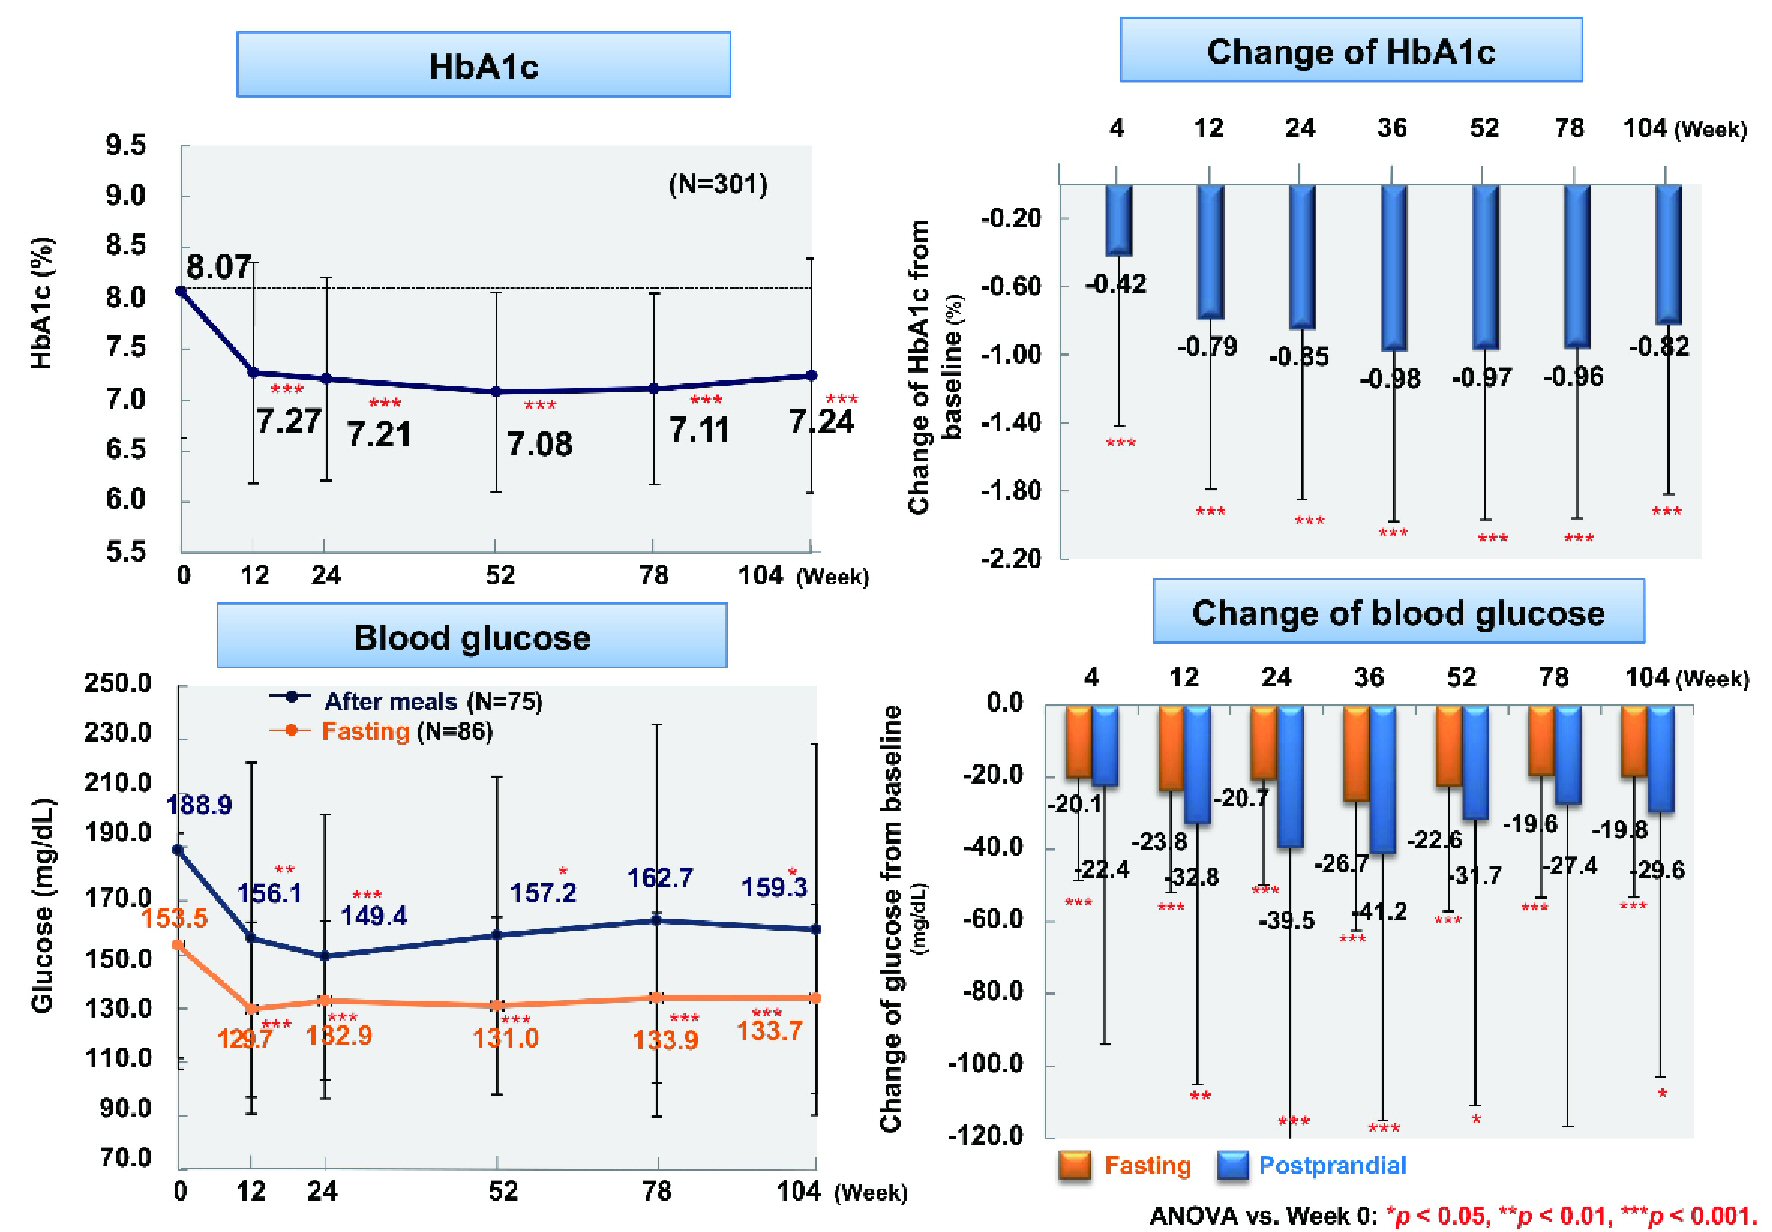
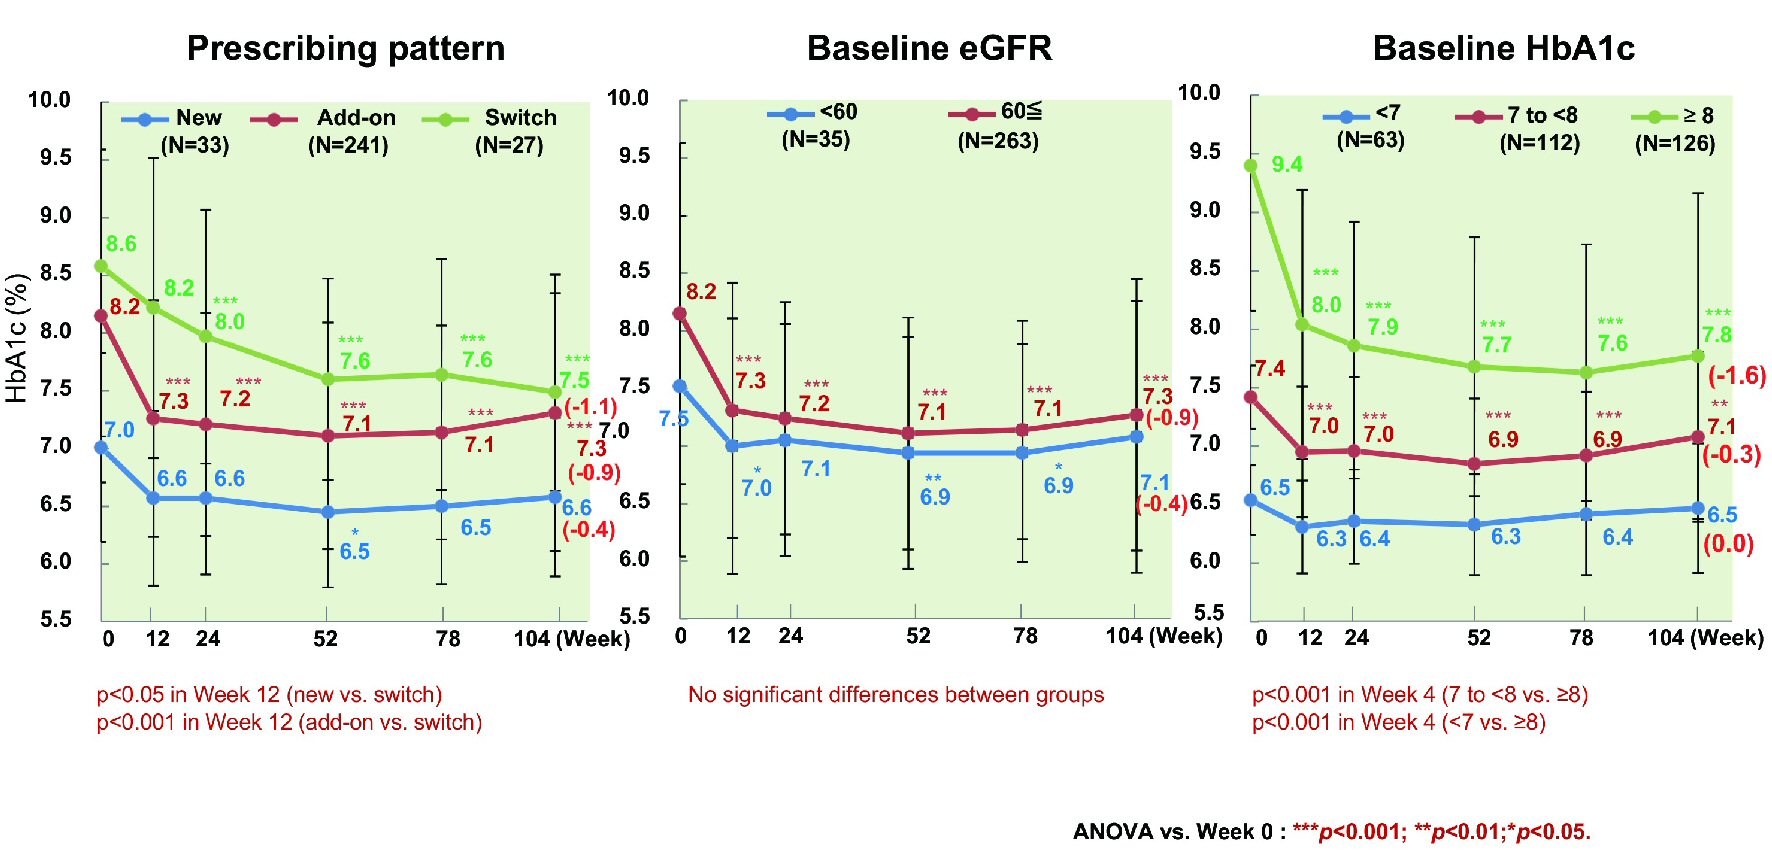
Figure 1. Changes of glycemic control. ANOVA: analysis of variance; HbA1c: hemoglobin A1c.
| Journal of Endocrinology and Metabolism, ISSN 1923-2861 print, 1923-287X online, Open Access |
| Article copyright, the authors; Journal compilation copyright, J Endocrinol Metab and Elmer Press Inc |
| Journal website http://www.jofem.org |
Original Article
Volume 9, Number 3, June 2019, pages 51-62
Efficacy and Safety of Ipragliflozin in Patients With Type 2 Diabetes: ASSIGN-K Study
Figures
Tables
| Item | N = 451 |
|---|---|
| aMean ± standard deviation. BMI: body mass index; HbA1c: hemoglobin A1c. | |
| Sex | |
| Male, n (%) | 234 (51.9) |
| Female, n (%) | 217 (48.1) |
| Age, years | 55.5 ± 11.6a |
| Duration of diabetes, years | 9.7 ± 7.4a |
| HbA1c (%) | 8.01 ± 1.43a |
| Fasting blood glucose (mg/dL) | 156.4 ± 48.1a |
| BMI (kg/ m2) | 29.4 ± 5.3a |
| Weight (kg) | 78.6 ± 16.8a |
| Waist circumference (cm) | 99.8 ± 12.0a |
| Complications of diabetes | |
| Diabetic nephropathy, n (%) | 131 (29.0) |
| Cataract, n (%) | 76 (16.9) |
| Diabetic retinopathy, n (%) | 62 (13.7) |
| Diabetic neuropathy, n (%) | 60 (13.3) |
| Lifestyle-related diseases | |
| Dyslipidemia, n (%) | 294 (65.2) |
| Hypertension, n (%) | 259 (57.4) |
| Fatty liver, n (%) | 218 (48.3) |
| Order | Independent variable | Standardized beta coefficient | Partial regression coefficient | P value |
|---|---|---|---|---|
| Adjusted R2 = 0.425. Dependent variable: change of HbA1c (week 104 - baseline). Independent variables: sex (0: male, 1: female), age, duration of diabetes, baseline HbA1c, and baseline BMI. BMI: body mass index; HbA1c: hemoglobin A1c. | ||||
| Fixed number | 0 | 2.835 | < 0.0001 | |
| 1 | Baseline HbA1c | -0.646 | -0.583 | < 0.0001 |
| 2 | Baseline BMI | 0.13 | 0.033 | < 0.0088 |
| 3 | Duration of diabetes | 0.124 | 0.021 | 0.0118 |
| 4 | Sex (0: male, 1: female) | 0.08 | 0.21 | 0.0874 |
| 5 | Age | -0.034 | -0.004 | 0.5197 |
| Number of patients | Incidence (%) | |
|---|---|---|
| AEs | ||
| AEs in all patients (n = 451) | 129 | 28.6 |
| AEs requiring hospitalization | 10 | 2.2 |
| ARs | ||
| ARs in all patients (n = 451) | 77 | 17.1 |
| ARs in patients < 65 years old (n = 348) | 50 | 14.4 |
| ARs in patients ≥ 65 years old (n = 103) | 27 | 26.2 |
| AE term | Number of patients | AE term | Number of patients |
|---|---|---|---|
| aPatients aged ≥ 65 years. AE: adverse event; AR: adverse reaction. | |||
| Pyelitisa | 1 | Ketosisa | 1 |
| Urinary tract infectiona | 1 | Dehydrationa | 1 |
| Angina unstable | 1 | Ureterolithiasisa | 1 |
| Nauseaa | 1 | Depressive symptoms | 1 |
| Lung cancera | 1 | - | - |