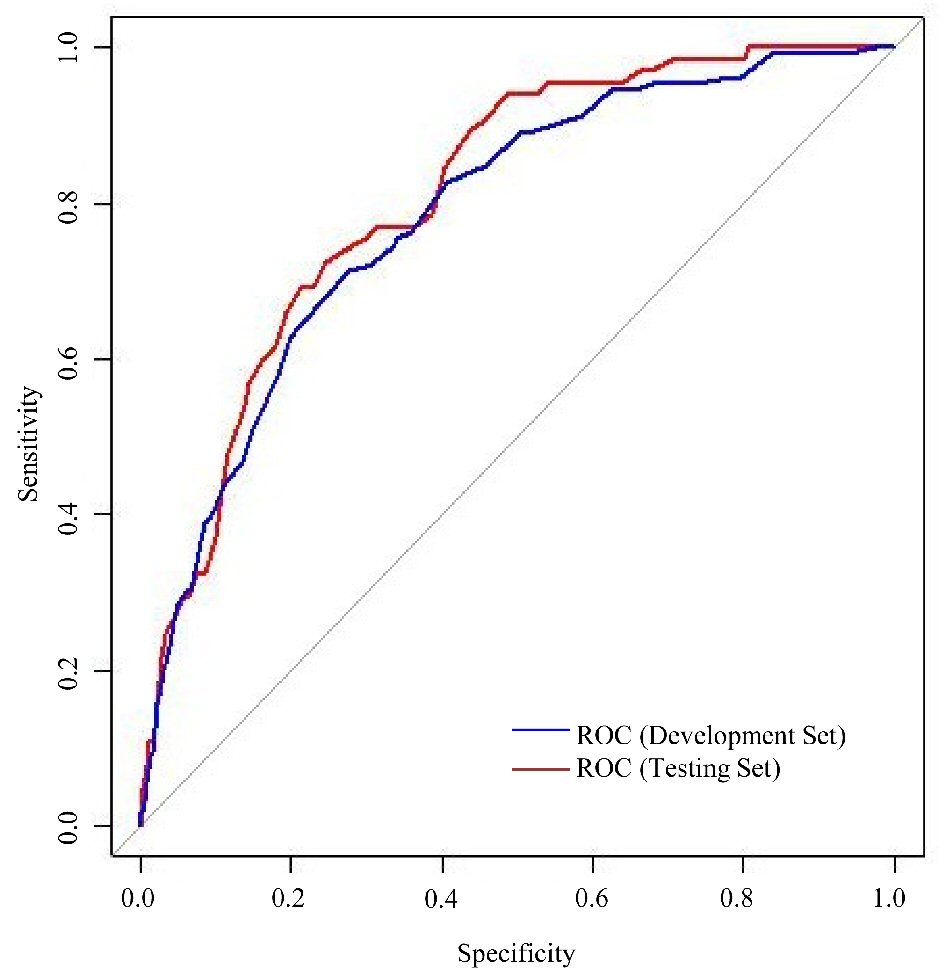
Figure 1. Receiver operating characteristic (ROC) curves for performance of risk score in development and testing set.
| Journal of Endocrinology and Metabolism, ISSN 1923-2861 print, 1923-287X online, Open Access |
| Article copyright, the authors; Journal compilation copyright, J Endocrinol Metab and Elmer Press Inc |
| Journal website http://www.jofem.org |
Original Article
Volume 9, Number 3, June 2019, pages 43-50
Development and Validation of a Primary Care Tool to Identify Patients With Type 2 Diabetes Mellitus at High Risk of Hypoglycemia-Related Inpatient Admissions
Figure
Tables
| Characteristic | Development set (n = 31,653) | Testing set (n = 15,751) |
|---|---|---|
| aCandidate risk factors for predicting 6-month hypoglycemia admission. SD: standard deviation; CKD: chronic kidney disease. | ||
| Agea, mean (SD), years | 64.1 (11.0) | 64.1 (11.1) |
| Age category, n (%) | ||
| < 60 years | 10,562 (33.3%) | 5,278 (33.5%) |
| 60 - 64 years | 5,836 (18.4%) | 2,901 (18.4%) |
| 65 - 69 years | 5,139 (16.2%) | 2,509 (15.9%) |
| 70 - 74 years | 4,495 (14.2%) | 2,243 (14.2%) |
| ≥ 75 years | 5,621 (17.8%) | 2,820 (17.9%) |
| Race, n (%) | ||
| Chinese | 23,947 (75.7%) | 11,856 (75.3%) |
| Malay | 3,255 (10.3%) | 1,622 (10.3%) |
| Indian | 3,404 (10.8%) | 1,681 (10.7%) |
| Others | 1,047 (3.3%) | 592 (3.8%) |
| Sex, n (%) | ||
| Male | 15,242 (48.2%) | 7,453 (47.3%) |
| Female | 16,411 (51.8%) | 8,298 (52.7%) |
| Last HbA1ca, mean (SD), % | 7.4 (1.3) | 7.4 (1.3) |
| HbA1c category, n (%) | ||
| ≥ 75 mmol/mol (≥ 9.0%) | 2,977 (9.4%) | 1,461 (9.3%) |
| 64 - 74 mmol/mol (8.0-8.9%) | 4,088 (12.9%) | 2,018 (12.8%) |
| 53 - 63 mmol/mol (7.0-7.9%) | 11,464 (36.2%) | 5,748 (36.5%) |
| 42 - 52 mmol/mol (6.0-6.9%) | 11,274 (35.6%) | 5,650 (35.9%) |
| < 42 mmol/mol (< 6.0%) | 1,850 (5.8%) | 874 (5.5%) |
| Largest reduction in HbA1c within 1 yeara, mean (SD), % | 0.7 (1.0) | 0.7 (1.0) |
| Largest reduction in HbA1c within 1 year category, n (%) | ||
| No reduction observed | 9,011 (28.5%) | 4,504 (28.6%) |
| Reduction of 1 - 10 mmol/mol (0.1-0.9%) | 16,489 (52.1%) | 8,137 (51.7%) |
| Reduction of 11 - 21 mmol/mol (1.0-1.9%) | 3,883 (12.3%) | 1,940 (12.3%) |
| Reduction of 22 - 32 mmol/mol (2.0-2.9%) | 1,133 (3.6%) | 602 (3.8%) |
| Reduction of 33 - 43 mmol/mol (3.0-3.9%) | 515 (1.6%) | 256 (1.6%) |
| Reduction of 44 - 55 mmol/mol (4.0-4.9%) | 257 (0.8%) | 126 (0.8%) |
| Reduction of ≥ 55 mmol/mol (≥ 5.0%) | 365 (1.2%) | 185 (1.2%) |
| Last body mass index (BMI)a, kg/m2 | 26.5 (4.7) | 26.5 (4.7) |
| Body mass index category, n (%) | ||
| Severely overweight (≥ 27.5 kg/m2) | 11,258 (35.6%) | 5,565 (35.3%) |
| Moderately overweight (23.0 - 27.4 kg/m2) | 13,487 (42.6%) | 6,749 (42.8%) |
| Acceptable weight (18.5 - 22.9 kg/m2) | 6,402 (20.2%) | 3,158 (20.0%) |
| Underweight (< 18.5 kg/m2) | 506 (1.6%) | 279 (1.8%) |
| Last estimated glomerular filtration rate (eGFR)a, mL/min/1.73 m2 | 85.1 (28.4) | 85.4 (28.6) |
| Estimated glomerular filtration rate category, n (%) | ||
| CKD stage 1 (≥ 90 mL/min/1.73 m2) | 13,172 (41.6%) | 6,684 (42.4%) |
| CKD stage 2 (60 - 89 mL/min/1.73 m2) | 12,727 (40.2%) | 6,247 (39.7%) |
| CKD stage 3 (30 - 59 mL/min/1.73 m2) | 5,053 (16.0%) | 2,511 (15.9%) |
| CKD stage 4 (15 - 29 mL/min/1.73 m2) | 621 (2.0%) | 258 (1.6%) |
| CKD stage 5 (< 15 mL/min/1.73 m2) | 80 (0.3%) | 51 (0.3%) |
| Hypoglycemia admission during past 1 yeara, n (%) | ||
| Yes | 251 (0.8%) | 120 (0.8%) |
| No | 31,402 (99.2%) | 15,361 (99.2%) |
| Usage of sulphonylurea and/or insulina, n (%) | ||
| None | 15,750 (49.8%) | 7,912 (50.2%) |
| Sulphonylurea only | 12,582 (39.7%) | 6,252 (39.7%) |
| Sulphonylurea and insulin | 1,192 (3.8%) | 600 (3.8%) |
| Insulin only | 2,129 (6.7%) | 987 (6.3%) |
| Risk factor | Full model coefficient (OR) | 95% CI | P value | Parsimonious model coefficient (OR) | 95% CI | P value |
|---|---|---|---|---|---|---|
| Bias correction factor, τ = 0.004. OR: odds ratio; CI: confidence interval. | ||||||
| Age (in 5-year increments) | 1.17 | (1.06, 1.28) | 0.002 | 1.16 | (1.05, 1.28) | 0.003 |
| Largest reduction in HbA1c within 1 year | 1.29 | (1.15, 1.44) | < 0.001 | 1.28 | (1.14, 1.43) | < 0.001 |
| Last BMI | 0.95 | (0.91, 0.99) | < 0.001 | 0.95 | (0.91, 0.99) | < 0.001 |
| Last eGFR (in 5-mL/min/1.73 m2 increments) | 0.91 | (0.87, 0.94) | < 0.001 | 0.91 | (0.87, 0.94) | < 0.001 |
| Usage of sulphonylurea and/or insulin | ||||||
| None | Reference | Reference | ||||
| Sulphonylurea only | 2.13 | (1.33, 3.41) | < 0.001 | 2.29 | (1.44, 3.62) | < 0.001 |
| Sulphonylurea and insulin | 4.75 | (2.31, 9.78) | < 0.001 | 5.69 | (2.89, 11.21) | < 0.001 |
| Insulin only | 5.29 | (2.93, 9.55) | < 0.001 | 6.18 | (3.57, 10.70) | < 0.001 |
| Last HbA1c | 1.10 | (0.97, 1.26) | 0.14 | |||
| Hypoglycemia admission during past 1 year (Yes) | 1.22 | (0.38, 3.94) | 0.74 | |||
| Risk factor | Categories | Score |
|---|---|---|
| Age, years | < 60 | 0 |
| 60 - 64 | 6 | |
| 65 - 69 | 8 | |
| 70 - 74 | 10 | |
| ≥ 75 | 14 | |
| Last BMI, kg/m2 | Severely overweight (≥ 27.5) | 0 |
| Moderate overweight (23.0 - 27.4) | 6 | |
| Acceptable weight (18.5 - 22.9) | 9 | |
| Underweight (< 18.5) | 11 | |
| Last eGFR, mL/min/1.73 m2 | CKD stage 1 (≥ 90) | 0 |
| CKD stage 2 (60 - 89) | 12 | |
| CKD stage 3 (30 - 59) | 20 | |
| CKD stage 4 (15 - 29) | 25 | |
| CKD stage 5 (< 15) | 28 | |
| Largest reduction in HbA1c within 1 year | No change or increase | 0 |
| Reduction of 1 - 10 mmol/mol (0.1-0.9%) | 2 | |
| Reduction of 11 - 21 mmol/mol (1.0-1.9%) | 5 | |
| Reduction of 22 - 32 mmol/mol (2.0-2.9%) | 8 | |
| Reduction of 33 - 43 mmol/mol (3.0-3.9%) | 11 | |
| Reduction of 44 - 55 mmol/mol (4.0-4.9%) | 14 | |
| Reduction of ≥ 55 mmol/mol (≥ 5.0%) | 23 | |
| Usage of sulphonylurea and/or insulin | None | 0 |
| Sulphonylurea only | 11 | |
| Sulphonylurea and insulin | 23 | |
| Insulin only | 24 |
| Threshold | Sensitivity | No. of positive cases correctly classified | Specificity | No. of negative cases correctly classified |
|---|---|---|---|---|
| 0 | 100.0% | 65 | 0.0% | 0 |
| 18 | 98.5% | 64 | 24.5% | 3,843 |
| 28 | 93.8% | 61 | 47.4% | 7,435 |
| 30 | 90.8% | 59 | 54.3% | 8,517 |
| 32 | 84.6% | 55 | 59.7% | 9,365 |
| 34 | 76.9% | 50 | 63.8% | 10,008 |
| 36 | 76.9% | 50 | 68.7% | 10,776 |
| 38 | 73.8% | 48 | 73.1% | 11,466 |
| 40 | 69.2% | 45 | 77.0% | 12,078 |
| 42 | 66.2% | 43 | 80.8% | 12,674 |
| 44 | 60.0% | 39 | 83.8% | 13,145 |
| 46 | 53.8% | 35 | 86.2% | 13,521 |
| 48 | 43.1% | 28 | 89.3% | 14,008 |
| 58 | 24.6% | 16 | 96.6% | 15,153 |
| 100 | 0.0% | 0 | 100.0% | 15,686 |