Figures
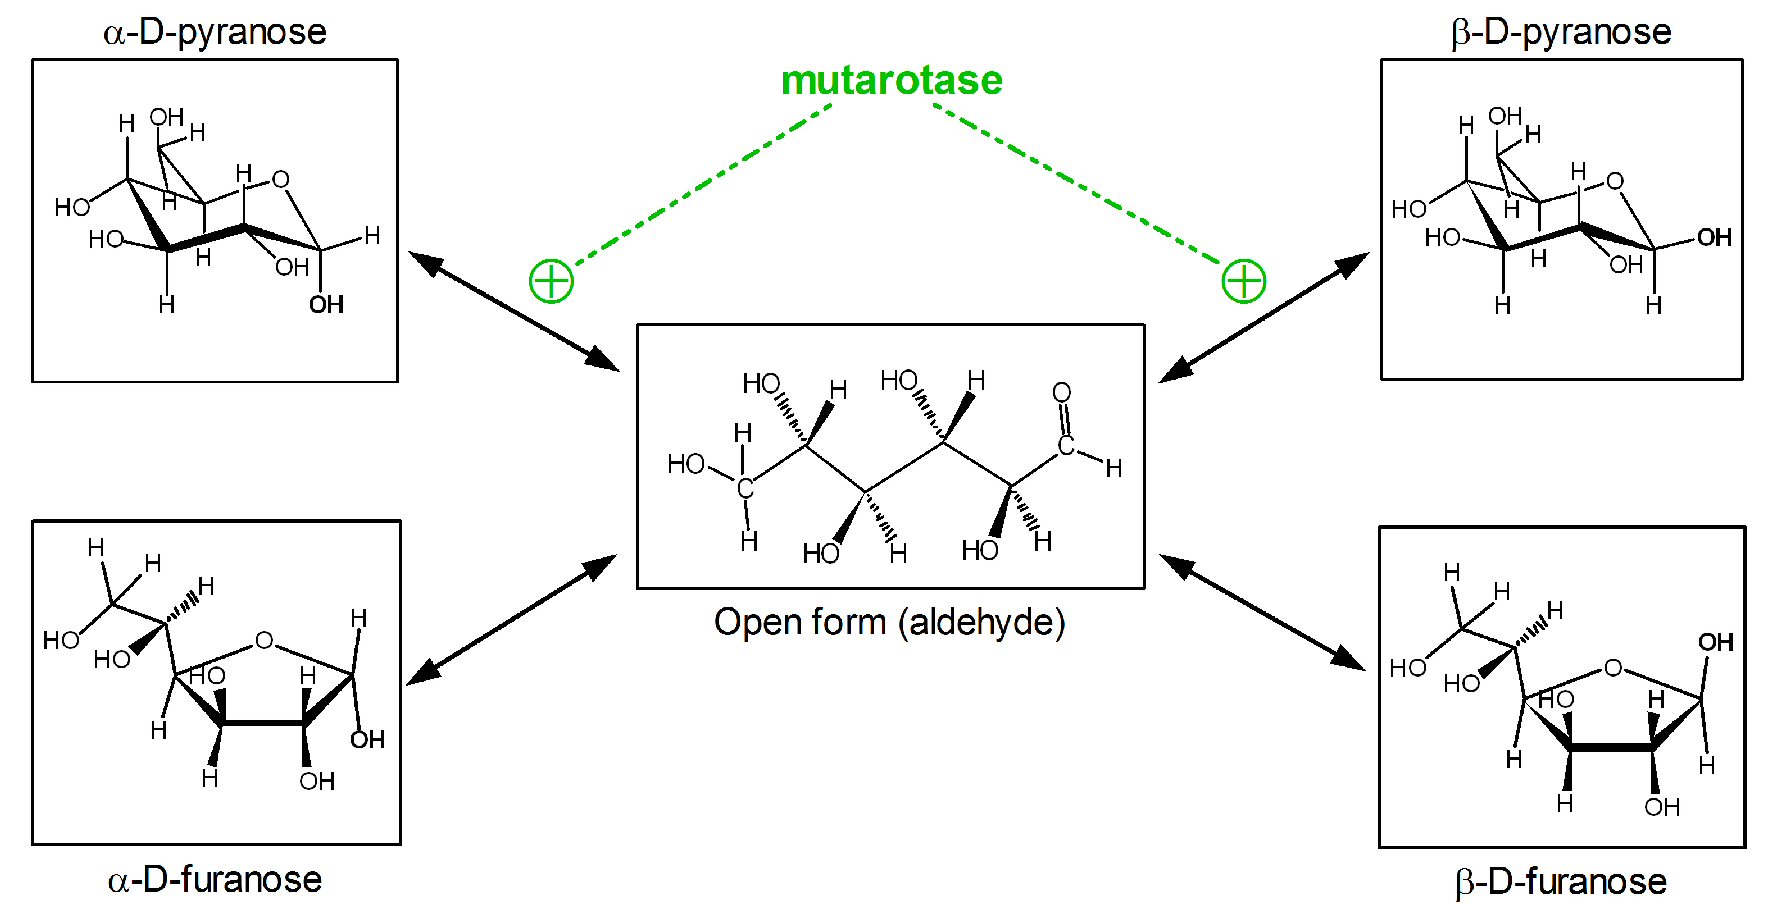
Figure 1. Anomeric forms of glucose in solution and its spontaneous or facilitated interconversions.
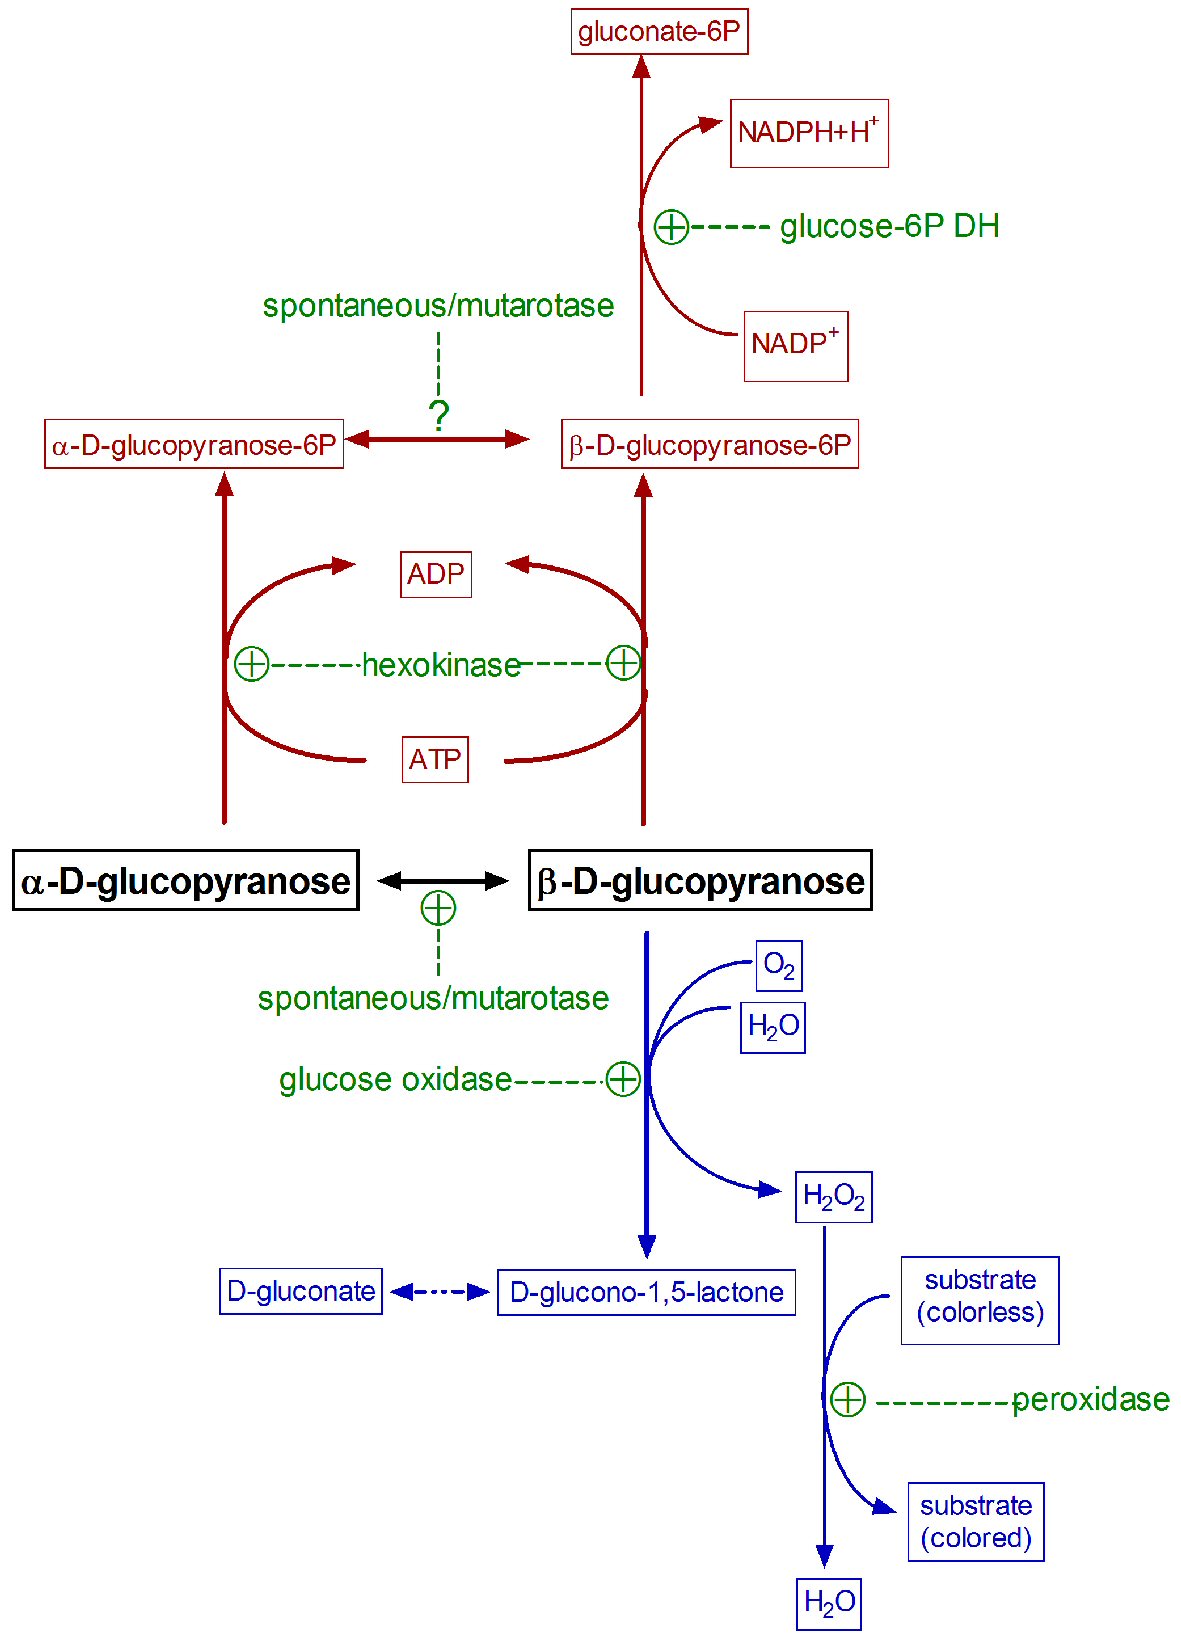
Figure 2. Common paired enzymatic reactions used in the specific measurement of glucose. Hexokinase/glucose 6-P dehydrogenase reaction is represented in dark red, glucose oxidase/peroxidase in blue, and all enzymes involved in green.
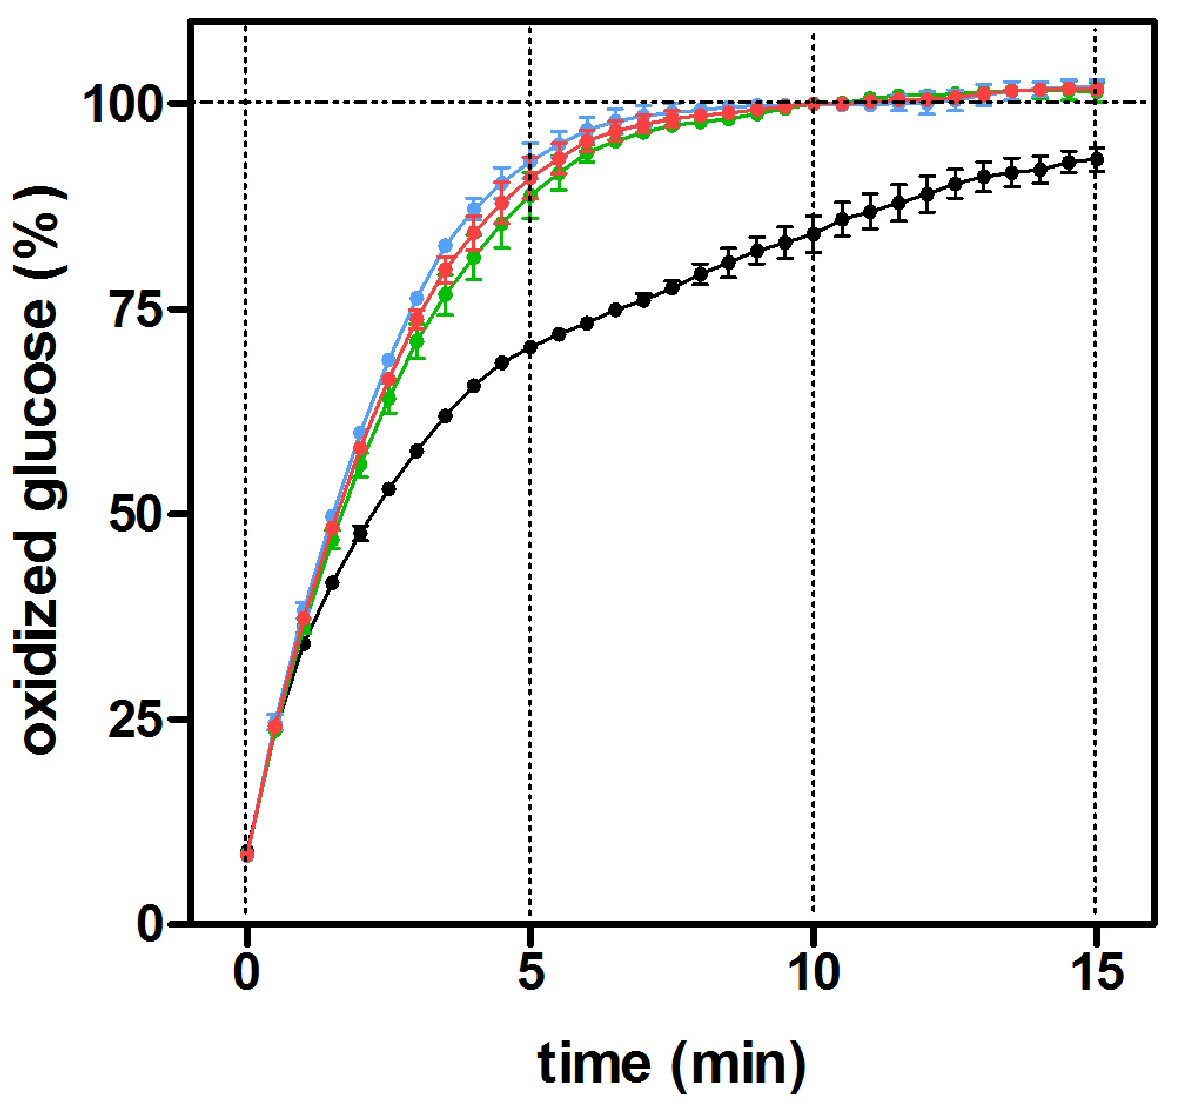
Figure 3. Percentage of oxidized glucose with incubation time in the presence of varying mutarotase concentrations, using a glucose oxidase/peroxidase method. The data (mean ± SEM) are expressed as of an estimated percentage of oxidized glucose of 10 replicates obtained from a 10 mM α-D-glucose standard. Black circles: absence of mutarotase; green circles: 0.3 nkat/L of mutarotase; red circles: 0.5 nkat/L and blue circles: 0.7 nkat/L.
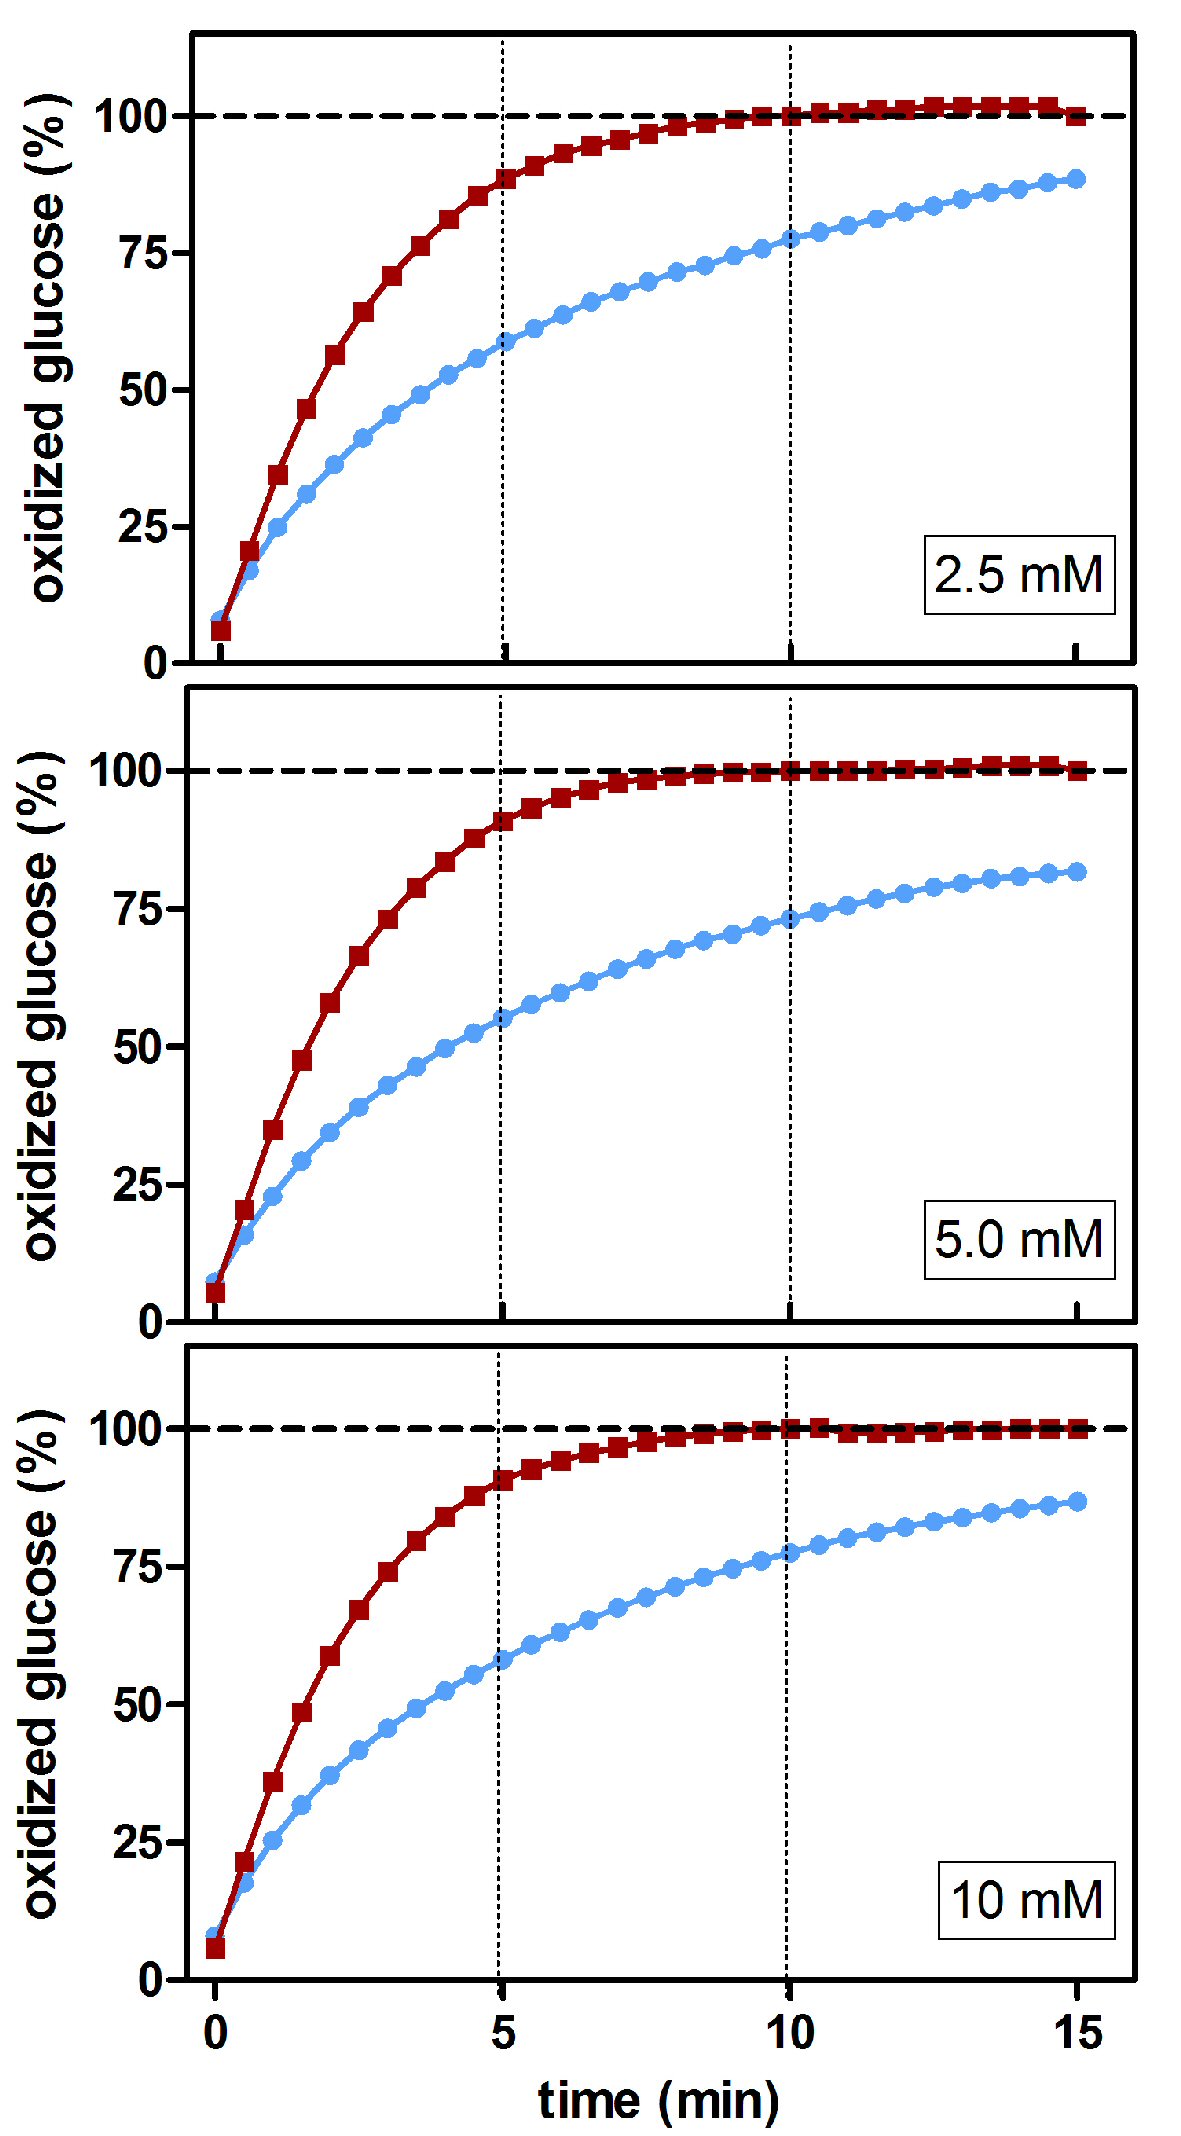
Figure 4. Estimated percentage of glucose oxidized during incubation at different glucose concentrations using a glucose/oxidase assay in the presence/absence of mutarotase. The data are expressed as an estimated percentage of oxidized glucose (calculated from the absorbance of the combined reaction). Data related to absence of mutarotase are represented in blue (line and circles); the data for mutarotase (0.5 nkat/L) are shown in red (line and squares).
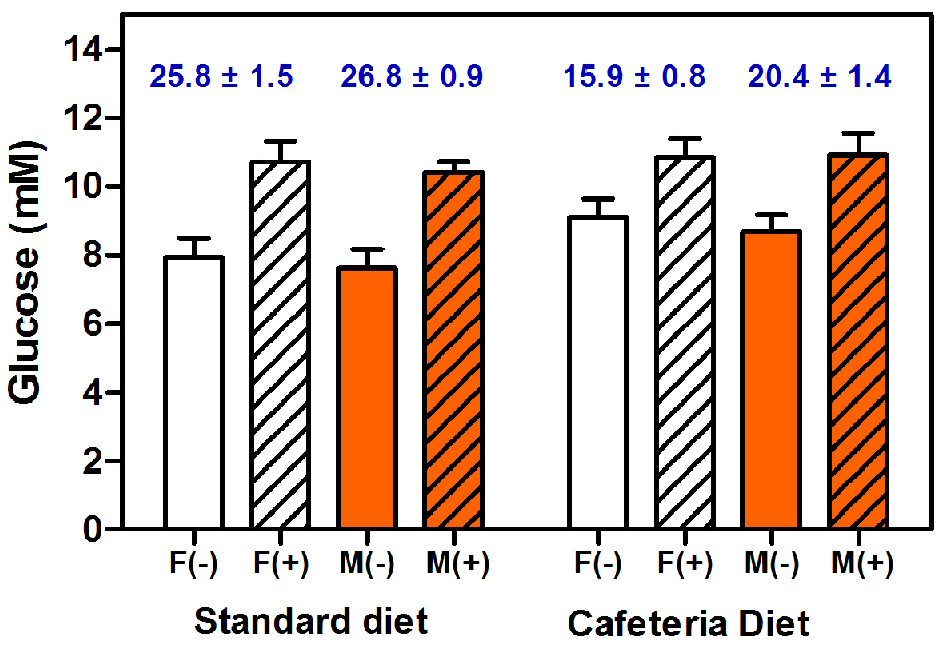
Figure 5. Plasma glucose concentrations of female and male rats fed with either standard chow or cafeteria diet. Glucose was measured with a glucose oxidase/peroxidase method in the absence or presence of added mutarotase. The data are expressed as mean ± SEM of six animals per group. White bars: females (F), orange bars: males (M). Results obtained in the presence of mutarotase (+) are shown as dashed columns; open columns have been used for the groups measurements in absence (-) of mutarotase. The numbers in blue at the top of each pair of same-sex and -diet columns show the estimated percentage of non-measured ɑ-glucose anomer, as a consequence of the absence of (enough) mutarotase. Statistical analysis of the differences between groups was done using two-way ANOVA. Significant differences were found between absence/presence of mutarotase (P < 0.0001). Diet elicited significant statistical differences only in the absence of mutarotase (P = 0.0477). Significant differences of unmeasured α-anomer were found between control and cafeteria groups (P < 0.0001). No differences were found for sex.