Figures
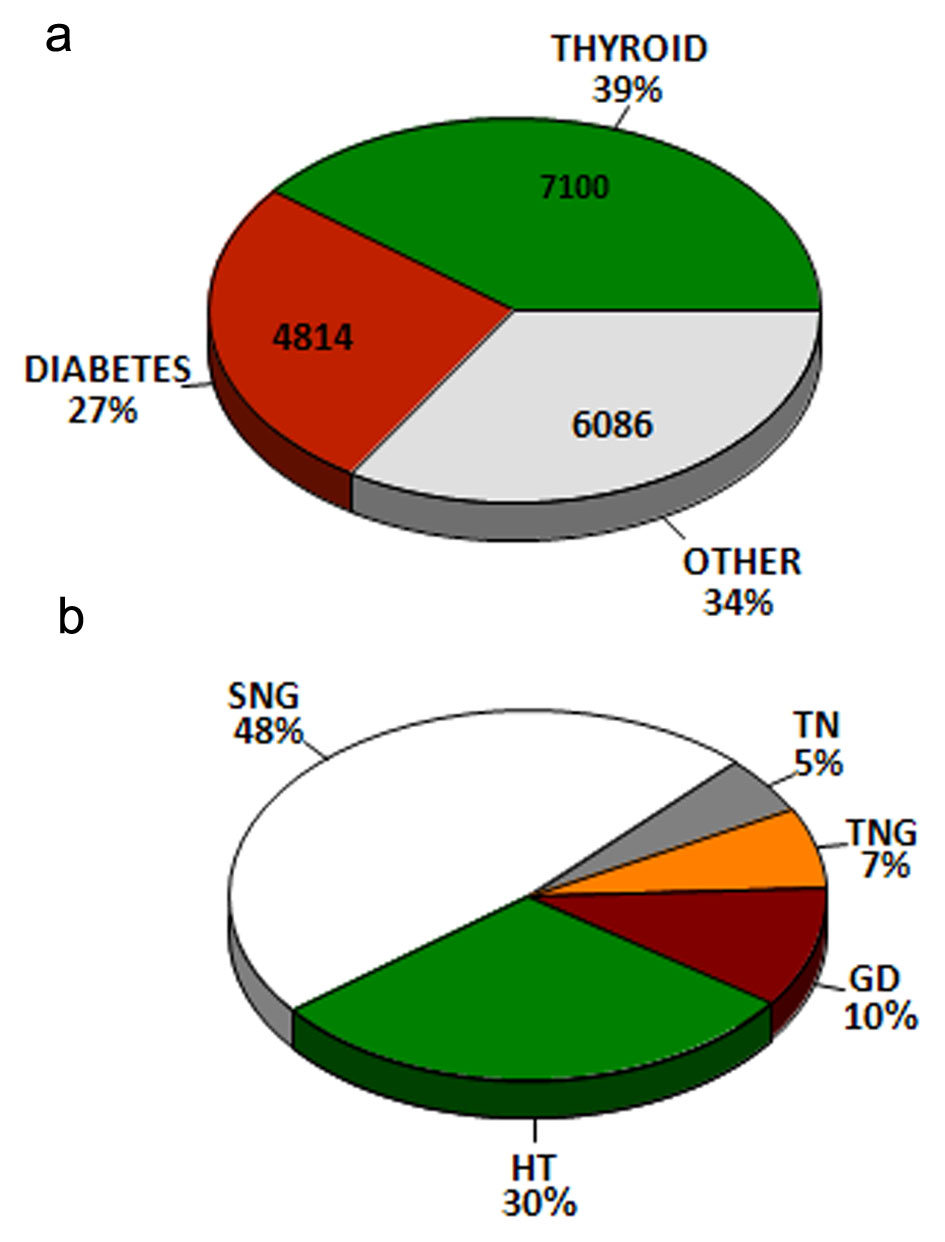
Figure 1. (a) Distribution of patient visits at the outpatient endocrine department between 2005 and 2016. Absolute numbers are indicated within the pie and percent numbers outside. (b) Thyroid diagnostics for patient visits at the outpatient endocrine department between 2005 and 2016. GD: Graves’ disease; HT; Hashimoto’s thyroiditis; SNG: simple nodular goiter; TN: thyroid neoplasia; TNG: toxic nodular goiter.
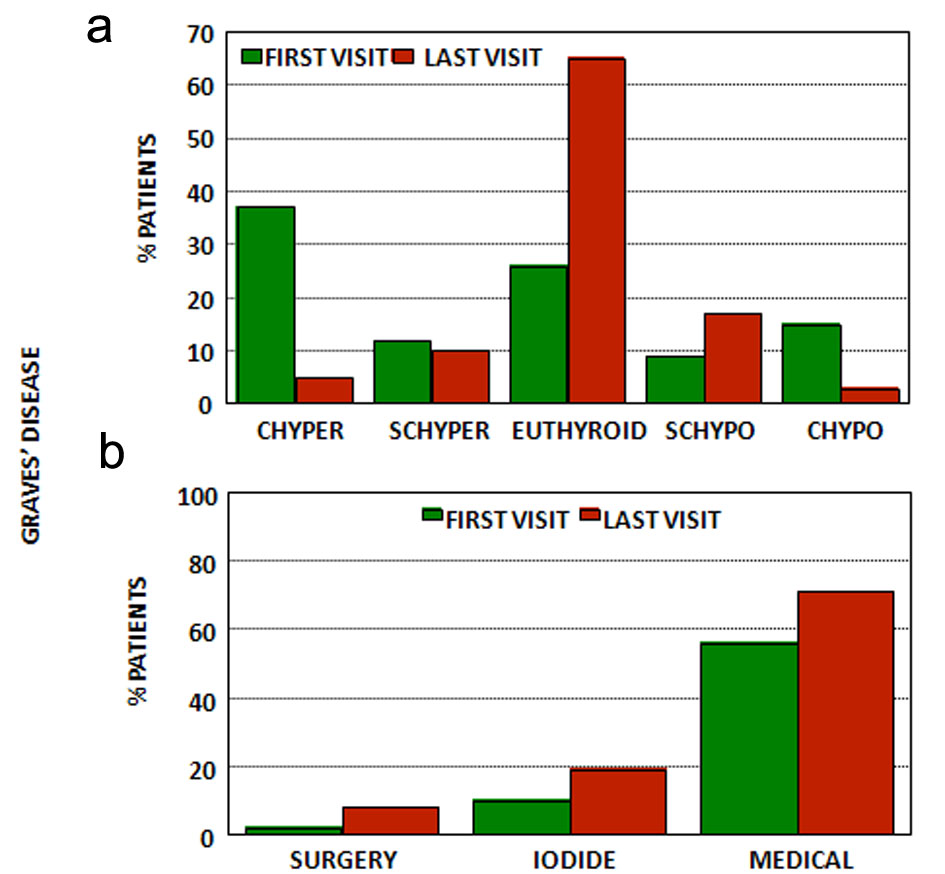
Figure 2. (a) Thyroid function at first and last visits for patients with Graves’ disease. (b) Treatment at first and last visits for patients with Graves’ disease. CHyper: clinical hyperthyroidism; SCHyper: subclinical hyperthyroidism; Euthyroid: euthyroidism; SCHypo: subclinical hypothyroidism; CHypo: clinical hypothyroidism; Iodide: radioactive iodide; medical treatment: anti-thyroid drugs and/or levothyroxine (see text).
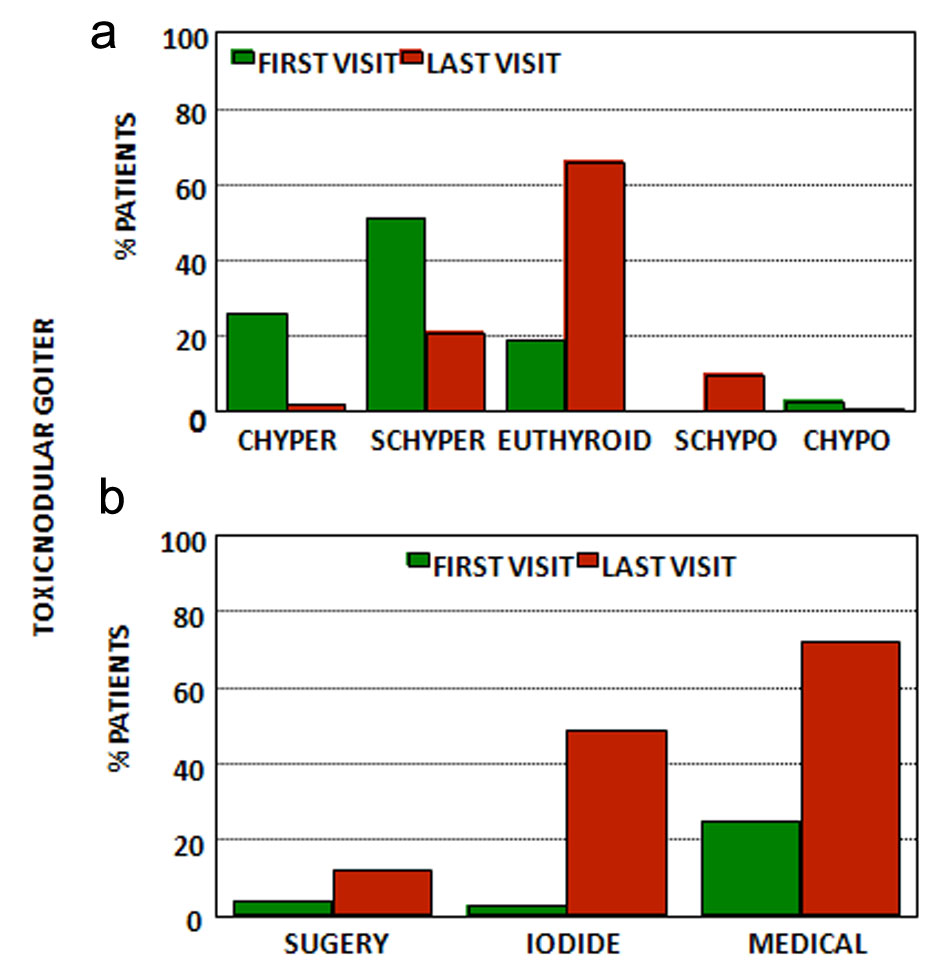
Figure 3. (a) Thyroid function at first and last visits for patients with toxic nodular goiter. (b) Treatment at first and last visits for patients with toxic nodular goiter. CHyper: clinical hyperthyroidism; SCHyper: subclinical hyperthyroidism; euthyroid: euthyroidism; SCHypo: subclinical hypothyroidism; CHypo: clinical hypothyroidism; iodide: radioactive iodide; medical treatment: anti-thyroid drugs and/or levothyroxine (see text).
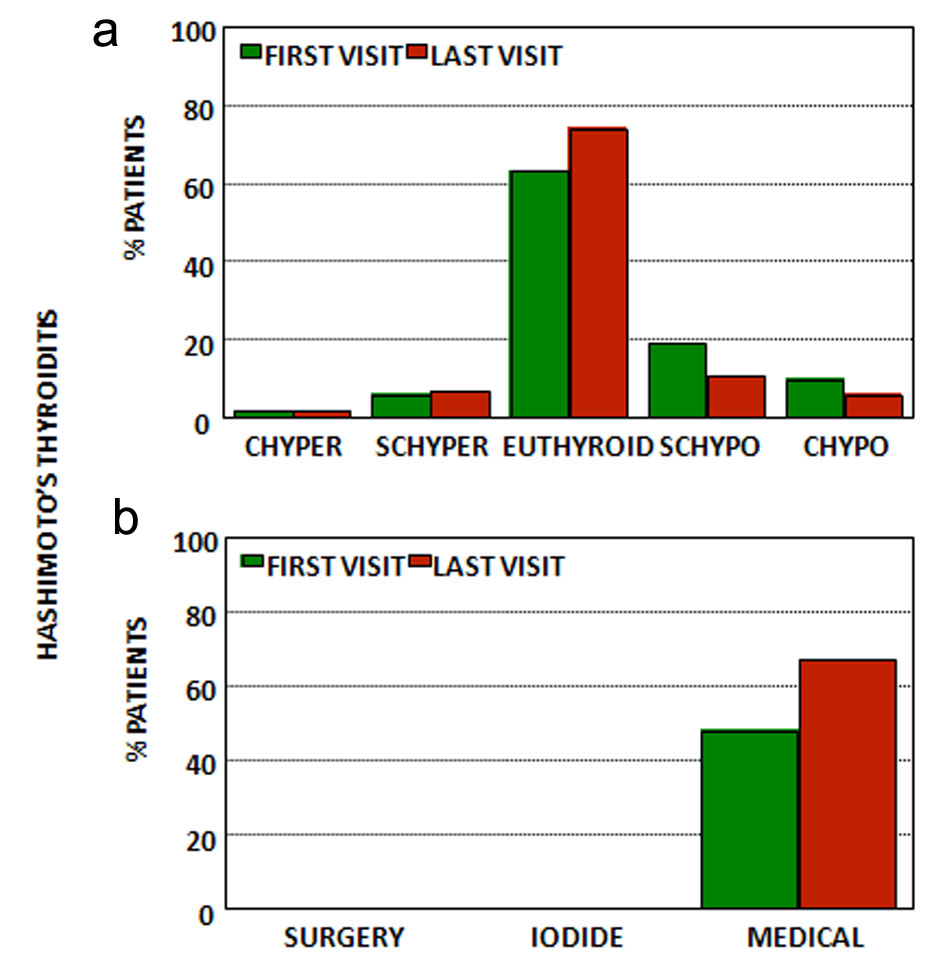
Figure 4. (a) Thyroid function at first and last visits for patients with Hashimoto’s thyroiditis. (b) Treatment at first and last visits for patients with Hashimoto’s thyroiditis. CHyper: clinical hyperthyroidism; SCHyper: subclinical hyperthyroidism; euthyroid: euthyroidism; SCHypo: subclinical hypothyroidism; CHypo: clinical hypothyroidism; iodide: radioactive iodide; medical treatment: anti-thyroid drugs and/or levothyroxine (see text).
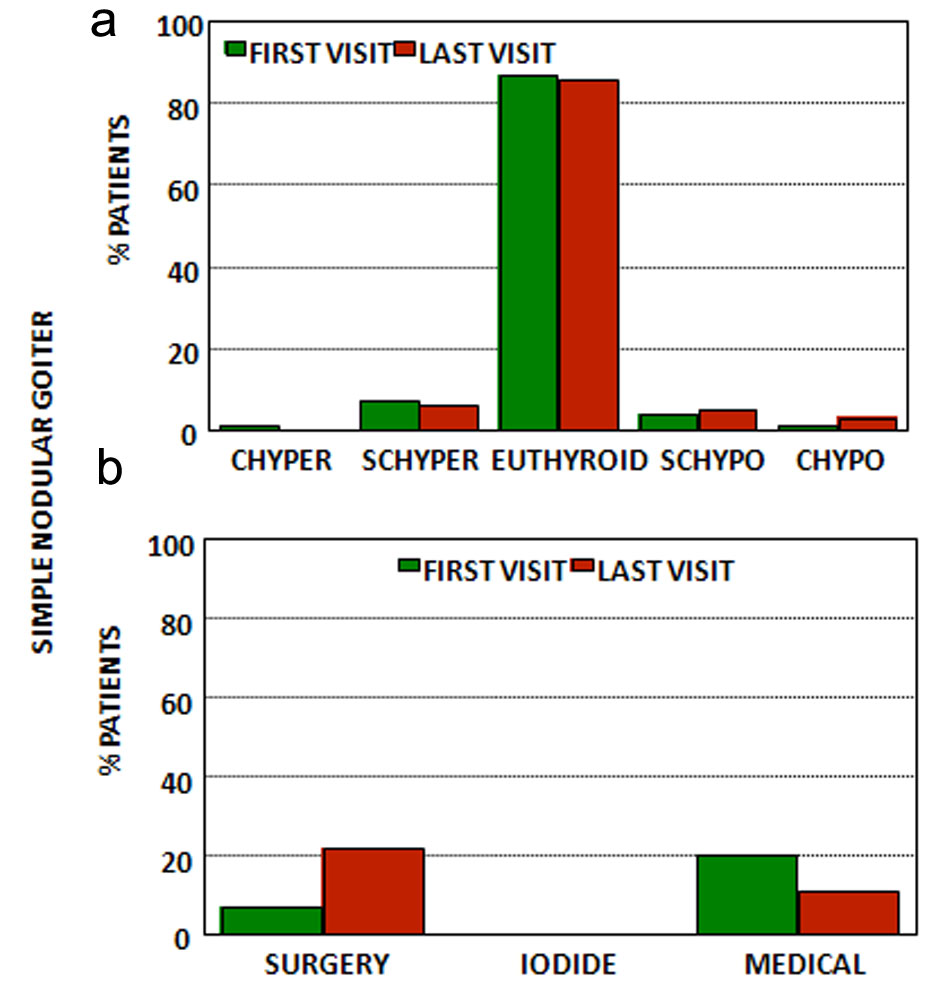
Figure 5. (a) Thyroid function at first and last visits for patients with simple nodular goiter. (b) Treatment at first and last visits for patients with simple nodular goiter. CHyper: clinical hyperthyroidism; SCHyper: subclinical hyperthyroidism; euthyroid: euthyroidism; SCHypo: subclinical hypothyroidism; CHypo: clinical hypothyroidism; iodide: radioactive iodide; medical treatment: anti-thyroid drugs and/or levothyroxine (see text).
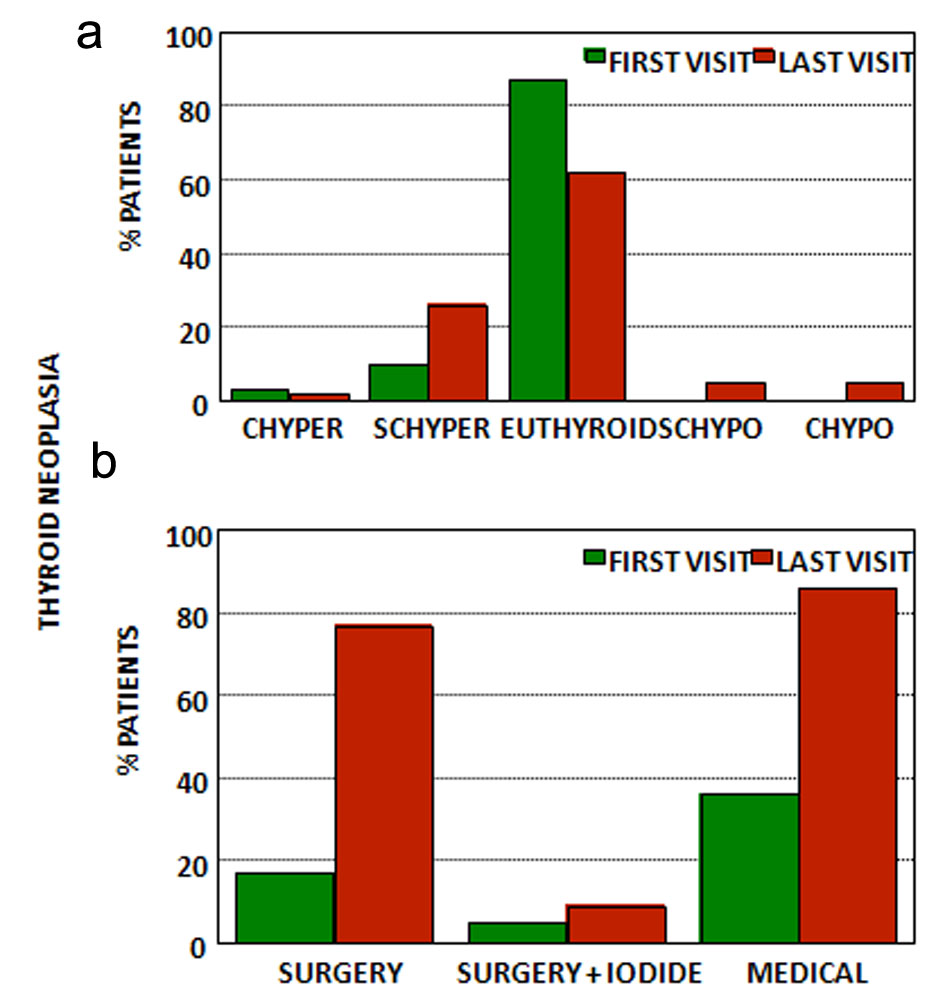
Figure 6. (a) Thyroid function at first and last visits for patients with thyroid neoplasia. (b) Treatment at first and last visits for patients with thyroid neoplasia. CHyper: clinical hyperthyroidism; SCHyper: subclinical hyperthyroidism; euthyroid: euthyroidism; SCHypo: subclinical hypothyroidism; CHypo: clinical hypothyroidism; iodide: radioactive iodide; medical treatment: anti-thyroid drugs and/or levothyroxine (see text).
Tables
Table 1. Common General Characteristics Across Diagnostic Groups
| GD | TNG | HT | SNG | TN |
|---|
| GD: Graves’ disease; TNG: toxic nodular goiter; HT: Hashimoto’s thyroiditis; SNG: simple nodular goiter; TN: thyroid neoplasia. |
| N | 123 | 83 | 348 | 565 | 60 |
| Sex-female (%) | 81 | 86 | 90 | 90 | 88 |
| Age (years) | 44 ± 16 | 61 ± 14 | 51 ± 17 | 56 ± 15 | 53 ± 14 |
| New cases (%) | 69 | 85 | 69 | 77 | 67 |
| Year of diagnosis | 2004 ± 12 | 2007 ± 4 | 2005 ± 8 | 2009 ± 7 | 2007 ± 6 |
| Year of first visit | 2009 ± 5 | 2010 ± 4 | 2010 ± 6 | 2010 ± 5 | 2010 ± 5 |
| Treatment at the first visit (%) | 68 | 25 | 48 | 20 | 46 |
| Thyroid dysfunction at first visit (%) | 74 | 78 | 37 | 13 | 13 |
| T3/4 (no dimensional) | 24.6 ± 22.5 | 17.5 ± 6.2 | 15.8 ± 5.9 | 15.5 ± 3.8 | 14.7 ± 4.9 |
| Tg (ng/mL) | 225 ± 422 | 263 ± 475 | 93 ± 442 | 123 ± 323 | 782 ± 2,188 |
| Calcitonin (pg/mL) | 1.9 ± 1.0 | 3.9 ± 5.1 | 2.7 ± 1.6 | 3.1 ± 2.8 | 574 ± 3,380 |
| Year at last visit | 2014 ± 3 | 2014 ± 3 | 2014 ± 3 | 2014 ± 3 | 2014 ± 3 |
| N of appointments | 8 ± 6 | 6 ± 4 | 7 ± 4 | 5 ± 3 | 6 ± 4 |
| Time since diagnosis at the last visit (years) | 9 ± 9 (1-37) | 5 ± 7 (1-41) | 8 ± 8 (1-41) | 6 ± 7 (1-33) | 7 ± 6 (1-22) |
| Treatment at the last visit (%) | 71 | 76 | 67 | 33 | 86 |
| Retained (%) | 60 | 66 | 66 | 68 | 64 |
| Follow-up (years) | 5 ± 5 | 4 ± 3 | 5 ± 4 | 6 ± 7 | 5 ± 4 |
| Euthyroid (%) | 65 | 65 | 74 | 86 | 62 |
Table 2. Graves’ Disease (n = 123)
| First visit | Last visit | P |
|---|
| T3: triiodothyronine; T4: thyroxine; TSH: thyroid stimulating hormone; fT4: free thyroxine; TPOAb: thyroid peroxidase antibody; TgAb: thyroglobulin antibody; TRAb: TSH receptor antibody; Tg: thyroglobulin. |
| 2009 ± 5 | 2014 ± 3 | |
| Sex | Female 81% | | |
| Age (years) | 44 ± 16 | | |
| T3 (ng/dL) | 207 ± 176 | 125 ± 74 | < 0.05 |
| T4 (µg/dL) | 10.5 ± 6.8 | 8.9 ± 2.8 | < 0.05 |
| FT4 (ng/dL) | 1.8 ± 1.8 | 1.3 ± 0.7 | < 0.05 |
| TSH (µU/mL) | 8.6 ± 26.6 | 4.5 ± 9.8 | < 0.05 |
| TPOAb (U/mL) | 2,024 ± 12,176 | 745 ± 2,220 | < 0.05 |
| TgAb (U/mL) | 204 ± 458 | 213 ± 565 | |
| TRAb (U/L) | 28 ± 61 | 23 ± 15 | < 0.05 |
| Tg (ng/mL) | 225 ± 422 | 60 ± 101 | |
| T3/T4 (no dimensional) | 24.6 ± 22.5 | 14.1 ± 4.8 | < 0.05 |
| Enlarged thyroid (%) | 61% | | |
| Thyroid nodules (%) | 43% | | |
Table 3. Toxic Nodular Goiter (n = 82)
| First visit | Last visit | P |
|---|
| T3: triiodothyronine; T4: thyroxine; TSH: thyroid stimulating hormone; fT4: free thyroxine; TPOAb: thyroid peroxidase antibody; TgAb: thyroglobulin antibody; Tg: thyroglobulin. |
| 2010 ± 4 | 2014 ± 3 | |
| Sex | Female 86% | | |
| Age (years) | 61 ± 14 | | |
| T3 (ng/dL) | 172 ± 101 | 118 ± 34 | < 0.05 |
| T4 (µg/dL) | 9.9 ± 3.9 | 10.2 ± 14.7 | |
| FT4 (ng/dL) | 1.8 ± 2.0 | 1.2 ± 0.4 | < 0.05 |
| TSH (µU/mL) | 0.9 ± 4.1 | 2.0 ± 3.4 | |
| TPOAb (U/mL) | 43 ± 132 | 20 ± 17 | |
| TgAb (U/mL) | 33 ± 91 | 20 ± 21 | < 0.05 |
| Tg (ng/mL) | 263 ± 475 | 113 ± 185 | |
| T3/T4 (no dimensional) | 17.5 ± 6.2 | 14.2 ± 4.6 | < 0.05 |
| Enlarged thyroid (%) | 71% | | |
| Thyroid nodules (%) | 97% | | |
Table 4. Hashimoto’s Thyroiditis (n = 349)
| First visit | Last visit | P |
|---|
| T3: triiodothyronine; T4: thyroxine; TSH: thyroid stimulating hormone; fT4: free thyroxine; TPOAb: thyroid peroxidase antibody; TgAb: thyroglobulin antibody; Tg: thyroglobulin. |
| 2010 ± 6 | 2014 ± 3 | |
| Sex | Female 90% | | |
| Age (years) | 51 ± 17 | | |
| T3 (ng/dL) | 131 ± 45 | 109 ± 32 | < 0.05 |
| T4 (µg/dL) | 8.7 ± 2.5 | 8.6 ± 2.4 | |
| FT4 (ng/dL) | 1.3 ± 3.3 | 1.3 ± 0.6 | |
| TSH (µU/mL) | 7.7 ± 29.2 | 3.9 ± 9.1 | < 0.05 |
| TPOAb (U/mL) | 973 ± 4,237 | 538 ± 1,950 | |
| TgAb (U/mL) | 775 ± 4,070 | 501 ± 2,402 | < 0.05 |
| Tg (ng/mL) | 93 ± 442 | 50 ± 240 | |
| T3/T4 (no dimensional) | 15.8 ± 5.9 | 14.1 ± 15.6 | < 0.05 |
| Enlarged thyroid (%) | 34% | | |
| Decreased thyroid (%) | 9% | | |
| Nodules (%) | 70% | | |
Table 5. Simple Nodular Goiter (n = 563)
| First visit | Last visit | P |
|---|
| T3: triiodothyronine; T4: thyroxine; TSH: thyroid stimulating hormone; fT4: free thyroxine; Tg: thyroglobulin; B: benign; ND: non-diagnostic. |
| 2010 ± 5 | 2014 ± 3 | |
| Sex | Female 90% | | |
| Age (years) | 56 ± 15 | | |
| T3 (ng/dL) | 132 ± 37 | 111 ± 26 | < 0.05 |
| T4 (µg/dL) | 8.6 ± 1.8 | 8.8 ± 6.0 | |
| FT4 (ng/dL) | 1.2 ± 0.4 | 1.2 ± 0.6 | |
| TSH (µU/mL) | 2.0 ± 3.6 | 2.5 ± 5.0 | |
| Tg (ng/mL) | 124 ± 324 | 86 ± 391 | |
| T3/T4 (no dimensional) | 15.5 ± 3.8 | 13.6 ± 4.6 | < 0.05 |
| Enlarged thyroid (%) | 50% | | |
| Nodules (%) | 97% | | |
| Cytology | B 97%, ND 8% | | |
Table 6. Thyroid Neoplasia (n = 61)
| First visit | Last visit | P |
|---|
| T3: triiodothyronine; T4: thyroxine; TSH: thyroid stimulating hormone; fT4: free thyroxine; TPOAb: thyroid peroxidase antibody; TgAb: thyroglobulin antibody; Tg: thyroglobulin. |
| 2010 ± 5 | 2014 ± 3 | |
| Sex | Female 88% | | |
| Age (years) | 53 ± 14 | | |
| T3 (ng/dL) | 129 ± 40 | 104 ± 26 | < 0.05 |
| T4 (µg/dL) | 9.1 ± 3.2 | 10.9 ± 11.4 | |
| FT4 (ng/dL) | 1.2 ± 0.3 | 1.4 ± 0.4 | |
| TSH (µU/mL) | 1.5 ± 1.3 | 2.5 ± 4.8 | |
| TPOAb (U/mL) | 190 ± 734 | 150 ± 874 | |
| TgAb (U/mL) | 43 ± 66 | 22 ± 35 | < 0.05 |
| Tg (ng/mL) | 882 ± 2,249 | 27 ± 95 | < 0.05 |
| Calcitonin (pg/mL) | 558 ± 3,332 | 19 ± 96 | < 0.05 |
| T3/T4 (no dimensional) | 14.7 ± 4.9 | 11.4 ± 3.4 | < 0.05 |
| Enlarged thyroid (%) | 53% | | |
| Nodules (%) | 87% | | |
| Cytology | Neoplasia 66% | | |