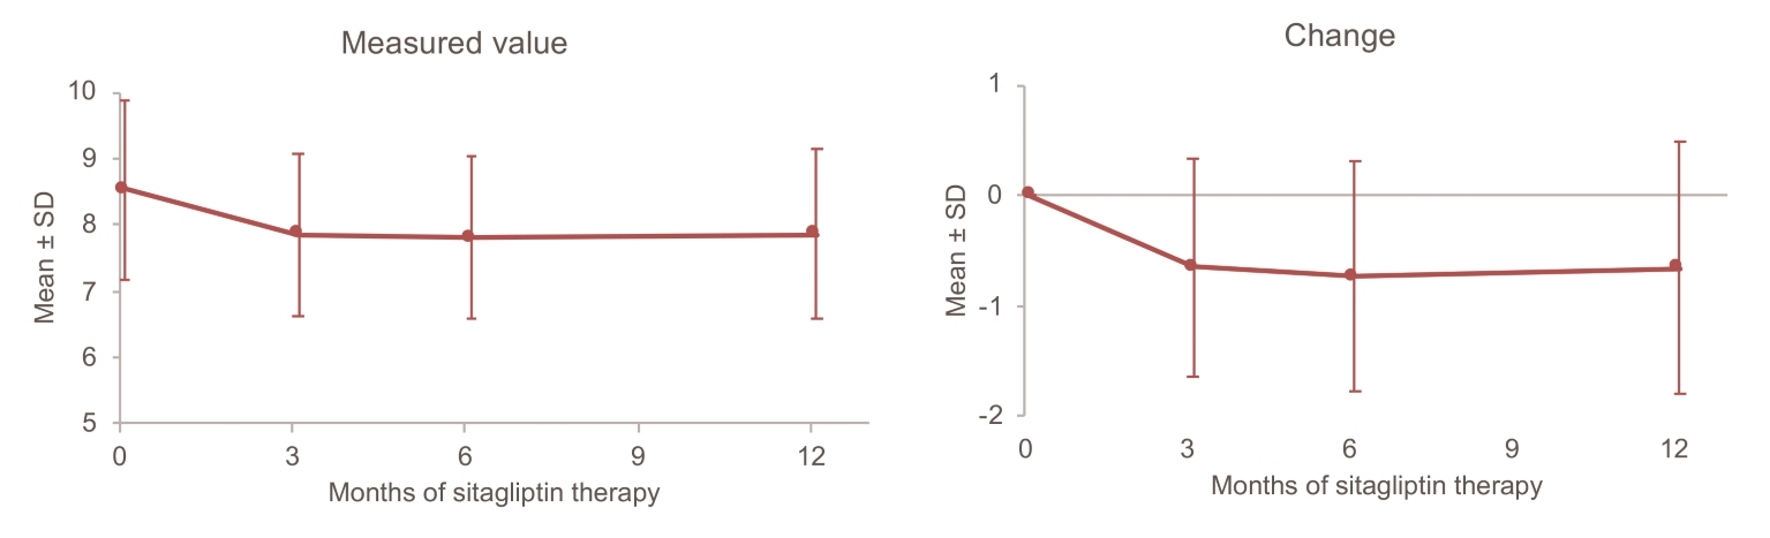
Figure 1. Changes in HbA1c up to 12 months. SD: standard deviation.
| Journal of Endocrinology and Metabolism, ISSN 1923-2861 print, 1923-287X online, Open Access |
| Article copyright, the authors; Journal compilation copyright, J Endocrinol Metab and Elmer Press Inc |
| Journal website http://www.jofem.org |
Original Article
Volume 8, Number 6, December 2018, pages 126-138
Add-On Sitagliptin Therapy for Insulin-Treated Type 2 Diabetes: An Analysis of Hemoglobin A1c and Other Variables Using ASSIST-K Follow-Up Data
Figures
Tables
| Patients receiving insulin | Patients included in factor analysis | |
|---|---|---|
| Men: 194 × serum creatinine-1.094 × age-0.287; Women: 194 × serum creatinine-1.094 × age-0.287 × 0.739. Data are shown as the mean ± standard deviation unless otherwise noted. eGFR: estimated glomerular filtration rate; HbA1c: hemoglobin A1c; NGSP: National Glycohemoglobin Standardization Program. | ||
| No. of patients | 937 (100.0%) | 412 (100.0%) |
| Sex | ||
| Male | 508 (54.2%) | 216 (52.4%) |
| Female | 429 (45.8%) | 196 (47.6%) |
| Age at registration | 63.9 ± 12.3 | 64.2 ± 12.1 |
| Diabetic complications | ||
| Retinopathy | ||
| No | 508 (54.2%) | 238 (57.8%) |
| Yes | 315 (33.6%) | 174 (42.2%) |
| Unknown | 114 (12.2%) | 0 (0.0%) |
| Neuropathy | ||
| No | 496 (52.9%) | 221 (53.6%) |
| Yes | 324 (34.6%) | 191 (46.4%) |
| Unknown | 117 (12.5%) | 0 (0.0%) |
| Nephropathy | ||
| No | 457 (48.8%) | 207 (50.2%) |
| Yes | 367 (39.2%) | 205 (49.8%) |
| Unknown | 113 (12.1%) | 0 (0.0%) |
| Atherosclerotic diseases | ||
| Cerebrovascular disease | ||
| No | 731 (78.0%) | 378 (91.7%) |
| Yes | 72 (7.7%) | 34 (8.3%) |
| Unknown | 134 (14.3%) | 0 (0.0%) |
| Myocardial infarction/Angina | ||
| No | 647 (69.1%) | 324 (78.6%) |
| Yes | 162 (17.3%) | 88 (21.4%) |
| Unknown | 128 (13.7%) | 0 (0.0%) |
| Arteriosclerosis obliterans | ||
| No | 702 (74.9%) | 353 (85.7%) |
| Yes | 87 (9.3%) | 59 (14.3%) |
| Unknown | 148 (15.8%) | 0 (0.0%) |
| Other complications | ||
| Hypertension | ||
| No | 325 (34.7%) | 154 (37.4%) |
| Yes | 531 (56.7%) | 258 (62.6%) |
| Unknown | 81 (8.6%) | 0 (0.0%) |
| Dyslipidemia | ||
| No | 274 (29.2%) | 128 (31.1%) |
| Yes | 588 (62.8%) | 284 (68.9%) |
| Unknown | 75 (8.0%) | 0 (0.0%) |
| Duration of diabetes (years) | ||
| 17.0 ± 9.2 | 16.9 ± 9.0 | |
| N | 795 | 412 |
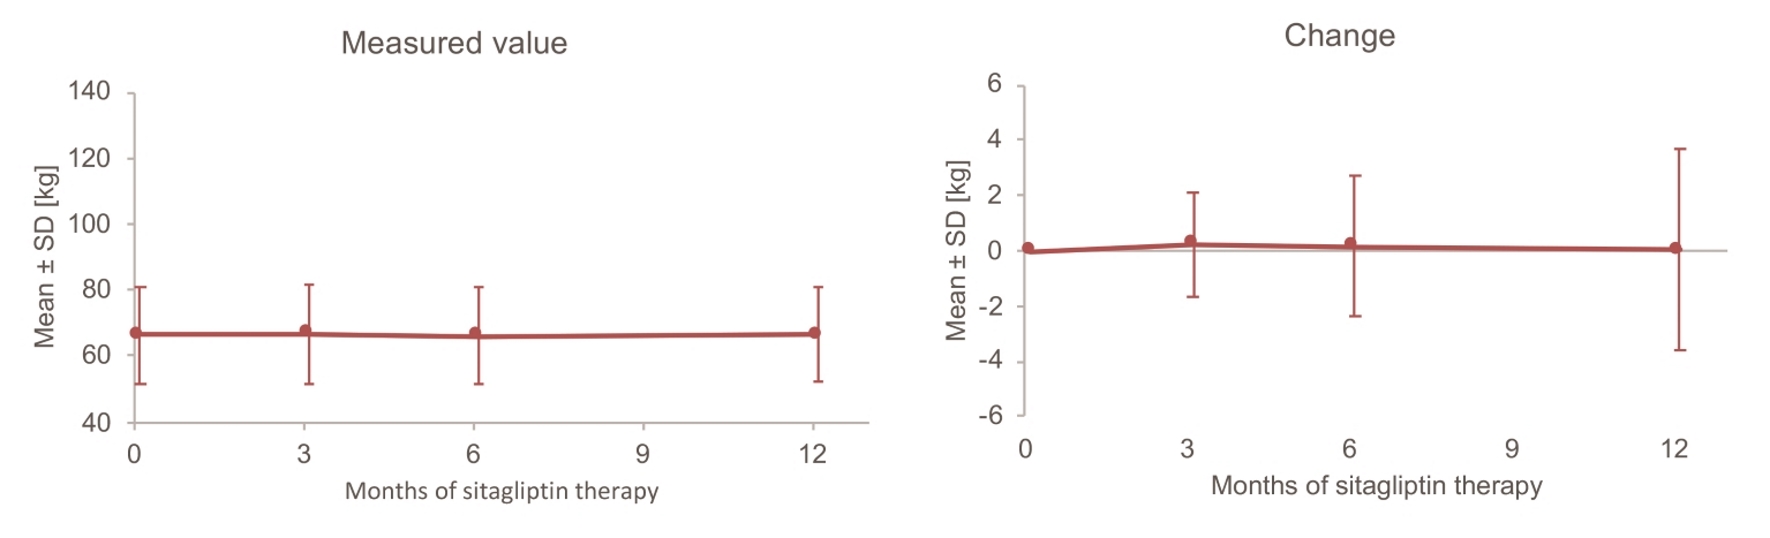
| Baseline body weight | ||
| 66.23 ± 15.51 | 66.36 ± 14.75 | |
| N | 936 | 412 |
| Baseline body mass index | ||
| 25.38 ± 4.61 | 25.48 ± 4.40 | |
| N | 906 | 412 |
| Baseline HbA1c (NGSP, %) | ||
| 8.50 ± 1.35 | 8.53 ± 1.35 | |
| N | 922 | 412 |
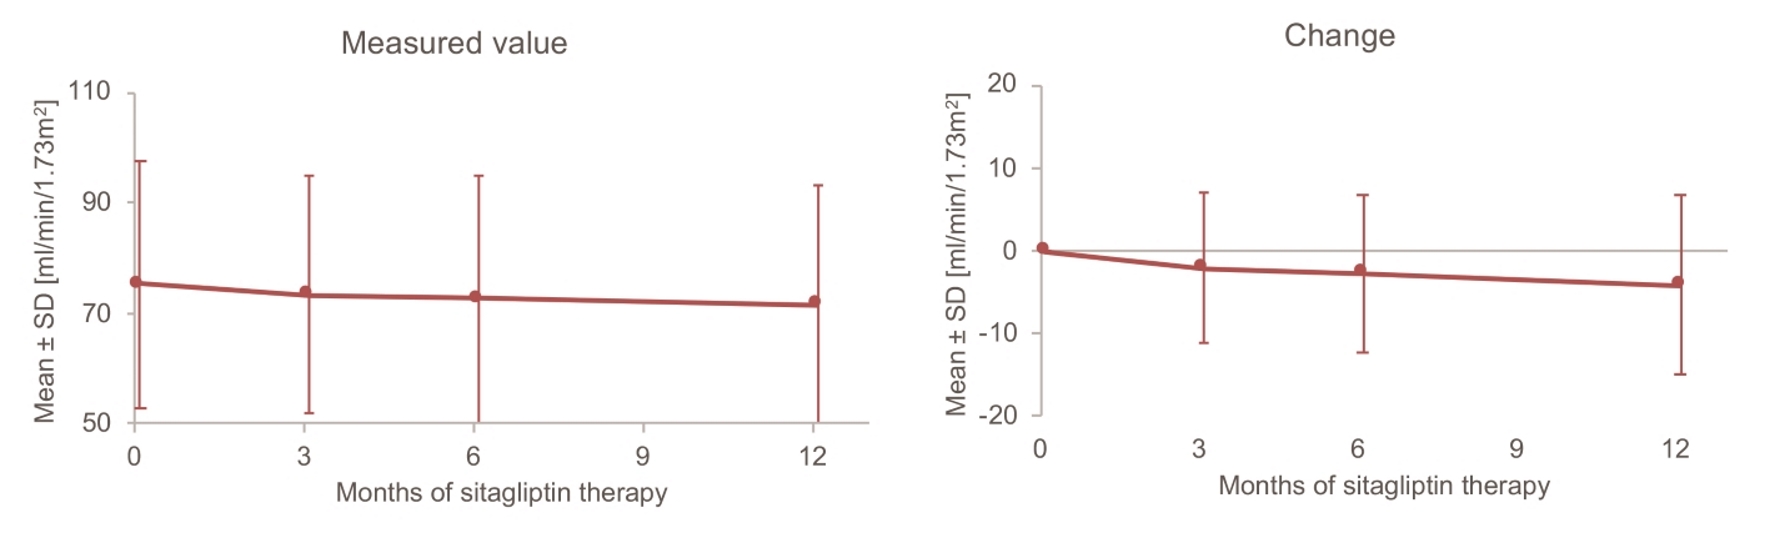
| Baseline eGFR (mL/min/1.73 m2) | ||
| 75.9 ± 22.9 | 75.3 ± 22.5 | |
| N | 675 | 412 |
| Before sitagliptin | At initiation of sitagliptin | After 12 months of sitagliptin | |
|---|---|---|---|
| OHA: oral hypoglycemic agent; SD: standard deviation. | |||
| No. of patients | 412 (100.0%) | 412 (100.0%) | 412 (100.0%) |
| Sitagliptin dose | |||
| Mean ± SD | - | 46.6 ± 9.6 | 52.0 ± 15.7 |
| N | - | 412 | 405 |
| Daily no. of insulin injections | |||
| 0 | 0 (0.0%) | 1 (0.2%) | 8 (1.9%) |
| 1 | 78 (18.9%) | 83 (20.1%) | 77 (18.7%) |
| 2 | 99 (24.0%) | 99 (24.0%) | 96 (23.3%) |
| 3 | 99 (24.0%) | 97 (23.5%) | 101 (24.5%) |
| 4 | 136 (33.0%) | 132 (32.0%) | 130 (31.6%) |
| Mean | 2.7 | 2.7 | 2.7 |
| OHAs | |||
| Sulfonylureas | 79 (19.2%) | 80 (19.4%) | 70 (17.0%) |
| Biguanides | 172 (41.7%) | 160 (38.8%) | 136 (33.0%) |
| Thiazolidinediones | 48 (11.7%) | 29 (7.0%) | 30 (7.3%) |
| Alpha-glucosidase inhibitors | 101 (24.5%) | 83 (20.1%) | 83 (20.1%) |
| Glinides | 5 (1.2%) | 0 (0.0%) | 0 (0.0%) |
| Number of concomitant OHAs | |||
| 0 | 159 (38.6%) | 179 (43.4%) | 199 (48.3%) |
| 1 | 136 (33.0%) | 134 (32.5%) | 117 (28.4%) |
| 2 | 87 (21.1%) | 80 (19.4%) | 86 (20.9%) |
| 3 or more | 30 (7.3%) | 19 (4.6%) | 10 (2.4%) |
| Mean | 1.0 | 0.9 | 0.8 |
| No. of adverse events (incidence rate), N = 412 | |
|---|---|
| Severe hypoglycemia | 14 (3.4%) |
| Gastrointestinal symptoms | 3 (0.7%) |
| Constipation | 13 (3.2%) |
| Others | 8 (1.9%) |
| HbA1c (%) change over 12 months | Univariate model | Initial multivariable model (univariate at P < 0.10) | Final multivariable model (stepwise section at P < 0.05) | |||||||||
|---|---|---|---|---|---|---|---|---|---|---|---|---|
| N | Mean | SD | PE | 95% CI | P value | PE | 95% CI | P value | PE | 95% CI | P value | |
| Factors investigated: age at registration, sex, diabetic complications (retinopathy, neuropathy, and nephropathy), atherosclerotic diseases (cerebrovascular disease, myocardial infarction/angina, and arteriosclerosis obliterans), other complications (hypertension and dyslipidemia), duration of diabetes, baseline profile (body weight, body mass index, HbA1c, serum creatinine, and eGFR), and baseline concomitant antidiabetic agents (daily no. of insulin injections and use of sulfonylureas, biguanides, thiazolidinediones, and alpha-glucosidase inhibitors). ANOVA: analysis of variance; CI: confidence interval; eGFR: estimated glomerular filtration rate; HbA1c: hemoglobin A1c; NGSP: National Glycohemoglobin Standardization Program; PE: point estimate; Ref: reference. *P < 0.050. | ||||||||||||
| Dyslipidemia | ||||||||||||
| No | 128 | -0.83 | 1.16 | Ref | - | - | Ref | - | - | Ref | - | - |
| Yes | 284 | -0.59 | 1.13 | 0.239 | 0.001, 0.477 | 0.049* | 0.307 | 0.085, 0.529 | 0.007* | 0.343 | 0.124, 0.563 | 0.002* |
| Duration of diabetes (years) | ||||||||||||
| 0.0 - < 10.0 | 87 | -0.97 | 1.57 | Ref | - | 0.027* | Ref | - | 0.485 | |||
| 10.0 - < 15.0 | 92 | -0.67 | 1.21 | 0.301 | -0.032, 0.634 | 0.077 | 0.172 | -0.135, 0.479 | 0.272 | |||
| 15.0 - < 22.0 | 121 | -0.54 | 0.88 | 0.435 | 0.122, 0.748 | 0.007* | 0.228 | -0.065, 0.520 | 0.127 | |||
| 22.0 - 48.0 | 112 | -0.54 | 0.89 | 0.431 | 0.113, 0.749 | 0.008* | 0.139 | -0.159, 0.437 | 0.359 | |||
| Baseline daily no. of insulin injections | ||||||||||||
| 0 - 1 | 84 | -0.94 | 1.39 | Ref | - | - | Ref | - | - | |||
| 2 - 4 | 328 | -0.59 | 1.06 | 0.355 | 0.082, 0.627 | 0.011* | 0.200 | -0.055, 0.454 | 0.124 | |||
| Baseline HbA1c (NGSP, %) | ||||||||||||
| 5.60 - < 7.50 | 94 | -0.15 | 0.54 | Ref | - | < 0.001* | Ref | - | < 0.001* | Ref | - | < 0.001* |
| 7.50 - < 8.30 | 106 | -0.46 | 0.70 | -0.313 | -0.604, -0.021 | 0.036* | -0.283 | -0.575, 0.008 | 0.057 | -0.268 | -0.558, 0.021 | 0.069 |
| 8.30 - < 9.30 | 108 | -0.58 | 1.11 | -0.437 | -0.728, -0.147 | 0.003* | -0.428 | -0.716, -0.139 | 0.004* | -0.415 | -0.702, -0.127 | 0.005* |
| 9.30 - 13.90 | 104 | -1.41 | 1.51 | -1.267 | -1.559, -0.974 | < 0.001* | -1.249 | -1.545, -0.953 | < 0.001* | -1.289 | -1.579, -0.999 | < 0.001* |
| Body weight (kg) Change over 12 months | Univariate model | Initial multivariable model (univariate at P < 0.10) | Final multivariable model (stepwise selection at P < 0.05) | |||||||||
|---|---|---|---|---|---|---|---|---|---|---|---|---|
| N | Mean | SD | PE | 95% CI | P value | PE | 95% CI | P value | PE | 95% CI | P value | |
| Factors investigated: age at registration, sex, diabetic complications (retinopathy, neuropathy, and nephropathy), atherosclerotic diseases (cerebrovascular disease, myocardial infarction/angina, and arteriosclerosis obliterans), other complications (hypertension and dyslipidemia), duration of diabetes, baseline profile (body weight, body mass index, HbA1c, serum creatinine, and eGFR), and baseline concomitant antidiabetic agents ( daily no. of insulin injections and use of sulfonylureas, biguanides, thiazolidinediones, and alpha-glucosidase inhibitors). ANOVA: analysis of variance; CI: confidence interval; eGFR: estimated glomerular filtration rate; HbA1c: hemoglobin A1c; NGSP: National Glycohemoglobin Standardization Program; PE: point estimate; Ref: reference. *P < 0.05, **P < 0.01 and ***P < 0.001. | ||||||||||||
| Myocardial infarction/angina | ||||||||||||
| No | 316 | 0.25 | 3.63 | Ref | - | - | Ref | - | - | |||
| Yes | 88 | -0.71 | 3.62 | -0.955 | -1.814, -0.096 | 0.030* | -0.693 | -1.546, 0.160 | 0.111 | |||
| Hypertension | ||||||||||||
| No | 151 | 0.63 | 3.67 | Ref | - | - | Ref | - | - | |||
| Yes | 253 | -0.31 | 3.58 | -0.940 | -1.672, -0.209 | 0.012* | -0.573 | -1.312, 0.165 | 0.128 | |||
| Baseline daily no. of insulin injections | ||||||||||||
| 0 - 1 | 81 | 0.65 | 4.37 | Ref | - | - | Ref | - | - | |||
| 2 - 4 | 323 | -0.12 | 3.43 | -0.771 | -1.658, 0.117 | 0.089 | -0.321 | -1.205, 0.563 | 0.476 | |||
| Baseline biguanide use | ||||||||||||
| No | 247 | 0.47 | 3.73 | Ref | - | - | Ref | - | - | |||
| Yes | 157 | -0.64 | 3.40 | -1.109 | -1.832, -0.385 | 0.003** | -0.634 | -1.379, 0.112 | 0.096 | |||
| Baseline body weight (kg) | ||||||||||||
| 36.9 - < 56.4 | 101 | 0.79 | 3.43 | Ref | - | 0.036* | Ref | - | 0.597 | |||
| 56.4 - < 64.9 | 100 | 0.25 | 2.71 | -0.540 | -1.543, 0.464 | 0.291 | -0.241 | -1.343, 0.862 | 0.668 | |||
| 64.9 - < 74.5 | 102 | -0.31 | 3.84 | -1.098 | -2.097, -0.100 | 0.031* | -0.698 | -1.971, 0.575 | 0.282 | |||
| 74.5 - 119.5 | 101 | -0.58 | 4.29 | -1.374 | -2.374, -0.373 | 0.007** | -0.095 | -1.629, 1.439 | 0.903 | |||
| Baseline body mass index | ||||||||||||
| 13.6 - < 22.6 | 100 | 0.78 | 3.66 | Ref | - | < 0.001*** | Ref | - | 0.061 | Ref | - | < 0.001*** |
| 22.6 - < 25.2 | 100 | 0.14 | 2.40 | -0.634 | -1.629, 0.361 | 0.211 | -0.057 | -1.203, 1.089 | 0.922 | -0.612 | -1.591, 0.367 | 0.220 |
| 25.2 - < 27.9 | 103 | 0.43 | 3.98 | -0.345 | -1.333, 0.642 | 0.492 | 0.205 | -1.083, 1.493 | 0.755 | -0.424 | -1.401, 0.553 | 0.394 |
| 27.9 - 43.8 | 101 | -1.19 | 4.02 | -1.969 | -2.962, -0.977 | < 0.001*** | -1.368 | -2.943, 0.206 | 0.088 | -1.984 | -2.971, -0.997 | < 0.001*** |
| Baseline HbA1c (NGSP, %) | ||||||||||||
| 5.60 - < 7.55 | 101 | -0.11 | 3.39 | Ref | - | 0.001** | Ref | - | 0.014* | Ref | - | 0.001** |
| 7.55 - < 8.40 | 100 | -0.18 | 2.30 | -0.072 | -1.065, 0.922 | 0.887 | 0.162 | -0.825, 1.148 | 0.747 | 0.013 | -0.965, 0.991 | 0.980 |
| 8.40 - < 9.30 | 99 | -0.78 | 4.13 | -0.672 | -1.668, 0.324 | 0.186 | -0.298 | -1.290, 0.694 | 0.555 | -0.393 | -1.384, 0.598 | 0.436 |
| 9.30 - 13.90 | 104 | 1.18 | 4.17 | 1.294 | 0.309, 2.278 | 0.010* | 1.258 | 0.266, 2.249 | 0.013* | 1.460 | 0.485, 2.435 | 0.003** |
| eGFR (mL/min/1.73 m2) change over 12 months | Univariate model | Initial multivariable model (univariate at P < 0.10) | Final multivariable model (stepwise selection at P < 0.05) | |||||||||
|---|---|---|---|---|---|---|---|---|---|---|---|---|
| N | Mean | SD | PE | 95% CI | P value | PE | 95% CI | P value | PE | 95% CI | P value | |
| Factors investigated: age at registration, sex, diabetic complications (retinopathy, neuropathy, and nephropathy), atherosclerotic diseases (cerebrovascular disease, myocardial infarction/angina, and arteriosclerosis obliterans), other complications (hypertension and dyslipidemia), duration of diabetes, baseline profile (body weight, body mass index, HbA1c, serum creatinine, and eGFR), and baseline concomitant antidiabetic agents (daily no. of insulin injections and use of sulfonylureas, biguanides, thiazolidinediones, and alpha-glucosidase inhibitors). ANOVA: analysis of variance; CI: confidence interval; eGFR: estimated glomerular filtration rate; HbA1c: hemoglobin A1c; NGSP: National Glycohemoglobin Standardization Program; PE: point estimate; Ref: reference. *P < 0.05, **P < 0.01 and ***P < 0.001. | ||||||||||||
| Myocardial infarction/angina | ||||||||||||
| No | 226 | -4.62 | 11.14 | Ref | - | - | Ref | - | - | |||
| Yes | 55 | -1.91 | 9.50 | 2.714 | -0.496, 5.924 | 0.097 | 1.546 | -1.688, 4.779 | 0.347 | |||
| Dyslipidemia | ||||||||||||
| No | 81 | -6.05 | 10.80 | Ref | - | - | Ref | - | - | Ref | - | - |
| Yes | 200 | -3.30 | 10.84 | 2.757 | -0.049, 5.564 | 0.054 | 2.851 | 0.065, 5.637 | 0.045* | 3.163 | 0.443, 5.883 | 0.023* |
| Baseline daily no. of insulin injections | ||||||||||||
| 0 - 1 | 65 | -7.49 | 11.79 | Ref | - | - | Ref | - | - | |||
| 2 - 4 | 216 | -3.07 | 10.40 | 4.421 | 1.431, 7.411 | 0.004** | 0.657 | -2.815, 4.130 | 0.710 | |||
| Baseline sulfonylurea use | ||||||||||||
| No | 218 | -3.14 | 10.88 | Ref | - | - | Ref | - | - | Ref | - | - |
| Yes | 63 | -7.40 | 10.28 | -4.262 | -7.289, -1.234 | 0.006** | -3.986 | -7.408, -0.564 | 0.023* | -4.199 | -7.087, -1.310 | 0.005** |
| Baseline body weight (kg) | ||||||||||||
| 36.9 - < 57.2 | 70 | -6.79 | 13.65 | Ref | - | 0.040* | Ref | - | 0.200 | Ref | - | 0.019* |
| 57.2 - < 65.2 | 68 | -2.35 | 10.60 | 4.439 | 0.827, 8.051 | 0.016* | 3.448 | -0.364, 7.259 | 0.076 | 4.571 | 1.138, 8.003 | 0.009** |
| 65.2 - < 74.0 | 70 | -2.31 | 9.28 | 4.485 | 0.900, 8.070 | 0.014* | 3.083 | -1.289, 7.455 | 0.166 | 4.816 | 1.405, 8.226 | 0.006** |
| 74.0 - 115.0 | 73 | -4.83 | 9.00 | 1.959 | -1.589, 5.507 | 0.278 | 0.632 | -4.525, 5.789 | 0.810 | 2.226 | -1.176, 5.629 | 0.199 |
| Baseline body mass index | ||||||||||||
| 13.6 - < 22.6 | 69 | -7.30 | 13.59 | Ref | - | 0.015* | Ref | - | 0.694 | |||
| 22.6 - < 25.0 | 69 | -2.56 | 11.25 | 4.739 | 1.142, 8.336 | 0.010* | 2.003 | -1.949, 5.955 | 0.319 | |||
| 25.0 - < 27.8 | 72 | -1.94 | 8.54 | 5.362 | 1.802, 8.921 | 0.003** | 2.563 | -1.871, 6.998 | 0.256 | |||
| 27.8 - 43.8 | 71 | -4.65 | 8.93 | 2.646 | -0.926, 6.218 | 0.146 | 1.968 | -3.345, 7.282 | 0.466 | |||
| Baseline eGFR (mL/min/1.73 m2) | ||||||||||||
| 22.67 - < 61.30 | 70 | -1.20 | 7.80 | Ref | - | < 0.001*** | Ref | - | < 0.001*** | Ref | - | < 0.001*** |
| 61.30 - < 74.03 | 70 | -2.08 | 9.47 | -0.874 | -4.367, 2.619 | 0.623 | -0.008 | -3.543, 3.528 | 0.997 | -0.462 | -3.875, 2.950 | 0.790 |
| 74.03 - < 90.44 | 70 | -3.96 | 8.39 | -2.758 | -6.251, 0.735 | 0.121 | -1.070 | -4.621, 2.481 | 0.554 | -1.573 | -5.036, 1.890 | 0.372 |
| 90.44 - 173.50 | 71 | -9.05 | 14.77 | -7.850 | -11.331, -4.370 | < 0.001*** | -6.452 | -10.015, -2.890 | < 0.001*** | -7.206 | -10.606, -3.806 | < 0.001*** |
| Severe hypoglycemia | Univariate model | Initial multivariable model (univariate at P < 0.10) | Final multivariable model (stepwise selection at P < 0.05) | |||||||||
|---|---|---|---|---|---|---|---|---|---|---|---|---|
| N | No. of events | Incidence of events | OR PE | OR 95% CI | P value | OR PE | OR 95% CI | P value | OR PE | OR 95% CI | P value | |
| Factors investigated: age at registration, sex, diabetic complications (retinopathy, neuropathy, and nephropathy), atherosclerotic diseases (cerebrovascular disease, myocardial infarction/angina, and arteriosclerosis obliterans), other complications (hypertension and dyslipidemia), duration of diabetes, baseline profile (body weight, body mass index, HbA1c, serum creatinine, and eGFR), and baseline concomitant antidiabetic agents ( daily no. of insulin injections and use of sulfonylureas, biguanides, thiazolidinediones, and alpha-glucosidase inhibitors). ANOVA: analysis of variance; CI: confidence interval; eGFR: estimated glomerular filtration rate; HbA1c: hemoglobin A1c; NGSP: National Glycohemoglobin Standardization Program; PE: point estimate; Ref: reference. *P < 0.050. | ||||||||||||
| Sex | ||||||||||||
| Male | 216 | 11 | 5.1% | Ref | - | - | Ref | - | - | |||
| Female | 196 | 3 | 1.5% | 0.290 | 0.080, 1.054 | 0.060 | 0.304 | 0.082, 1.130 | 0.075 | |||
| Baseline HbA1c (NGSP, %) | ||||||||||||
| 5.60 - < 7.50 | 94 | 8 | 8.5% | Ref | - | 0.044* | Ref | - | 0.042* | 0.044* | ||
| 7.50 - < 8.30 | 106 | 2 | 1.9% | 0.207 | 0.043, 0.999 | 0.050* | 0.219 | 0.044, 1.083 | 0.063 | 0.207 | 0.043, 0.999 | 0.050* |
| 8.30 - < 9.30 | 108 | 2 | 1.9% | 0.203 | 0.042, 0.980 | 0.047* | 0.211 | 0.043, 1.046 | 0.057 | 0.203 | 0.042, 0.980 | 0.047* |
| 9.30 - 13.90 | 104 | 2 | 1.9% | 0.211 | 0.044, 1.019 | 0.053 | 0.170 | 0.034, 0.859 | 0.032* | 0.211 | 0.044, 1.019 | 0.053 |
| Constipation | Univariate model | Initial multivariable model (univariate at P < 0.10) | Final multivariable model (stepwise selection at P < 0.05) | |||||||||
|---|---|---|---|---|---|---|---|---|---|---|---|---|
| N | No. of events | Incidence of events | OR PE | OR 95% CI | P value | OR PE | OR 95% CI | P value | OR PE | OR 95% CI | P value | |
| Factors investigated: age at registration, sex, diabetic complications (retinopathy, neuropathy, and nephropathy), atherosclerotic diseases (cerebrovascular disease, myocardial infarction/angina, and arteriosclerosis obliterans), other complications (hypertension and dyslipidemia), duration of diabetes, baseline profile (body weight, body mass index, HbA1c, serum creatinine, and eGFR), and baseline concomitant antidiabetic agents ( daily no. of insulin injections and use of sulfonylureas, biguanides, thiazolidinediones, and alpha-glucosidase inhibitors). ANOVA: analysis of variance; CI: confidence interval; eGFR: estimated glomerular filtration rate; HbA1c: hemoglobin A1c; NGSP: National Glycohemoglobin Standardization Program; PE: point estimate; Ref: reference. *P < 0.050. | ||||||||||||
| Cerebrovascular disease | ||||||||||||
| No | 378 | 10 | 2.6% | Ref | - | - | Ref | - | - | |||
| Yes | 34 | 3 | 8.8% | 3.561 | 0.931, 13.618 | 0.063 | 3.253 | 0.816, 12.962 | 0.094 | |||
| Baseline HbA1c (NGSP, %) | ||||||||||||
| 5.60 - < 7.50 | 94 | 8 | 8.5% | Ref | - | 0.028* | Ref | - | 0.035* | Ref | - | 0.028* |
| 7.50 - < 8.30 | 106 | 1 | 0.9% | 0.102 | 0.013, 0.835 | 0.033* | 0.104 | 0.013, 0.854 | 0.035* | 0.102 | 0.013, 0.835 | 0.033* |
| 8.30 - < 9.30 | 108 | 2 | 1.9% | 0.203 | 0.042, 0.980 | 0.047* | 0.211 | 0.043, 1.028 | 0.054 | 0.203 | 0.042, 0.980 | 0.047* |
| 9.30 - 13.90 | 104 | 2 | 1.9% | 0.211 | 0.044, 1.019 | 0.053 | 0.222 | 0.046, 1.083 | 0.063 | 0.211 | 0.044, 1.019 | 0.053 |