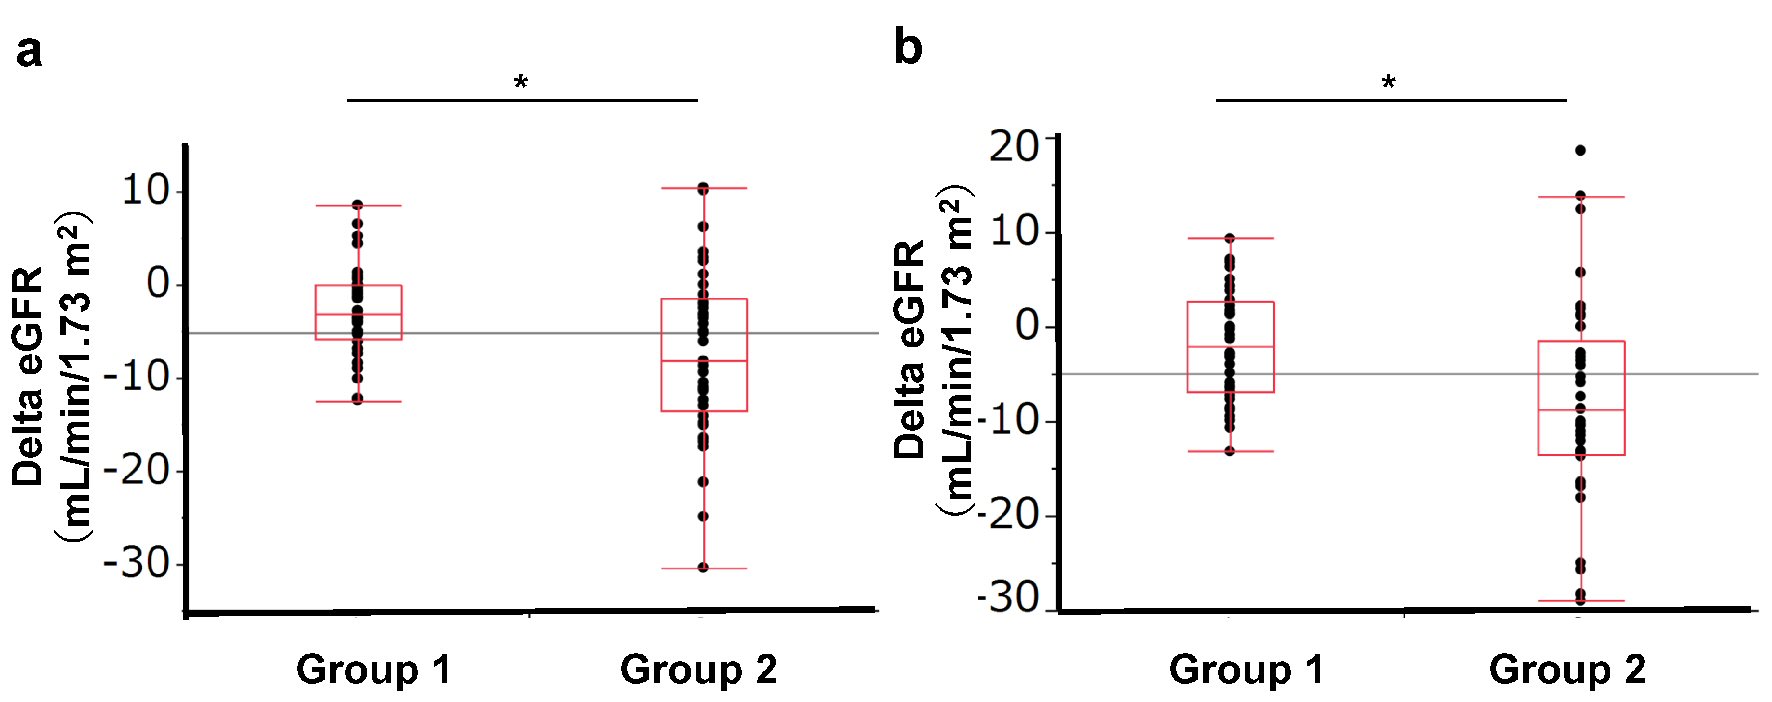
Figure 1. Change in eGFR according to baseline eGFR group. Group 1: eGFR < 80.0 mL/min/1.73 m2, Group 2: eGFR ≥ 80 mL/min/1.73 m2. (a) Change in eGFR from baseline to 4 weeks. (b) Change in eGFR from baseline to 12 weeks.
| Journal of Endocrinology and Metabolism, ISSN 1923-2861 print, 1923-287X online, Open Access |
| Article copyright, the authors; Journal compilation copyright, J Endocrinol Metab and Elmer Press Inc |
| Journal website http://www.jofem.org |
Original Article
Volume 8, Number 5, October 2018, pages 106-112
Effects of SGLT2 Inhibition on eGFR and Glomerular and Tubular Damage Markers in Japanese Patients With Type 2 Diabetes
Figure
Tables
| Baseline | 4 weeks | 12 weeks | P value | |||
|---|---|---|---|---|---|---|
| 0 vs. 4 weeks | 4 vs. 12 weeks | 0 vs. 12 weeks | ||||
| Mean ± standard deviation or medians (25th and 75th percentiles). CCr was calculated by Cockcroft and Gault equation. P values were determined by paired t-test or Wilcoxon signed-rank test. *P < 0.05. | ||||||
| Body weight (kg) | 78.3 (68.0, 90.6) | 77.4 (66.7, 90.0) | 76.2 (67.0, 89.0) | < 0.0001* | < 0.0001* | < 0.0001* |
| Body mass index (kg/m2) | 29.3 (26.6, 32.6) | 28.4 (26.0, 32.3) | 28.4 (25.7, 31.9) | < 0.0001* | < 0.0001* | < 0.0001* |
| HbA1c (mmol/mol) | 65 (57, 75) | 62 (55, 70) | 58 (53, 67) | < 0.0001* | < 0.0001* | < 0.0001* |
| HbA1c (%) | 8.1 (7.4, 9.0) | 7.8 (7.2, 8.6) | 7.5 (7.0, 8.3) | < 0.0001* | < 0.0001* | < 0.0001* |
| BUN (mg/dL) | 14.5 (12.0, 16.8) | 16.0 (13.0, 19.0) | 16.0 (13.0, 19.0) | 0.0031* | 0.073 | < 0.0001* |
| Cre (mg/dL) | 0.74 (0.58, 0.84) | 0.79 (0.63, 0.90) | 0.76 (0.60, 0.95) | < 0.0001* | 0.4 | < 0.0001* |
| eGFR (mL/min/1.73 m2) | 80.0 (69.4, 93.0) | 74.7 (63.7, 91.6) | 77.3 (65.4, 91.1) | < 0.0001* | 0.37 | < 0.0001* |
| CCr (mL/min) | 131 (99.3, 178) | 120 (87.0, 160) | 120 (88.0, 160) | < 0.0001* | 0.44 | < 0.0001* |
| LDL-C (mg/dL) | 101 (80.8, 130) | 98.5 (80.9, 115) | 104 (83.8, 127) | 0.003* | 0.0029* | 0.49 |
| HDL-C (mg/dL) | 50.0 (41.8, 58.3) | 48.5 (42.0, 57.5) | 52.0 (43.0, 59.5) | 0.28 | 0.0012* | 0.096 |
| TG (mg/dL) | 152 (103, 223) | 140 (97.5, 218) | 145 (94.8, 215) | 0.089 | 0.24 | 0.099 |
| UA (mg/dL) | 5.55 ± 1.29 | 4.93 ± 1.15 | 5.07 ± 1.18 | < 0.0001* | 0.028* | 0.0002* |
| Between baseline and 4 weeks after SGLT-2 inhibitor treatment | Between baseline and 12 weeks after SGLT-2 inhibitor treatment | |||||||||||
|---|---|---|---|---|---|---|---|---|---|---|---|---|
| Univariate regression model | Multivariate regression model | Univariate regression model | Multivariate regression model | |||||||||
| β | SE | P value | β | SE | P value | β | SE | P value | β | SE | P value | |
| *P < 0.05. | ||||||||||||
| Age (years) | 0.091 | 0.068 | 0.18 | -0.0079 | 0.082 | 0.92 | 0.14 | 0.080 | 0.083 | -0.031 | 0.087 | 0.72 |
| Sex | -0.15 | 0.85 | 0.86 | -0.2 | 0.86 | 0.82 | -0.97 | 1.00 | 0.33 | -0.89 | 0.87 | 0.31 |
| Body weight change (kg) | 0.78 | 0.48 | 0.11 | 0.65 | 0.46 | 0.16 | -0.21 | 0.34 | 0.55 | -0.45 | 0.29 | 0.13 |
| Basal eGFR (mL/min/1.73 m2) | -0.076 | 0.032 | 0.018* | -0.13 | 0.043 | 0.0046* | -0.16 | 0.034 | < 0.0001* | -0.19 | 0.039 | < 0.0001* |
| ACE inhibitor / ARB | -0.86 | 0.84 | 0.31 | -0.4 | 0.86 | 0.64 | -1.46 | 0.99 | 0.14 | -0.22 | 0.88 | 0.80 |
| Baseline - 4weeks | Baseline - 12weeks | |||||
|---|---|---|---|---|---|---|
| Group 1 | Group 2 | P value | Group 1 | Group 2 | P value | |
| Medians (25th and 75th percentiles). CCr was calculated by Cockcroft and Gault equation. P values were determined by Mann-Whitney U test. *P < 0.05. | ||||||
| Delta Body weight (kg) | -1.0 (-2.0, 0) | -1.0 (-2.3, 0) | 0.50 | -1.30 (-3.0, -0.45) | -1.90 (-4.0, -0.125) | 0.36 |
| Delta HbA1c (mmol/mol) | -2.0 (-5.0, 0) | -5.0 (-9.0, -1.0) | 0.016* | -5.5 (-9.8, 1.0) | -7.0 (-14, -2.5) | 0.12 |
| Delta HbA1c (%) | -0.20 (-0.40, 0) | -0.40 (-0.80, -0.1) | 0.016* | -0.50 (-0.88, 0.10) | -0.60 (-1.30, -0.25) | 0.11 |
| Delta BUN (mg/dL) | 0 (-2.0, 2.0) | 1.0 (-1.0, 4.0) | 0.095 | 2.0 (0, 3.0) | 1.0 (-1.0, 4.0) | 0.83 |
| Delta Cre (mg/dL) | 0.03 (0, 0.088) | 0.04 (0.01, 0.09) | 0.54 | 0.015 (-0.03, 0.11) | 0.05 (0.0005, 0.08) | 0.37 |
| Delta eGFR (mL/min/1.73 m2) | -3.05 (-5.9, 0) | -8.2 (-13.6, -1.5) | 0.0075* | -2.05 (-6.9, 2.65) | -8.80 (-13.6, -1.40) | 0.0009* |
| Delta CCr (mL/min) | -5.25 (-8.18, -0.14) | -14.8 (-25.6, -1.56) | 0.0021* | -4.61 (-11.1, -3.28) | -14.6 (-30.3, -5.91) | 0.0005* |
| Delta LDL (mg/dL) | -5.4 (-13.0, 7.05) | -7.6 (-15.6, 5.35) | 0.38 | 5.8 (-10.2, 13.8) | -2.9 (-8.75, 12.8) | 0.87 |
| Delta HDL (mg/dL) | 0 (-2.0, 2.5) | -1.0 (-4.0, 2.0) | 0.12 | 2.0 (-3.0, 8.2) | 0 (-3.0, 5.0) | 0.43 |
| Delta TG (mg/dL) | -6.0 (-31.0, 25.0) | -19.0 (-52.5, 24.0) | 0.28 | 5.0 (-24.0, 26.0) | -17.0 (-67.0, 9.0) | 0.052 |
| Delta UA (mg/dL) | -0.65 (-1.25, 0) | -0.7 (-1.2, 0) | 0.94 | -0.6 (-1.1, 0.2) | -0.5 (-1.1, 0.05) | 0.65 |
| Standard value | Baseline | 4 weeks | 12 weeks | P value | |||
|---|---|---|---|---|---|---|---|
| 0 vs. 4 weeks | 4 vs. 12 weeks | 0 vs. 12 weeks | |||||
| Mean ± standard deviation or medians (25th and 75th percentiles). CCr was calculated by Cockcroft and Gault equation. †The reference value of β2 microglobulin was 11 - 253 µg/day in our hospital. We used the spot urine sample and the urinary excretion levels of β2 microglobulin were described as micrograms per gram of creatinine. P values were determined by paired t-test or Wilcoxon signed-rank test. NAG: N-acetyl-β-D-glucosaminidase; L-FABP: liver-type fatty acid binding protein; β2MG: β2 microglobulin. *P < 0.05. | |||||||
| Body weight (kg) | 82.0 ± 15.3 | 81.6 ± 15.7 | 79.6 ± 16.1 | 0.53 | 0.0098* | 0.0039* | |
| Body mass index (kg/m2) | 28.8 ± 3.51 | 28.6 ± 3.38 | 27.9 ± 3.67 | 0.44 | 0.0094* | 0.0043* | |
| HbA1c (mmol/mol) | 68.6 ± 16.4 | 60.8 ± 9.28 | 54.6 ± 8.86 | 0.0022* | 0.012* | 0.0031* | |
| HbA1c (%) | 8.43 ± 1.50 | 7.71 ± 0.86 | 7.15 ± 0.82 | 0.0021* | 0.012* | 0.0031* | |
| eGFR (mL/min/1.73 m2) | 78.5 (67.1, 88.4) | 75.0 (70.1, 79.0) | 73.4 (66.8, 82.8) | 0.027* | 0.27 | 0.41 | |
| CCr (mL/min) | 127 ± 26.7 | 122 ± 29.5 | 120 ± 29.7 | 0.12 | 0.37 | 0.048* | |
| SBP (mm Hg) | 135 ± 19.6 | 130 ± 16.0 | 128 ± 15.7 | 0.073 | 0.43 | 0.024* | |
| DBP (mm Hg) | 81.6 ± 14.3 | 80.7 ± 11.6 | 78.7 ± 10.9 | 0.51 | 0.61 | 0.27 | |
| LDL-C (mg/dL) | 81.0 (72.2, 110) | 74.8 (64.0, 83.2) | 76.8 (64.2, 91.4) | 0.074 | 0.28 | 0.52 | |
| HDL-C (mg/dL) | 50.9 ± 15.0 | 51.9 ± 12.5 | 54.0 ± 14.6 | 0.46 | 0.15 | 0.079 | |
| TG (mg/dL) | 177 (95, 289) | 169 (94, 225) | 139 (89, 247) | 0.64 | 0.99 | 0.26 | |
| UA (mg/dL) | 5.69 ± 1.39 | 5.00 ± 1.19 | 4.92 ± 1.28 | 0.0068* | 0.56 | 0.0023* | |
| Urinary albumin (mg/g Cre) | ≤ 18.6 | 12.0 (6.6, 56.2) | 12.1 (7.5, 28.7) | 13.3 (6.3, 30.5) | 0.52 | 0.059 | 0.078 |
| Urinary NAG (U/g Cre) | ≤ 5.6 | 5.97 (2.67, 7.79) | 6.33 (5.31, 9.34) | 5.83 (4.73, 7.88) | 0.11 | 0.096 | 0.52 |
| Urinary L-FABP (µg/g Cre) | ≤ 8.4 | 2.70 (1.30, 5.80) | 2.91 (1.90, 4.00) | 2.30 (1.30, 4.16) | 0.4 | 0.65 | 0.77 |
| Urinary type IV collagen (µg/g Cre) | ≤ 7.3 | 5.40 (2.00, 7.20) | 5.30 (3.80, 6.70) | 4.60 (3.70, 6.50) | 0.19 | 0.52 | 0.71 |
| Urinary β2MG (µg/g Cre) | † | 78.6 (40.0, 181) | 111 (65.9, 173) | 133 (100, 243) | 0.95 | 0.12 | 0.12 |